From the Hypertension Unit, Hospital das Clínicas, Faculty of Medicine, University of São Paulo and the University of São Paulo Nursing School - São Paulo/SP, Brazil.
E-mail: [email protected]
Received for publication on December 11, 2003. Accepted for publication on April 15, 2004.
ORIGINAL RESEARCH
HYPERTENSION IN EMPLOYEES OF A UNIVERSITY
GENERAL HOSPITAL
Decio Mion Jr., Angela M. G. Pierin, Alberto P. Bambirra, Jorge H. Assunção, Juliana M. Monteiro, Roberta Y. Chinen, Roger B. Coser, Vânia N. Aikawa, Fernanda M. Cação, Mariana Hausen, Marcelo F. Vilibor, Nádia E. Aikawa, Sérgio N. Konno and Roger B. Coser
MION Jr. D et al. Hypertension in employees of a University General Hospital. Rev. Hosp. Clín. Fac. Med. S. Paulo 59(6):329-336, 2004.
PURPOSE: To find out the prevalence of hypertension in employees of the Hospital and relate it to social demographic variables.
METHODS: Blood pressure measurement was performed with a mercury sphygmomanometer, using an appropriate cuff size for arm circumference, weight, and height in a population sample of 864 individuals out of the 9,905 employees of a University General Hospital stratified by gender, age, and job position.
RESULTS: Hypertension prevalence was 26% (62% of these reported being aware of their hypertension and 38% were unaware but had systolic/diastolic blood pressures of ≥140 and/or ≥90 mm Hg at the moment of the measurement). Of those who were aware of having hypertension, 51% were found to be hypertensive at the moment of the measurement. The prevalence was found to be 17%, 23%, and 29% (P <.05) in physicians, nursing staff, and “others”, respectively. The
univariate analysis showed a significant odds ratio for the male gender, age ≥50 years, work unit being the Institute of Radiology and the Administration Building, educational level ≤elementary school, length of work ≥10 years, and body mass index ≥30 kg/m2. The multivariate logistic regression model revealed a statistically significant association of
hypertension with the following variables: gender, age, skin color, family income, and body mass index.
CONCLUSIONS: Hypertension prevalence was high, mainly in those who were not physicians or members of the nursing staff. High-risk groups (obese, non-white, men, low family income) should be better advised of prevention and early diagnosis of hypertension by means of special programs.
KEYWORDS: Hypertension. Arterial blood pressure measurement. Employee. Hospital.
Hypertension is an important cause of morbidity and mortality due to its high prevalence and severe conse-quences.1
Although there are no Brazilian surveys on hypertension prevalence among health care professionals, some regional studies reveal a prevalence ranging from 22% to 44% in the ur-ban adult population, considering the hypertension criterion as blood pres-sure ≥140/90 mm Hg.2-7
There are some studies in specific populations such as general
employ-ees,8 civil construction workers,9 bank
employees,10 university servants,11 and
workers in a leather factory,12
reveal-ing prevalences of 15%, 16%, 18%, 22% and 56%, respectively. In the health area, a study carried out in the city of Salvador, Bahia, with the mem-bers of a hospital nursing staff showed
a prevalence of 36%.13 Again, in the
health area, physicians of a nonselected sample of 1,395 physi-cians from São Paulo State14 showed a
prevalence of 26%, and among the employees of a military hospital15 the
prevalence was 8%. Therefore, the prevalence is very different in the sev-eral groups studied because of the cri-teria applied for hypertension diagno-sis and sample selection, among other factors.
funda-mental for planning hypertension pre-ventive and therapeutic measures, it was decided that this topic would be investigated at Hospital das Clínicas, which is the largest hospital complex in Latin America, has a great number of employees working in different job positions, and therefore is able to pro-vide a broad view on hypertension among health care employees.
Thus, this study aimed at identify-ing in employees of the referred hos-pital the following: a) hypertension prevalence; and b) associations and possible links between hypertension and demographic data, education, family income, body mass index, and aspects related to work, such as job position, work unit, work shift, and years of work.
METHODS
The study was approved by the Ethics Committee. Employees who agreed to participate in the study were included after signing an informed consent document.
The sample was stratified by gen-der, age, and job position (physicians, nursing staff, and “others”). A randomized selection of 10% of each variable was performed, and a sample of 864 individuals was calculated out of the 9,905 employees.
In terms of job positions, the em-ployees were classified into 3 large groups: a) physicians; b) members of the nursing staff, including registered nurses, auxiliary nurses, nurse aids, and nurse technicians; and c) “others” other employees occupying adminis-trative and management positions (tasks including skilled, semi-skilled, and nonskilled performance, nonop-erational support tasks, and services).
Data were collected by interviews using a specific form that addressed the following aspects: a) identification gen-der, age, and skin color; b) education; c)
social economical level family income; d) work job position, unit, shift, and years of work; and d) hypertension awareness of being hypertensive.
At the end of the interview, the fol-lowing measurements were taken: a) arm circumference to identify the ap-propriate cuff size to be used; b) blood pressure; and c) weight and height to calculate the body mass index.
Both arm circumferences were measured without clothing in the mid-dle third between the olecranon and the acromion with the arm stretched alongside the body.
Blood pressure measurement was taken according to the recommenda-tions of the Fourth Brazilian Guidelines on Hypertension.16 An indirect method
with an auscultatory technique using a suitably calibrated mercury sphygmo-manometer (Baummometer, Desk Model, New York, EUA) was employed. The volunteers were in the sitting po-sition and at rest for 10 minutes, had not eaten, had not ingested drinks contain-ing alcohol or caffeine, and had not smoked for at least 30 minutes before the measurements. Additionally, the volunteers were asked to empty their bladders prior to the measurement. Blood pressure measurements were taken in the arm having the larger cir-cumference. Three measurements or as many as necessary were taken with the “standard” (inflatable pouch 12 x 23 cm) cuff until the difference between the last 2 readings was not higher than 4 mm Hg. In cases where the arm cir-cumference was smaller than 24 cm or larger than 32 cm, the same procedure was performed but using an “appropri-ate” cuff-to-arm circumference (inflat-able pouch 9 x 18 cm for arm circum-ferences smaller than 24 cm, and 15 x 33 cm for arm circumferences between 33 and 47 cm). Blood pressure meas-urements were obtained using the arith-metic mean of the 2 last readings. Body weight was measured with the employ-ees wearing light clothes and no shoes.
Body mass index was calculated with the formula weight (kg)/height (m)2.
All observers were trained for meas-uring blood pressure and succeeded in the certification test to do so. The course consisted of theoretical exhibi-tion followed by knowledge evalua-tion with an approval criterion of at least 80% of the 15 questions, as well as training with a specialist to solve doubts and to show the blood pressure measurement procedure. At the end of the course, an evaluation test was con-ducted with: a) a video that showed the mercury sphygmomanometer dur-ing blood pressure measurement and reproduced Korotkoff’s sounds, con-sisting of 24 systolic and diastolic blood pressure measurements. Differ-ences of a maximum of ± 2 mm Hg and maximum 2 differences up to ± 4 mm Hg were accepted in the 24 measure-ments for approval (video “Standard-izing Measurement”, Shared Care, California, EUA); and b) an ausculta-tory test with a specialist using a dou-ble stethoscope and 3 measurements taken for 2 individuals. Differences of ± 4 mm Hg and maximum 2 differ-ences up to ± 6 mm Hg were accepted in the 12 measurements. Moreover, all of the trainees underwent tonal and vocal audiometric tests at the Otorhi-nolaryngology Service which showed normal results.
The diagnosis of hypertension was established when: a) the employee was aware of having hypertension by an-swering positively the question, “Do you have high blood pressure dis-ease?”; or b) systolic blood pressure level was ≥140 mm Hg and/or diastolic blood pressure level was ≥90 mm Hg at the moment of the measurement.
Data were presented as mean ± standard deviation and absolute and relative frequencies. The statistical analysis was carried out by the Statis-tical Analysis System, using either the chi-square (χ2) test, odds ratio test, or
vari-ables and variance analysis for the continuing variables. A multivariate analysis was performed with a logistic regression model on a selection of vari-ables. Values of P <.05 were considered statistically significant.
RESULTS
Out of the sample of 864 individu-als, a total of 810 people were inter-viewed due to the difficulty in locating some individuals in spite of 2 attempts to do so or because of their refusal to participate in the study. The sample (Ta-bles 1, 2, and 3) consisted mainly of fe-male employees (68%), age group be-tween 31 to 50 years (64%), white skin color (62%), high school education (29%) and university graduated (34%), family income ranging between US$400.00 and US$1,600.00 monthly (59%) and BMI in the range of over-weight or obesity levels (49%). In terms of job positions, 11% were physicians,
34% were members of the nursing staff, (registered nurses = 15%, auxiliary nurses = 67%, nurse aids = 16%, and nurse technicians = 1%), and the others (55%) had different job positions. Re-garding work units, most of the employ-ees studied (41%) were from the Central Institute. Concerning work shifts, most of the employees (84%) worked in the daytime; with respect to years of work, the highest percentage (38%) was repre-sented by employees who had worked in the institution for 10 to 20 years.
Blood pressure was found to be higher (P <.05) in men, age >50 years, non-white skin color, education <el-ementary school level, family income <US$ 400, and BMI in the range of overweight and obesity levels. In terms of job positions, blood pressure was found to be higher (P <.05) in employ-ees whose job position fell in the “oth-ers” category, employees whose work unit was the Administration Building, and employees who had worked longer than 10 years. There was no
dif-ference in blood pressure regarding work shifts (Tables 1, 2, and 3).
Hypertension prevalence was 26% in the employees, with most of these (62%) being aware of having hyperten-sion by answering positively (“yes”) to the question: “Do you have high blood pressure disease?” and the oth-ers (38%) who reported being unaware of their hypertension by having a systolic blood pressure level ≥140 mm Hg and/or diastolic blood pressure level ≥90 mm Hg at the moment of the measurement. Of those who reported being aware of their hypertension, practically half (51%) were found to be hypertensive at the moment of the measurement, and 49% were found to be normotensive. Among those who were unaware of their hypertension but who had high blood pressure levels at the moment of the measurement, a high percentage (91%) answered negatively (“no”) when asked if they had “high blood pressure disease”, and 9% an-swered they did not know if they had
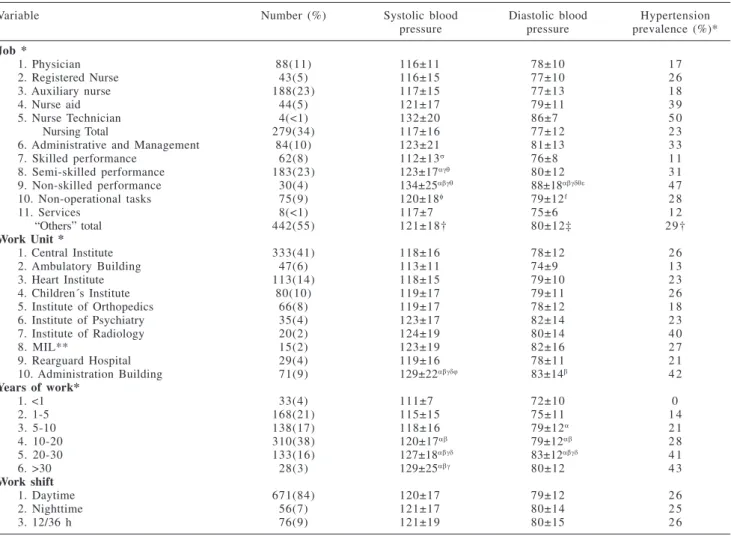
Table 1 - Systolic blood pressure, diastolic blood pressure (mean ± SD, mm Hg) and hypertension prevalence in employees of a university general hospital according to the demographic data, education, and family income.
Variable Number (%) Systolic blood Diastolic blood Hypertension
pressure pressure prevalence (%) *
Gender *
1. Male 262(32) 125±17 83±12 3 2
2. Female 548(68) 117±17α 77±12α 2 2
Age (years) *
1. ≤ 30 138(17) 112±11 72±10 8
2. 31-40 262(32) 116±15 77±11α 1 7
3. 41-50 256(32) 121±16αβ 81±12αβ 2 9
4. 51-60 132(16) 131±20αβγ 84±11αβ 5 1
5. > 60 22(3) 128±18αβ 79±11 5 5
Skin color *
1. White 506(62) 118±16 78±11 2 2
2. Mulatto 152(19) 122±19 79±13 2 7
3. Black 124(15) 123±20α 81±15 3 5
4. Oriental 28(3) 119±10 80±8 3 2
Education *
1. Illiterate; able to read and write 10(1) 125±22 84±14 4 0
2. Incomplete Elementary School 67(8) 131±22 85±15 4 8
3. Elementary School graduate 106(13) 123±17β 80±13 3 9
4. Incomplete High School 59(8) 121±17β 80±11 1 9
5. High School graduate 237(29) 119±17β 78±12β 2 2
6. Incomplete University degree 55(7) 118±15β 78±13β 1 6
7. University degree graduate 276(34) 116±15βγ 78±10β 2 1
Family income*
1. Up to US$400.00 161(20) 124±19 81±13 3 4
2. From US$400.00 to US$ 800.00 256(32) 119±16α 78±13 2 4
3. From US$800.00 to US$ 1,600.00 218(27) 120±18 79±12 2 5
4. More than US$1,600.00 168(21) 116±13α 78±10 2 0
Table 3 - Systolic blood pressure, diastolic blood pressure (mean ± SD, mm Hg) and hypertension prevalence in employees of a university general hospital according to body mass index.
Body Mass Index* Number (%) Systolic blood Diastolic blood Hypertension
pressure pressure prevalence (%)*
1. Low body weight (<18.5) 014(2) 110±8 72±10 0
2. Normal (between 18.5 and 24.9) 390(49) 117±16 77±11 1 5
3. Overweight (between 25.0 and 29.9) 291(36) 122±17β 81±11β 3 3
4. Obesity I (between 30.0 and 34.9) 081(10) 122±19 81±13β 3 8
5. Obesity II (between 35.0 and 39.9) 017(2) 131±18αβ 88±18αβ 6 5
6. Obesity III (>40) 006(1) 134±22α 95±16αβγδ 100
*P <.05; α: P <.05 vs 1; β: P <.05 vs 2; γ: P <.05 vs 3; δ: P<.05 vs 4
Table 2 - Systolic blood pressure, diastolic blood pressure (mean ± SD, mm Hg) and hypertension prevalence in employees of a university general hospital according to variables related to job positions.
Variable Number (%) Systolic blood Diastolic blood Hypertension
pressure pressure prevalence (%)*
Job *
1. Physician 88(11) 116±11 78±10 1 7
2. Registered Nurse 43(5) 116±15 77±10 2 6
3. Auxiliary nurse 188(23) 117±15 77±13 1 8
4. Nurse aid 44(5) 121±17 79±11 3 9
5. Nurse Technician 4(<1) 132±20 86±7 5 0
Nursing Total 279(34) 117±16 77±12 2 3
6. Administrative and Management 84(10) 123±21 81±13 3 3
7. Skilled performance 62(8) 112±13σ 76±8 1 1
8. Semi-skilled performance 183(23) 123±17αγθ 80±12 3 1
9. Non-skilled performance 30(4) 134±25αβγθ 88±18αβγδθε 4 7
10. Non-operational tasks 75(9) 120±18φ 79±12f 2 8
11. Services 8(<1) 117±7 75±6 1 2
“Others” total 442(55) 121±18† 80±12‡ 29†
Work Unit *
1. Central Institute 333(41) 118±16 78±12 2 6
2. Ambulatory Building 47(6) 113±11 74±9 1 3
3. Heart Institute 113(14) 118±15 79±10 2 3
4. Children´s Institute 80(10) 119±17 79±11 2 6
5. Institute of Orthopedics 66(8) 119±17 78±12 1 8
6. Institute of Psychiatry 35(4) 123±17 82±14 2 3
7. Institute of Radiology 20(2) 124±19 80±14 4 0
8. MIL** 15(2) 123±19 82±16 2 7
9. Rearguard Hospital 29(4) 119±16 78±11 2 1
10. Administration Building 71(9) 129±22αβγδϕ 83±14β 4 2
Years of work*
1. <1 33(4) 111±7 72±10 0
2. 1-5 168(21) 115±15 75±11 1 4
3. 5-10 138(17) 118±16 79±12α 2 1
4. 10-20 310(38) 120±17αβ 79±12αβ 2 8
5. 20-30 133(16) 127±18αβγδ 83±12αβγδ 4 1
6. >30 28(3) 129±25αβγ 80±12 4 3
Work shift
1. Daytime 671(84) 120±17 79±12 2 6
2. Nighttime 56(7) 121±17 80±14 2 5
3. 12/36 h 76(9) 121±19 80±15 2 6
*P <.05 regarding job, work unit, and years of work; **MIL = Medical Investigation Laboratories; α: P <.05 vs 1; β: P <.05 vs 2; γ: P <.05 vs 3; δ: P <.05 vs 4; ϕ: P <.05 vs 5; σ: P <.05 vs 6; θ: P <.05 vs 7; ε: P <.05 vs 8; f: P <.05 vs 9; † P <.05 vs members of the nursing staff and physicians; ‡ P <.05 vs nursing staff
“high blood pressure disease.” Hypertension prevalence in terms of job positions, ie, physicians, nurs-ing staff, and others, was 17%, 23%, and 29%, respectively (P <.05) in the employees studied; it was 8%, 23%,
and 23% (P >.05) in women and 24%, 21%, and 38% (P <.05) in men.
The univariate analysis showed that hypertension was significantly associ-ated (P <.05) with the male gender, older age, non-white skin color, low
management), in the Institute of Radi-ology and the Administration Build-ing; and in employees with longer years of work. There was no difference regard-ing work shifts (Tables 1 and 2).
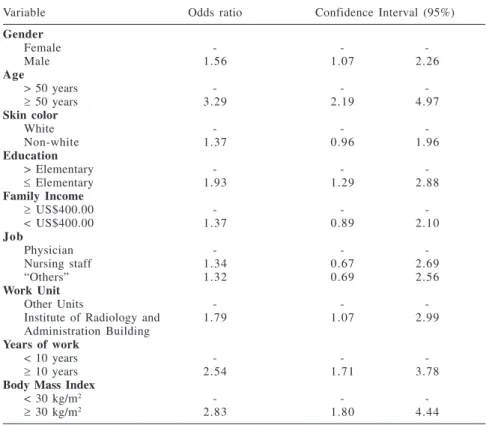
The univariate analysis (Table 4) showed a significant odds ratio for the male gender, age ≥ 50 years, work unit in the Institute of Radiology and the Administration Building, education level ≤ elementary school, length of work ≥ 10 years, and BMI ≥ 30 kg/m2.
The multivariate logistic regression model (Table 5) revealed, with a sensi-tivity of 71.6% and specificity of 70.1% with the probability of 0.26, that of all variables submitted to the analy-sis gender, age, skin color, education, family income, job position, work unit, work shift, length of work, and body mass index only the variables gender, age, skin color, family income, and body mass index had a statistically sig-nificant association with hypertension. Therefore, in terms of age, the risk of developing hypertension increases 7.9% for each additional year of life. Concerning body mass index, the risk of having hypertension was 17.3% higher for each additional unit in BMI (1 kg/m2). Regarding gender, men were
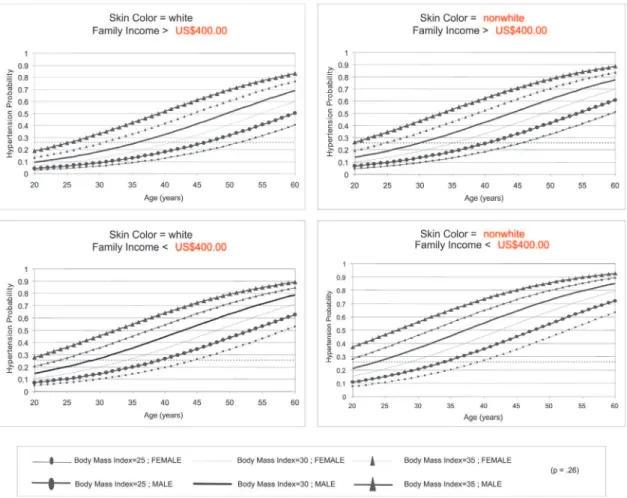
49% more likely to have hypertension than women. Analyzing the skin color, nonwhite individuals were 54.7% more likely to have hypertension than the white individuals. Finally, regarding family income, the employees whose family income was lower than US$400.00 were 65.5% more likely to have hypertension. The estimated
prob-abilities of hypertension according to the criterion adopted, at levels either reported before or at the moment of the measurement, according to gender, age, skin color (white or not white), family income (higher or lower than US$400.00), and BMI, are presented graphically in Figure 1. Thus, for ex-ample, according to the data showed in the upper left panel in Figure 1, a white female employee, at the age of 40, with a family income higher than US$400.00 and a BMI of 35, has a 40% chance to have hypertension according
to the criteria applied in this study. On the other hand, according to the data shown in the lower right panel in Fi-gure 1, a non-white female employee at the age of 40, having a family in-come lower than US$400.00 and the same BMI of 35, is 65% more likely to present hypertension.
DISCUSSION
The main finding of this study is that the prevalence of hypertension in
Table 5 - Results of the multivariate logistical regression model for hypertension in employees of a university general hospital.
Variable Estimated Parameter Standard Error Odds ratio Confidence Interval (95%)
Interceptor -8.9691 0.7653
Age (years) 0.0765 0.0099 1.0790 1.0590 1.1000
Body mass index (kg/m2) 0.1594 0.0216 1.1730 1.1240 1.2240
Gender 0.3994 0.1896 1.4910 1.0280 2.1620
Skin color 0.4362 0.1889 1.5470 1.0680 2.2400
Family Income 0.5038 0.2168 1.6550 1.0820 2.5310
N = 794; Probability = .26; Sensitivity = 70.3%; Specificity = 70.6%
Table 4 - Results of the univariate analysis (odds ratio) in employees of a university general hospital.
Variable Odds ratio Confidence Interval (95%)
Gender
Female - -
-Male 1.56 1.07 2.26
Age
> 50 years - -
-≥ 50 years 3.29 2.19 4.97
Skin color
White - -
-Non-white 1.37 0.96 1.96
Education
> Elementary - -
-≤ Elementary 1.93 1.29 2.88
Family Income
≥ US$400.00 - -
-< US$400.00 1.37 0.89 2.10
Job
Physician - -
-Nursing staff 1.34 0.67 2.69
“Others” 1.32 0.69 2.56
Work Unit
Other Units - -
-Institute of Radiology and 1.79 1.07 2.99
Administration Building
Years of work
< 10 years - -
-≥ 10 years 2.54 1.71 3.78
Body Mass Index
< 30 kg/m2 - -
a population of employees who work in the health care area (26%) is higher than that observed in the general popu-lation (22%) of the city of São Paulo.6
However, this percentage is lower than the prevalence observed in the general population in the town of Cotia (met-ropolitan area of São Paulo) with 48% in men and 41% in women, or in cit-ies of the State of São Paulo such as Araraquara (28%), Catanduva (31%), and Piracicaba (33%).4,2,7
On the other hand, considering that the studied population was hospital em-ployees, the prevalence obtained is much higher than that observed in a pre-vious study carried out in the population of hospital employees (8%)15. However,
since that study was conducted in a mili-tary hospital, its population might have presented different characteristics from those observed in the population
analyzed in the present study, leading to such a difference in the prevalence.
Concerning the demographic data—gender, age, skin color, educa-tion, and family income—the preva-lence followed the characteristics that were already known for hypertension: it is higher in men, in older age groups, among non-white individuals, and in those who have a low level of educa-tion and low family income.
The employee’s job position influ-enced the blood pressure level and hy-pertension prevalence in that the employ-ees whose job positions fell in the “oth-ers” category presented both higher blood pressure levels and also higher hyperten-sion prevalence than physicians and members of the nursing staff. Moreover, they presented low educational level, low family income, and high body mass in-dex, confirming studies17-19 that report that
hypertension prevalence is higher among employees with low-skilled jobs, with lower social economical status and un-healthy lifestyles that predispose them to obesity. Regarding the work units, there was a higher percentage of hypertensive individuals at the Institute of Radiology and at the Administration Building. This finding may be due to the fact that most employees there fell on “others” job cat-egory. Excessive psychological demand at work, excessive work, and a short time to perform it, coupled with many mands added to the little control and de-cision-making at work are stressful stimuli that increase the risk of hyperten-sion up to 80% and can be taken into ac-count in the analysis of the differences ob-served.20
Although important differences in prevalence were found according to job positions, the strong influence of
ables such as gender, age, skin color, family income, and body mass index was confirmed once more by means of multivariate analysis. Job positions were not included in the logistic regres-sion model because the other variables had stronger influences on the prob-ability of developing hypertension. The large probability differences found with regard to job position were probably due to the fact that the job position is strongly related to education, family income, and skin color.
Findings of higher prevalences of hypertension in men and the increase of blood pressure with age were reconfirmed. Concerning skin color and family income, the results of the present study confirmed the strong as-sociation of blood pressure increase with non-white skin color and low family income. It is important to high-light that this fact should be analyzed inside the social economical context since non-white people as well as their descendants often have lower social economical levels and consequently lower educational level and family in-come. Education, even if not the final multivariate analysis model, should be taken into account due to the associa-tion between higher blood pressure and lower educational level. Explana-tions for the association between so-cial economical status and blood pres-sure can be related to 3 special factors: access to health services, including di-agnosis and blood pressure control treatment; establishment of blood pres-sure determinants such as obesity, al-cohol, and physical activity; and
psy-chosocial factors.
Regarding the body mass index, the already established association be-tween body weight increase and hyper-tension was also observed, considering that 33% of the employees who were overweight and 46% of those who were obese were hypertensive indi-viduals. It is important to point out that almost half of the employees had a BMI that was above normal, probably caused by unhealthy lifestyles. Several studies have reported that hyperten-sion risk increases progressively with elevated BMI rates. In a representative sample from Porto Alegre, Brazil, it was observed that obesity analyzed by BMI was associated with hypertension prevalence in both genders.21
Thus, this study highlighted the strong influence of demographic and social economical factors on blood pressure increase, revealing the impor-tance of hypertension among employ-ees of the Brazilian health care area and reinforcing the need for hyperten-sion prevention and control. Since it is a distinct population that is involved with a hospital environment and, con-sequently, can have access to informa-tion, prevention methods, early dis-ease diagnosis and treatment, a lower hypertension prevalence was expected to be found. However, the results show the need for special programs at the workplace for higher-risk groups, such as those whose job fell in the “others” category, as well as males, the elderly, non-white, those whose family income and educational levels are low, and those who are obese. These special
programs should focus on facilitating the adoption of healthy lifestyles and measures to prevent high blood pres-sure, favoring early diagnosis of the disease and hypertension control.
This study was possibly limited by a couple of factors. First, blood pres-sure was analyzed only once. There-fore, hypertension prevalence based on the criterion of blood pressure in-crease at the moment of the measure-ment may be overestimated. However, most of the studies of this nature do not take blood pressure measurements on numerous occasions. A second limi-tation was that the reported awareness of having hypertension was included in the calculation of hypertension prevalence. Although patient-reported diagnoses could be mistaken, a study carried out in employees at Rio de Ja-neiro State University showed good reproducibility of reported diagnosis history and hypertension treatment.22
ACKNOWLEDGEMENTS
We are grateful for the invaluable cooperation of Dr. Anacleto Valtorta, Technical Director of the Health Serv-ice; Mr. Jorge Luiz Torrezan, Technical Assistant of the Human Resources De-partment and Nurse Josiane Lima, of the Hypertension Laboratory; Dr. Olavo Mion and Dr. Renata C. Di Francesco, of the Otorhinolaryngology Service; Ms. Tatiana Sales and Ms. Maria Elisa Emiliano; Ms. Júlia Fukushima, statis-tician and all the employees who agreed to participate in the study.
RESUMO
MION D e col. Hipertensão arterial em funcionários de um Hospital Uni-versitário. Rev. Hosp. Clín. Fac. Med. S. Paulo 59(6):329-336, 2004.
OBJETIVO: Conhecer a
preva-lência de hipertensão arterial em fun-cionários de um complexo hospitalar e relacionar com variáveis sócio demográficas.
MÉTODOS: Foi medida a pressão arterial com aparelho de coluna de
mer-cúrio e manguito adequado à circunfe-rência do braço, o peso e a altura em amostra de 864 dos 9.905 funcionários do Hospital Universitário estratificada de acordo com sexo, idade e ocupação.
hipertensão foi de 26% (hipertensão referida = 62% ou pressão sistólica
≥ 140 e/ou ≥ 90 mm Hg no momento da medida = 38%). Dos que referiram 51% estavam hipertensos no momen-to da medida. A prevalência foi 17, 23 e 29% (p < 0,05) nos médicos, enfer-magem e “outros”. Análise univariada mostrou “odds ratio” significante para o sexo masculino, idade ≥ 50 anos, unidade de trabalho para o Instituto de Radiologia e Prédio da Administração,
escolaridade ≤ primeiro grau, tempo de trabalho ≥ 10 anos e índice de massa corporal (IMC) maior ou igual a 30 kg/m2. O modelo de regressão logística
com procedimento “stepwise” mos-trou associação estatisticamente significante com hipertensão arterial para as variáveis: sexo, idade, cor da pele, renda familiar e IMC.
CONCLUSÃO: A prevalência de hipertensão foi alta em funcionários do Complexo Hospital das Clínicas,
principalmente nos de ocupação dife-rente de médico e enfermagem. Os gru-pos de maior risco (homens, cor preta, baixa renda familiar, obesos) precisam ser orientados quanto a prevenção e diagnóstico precoce da doença através de programas especiais.
UNITERMOS: Hipertensão arteri-al. Medida da pressão arteriarteri-al. Fun-cionários. Hospital.
REFERENCES
1. Lessa I. Epidemiologia da hipertensão arterial. In: LESSA I. O adulto brasileiro e as doenças da modernidade: Epidemiologia das doenças crônicas não transmissíveis. 10 ed. São Paulo e Rio de Janeiro, SP e RJ, Hucitec/Abrasco, 1998. p. 77-96. 2. Freitas OC, Resende de Carvalho F, Marques Neves J, Veludo PK,
Silva Parreira R, Marafiotti Goncalves R, et al. Prevalence of hypertension in the urban population of Catanduva, in the State of Sao Paulo, Brazil. Arq Bras Cardiol 2001;77(1):9-21. 3. Fuchs FD, Moreira LB, Moraes RS, et al. Prevalência de hipertensão arterial sistêmica e fatores associados na região urbana de Porto Alegre: estudo de base populacional. Arq Bras Cardiol 1995;63:473-9.
4. Lolio CA. Prevalência de hipertensão arterial em Araraquara. Arq Bras Cardiol 1990;55(3):167-73.
5. Martins IS, Marucci MF, Velasquez-Melendez G, et al. Doenças cardiovasculares ateroscleróticas, dislipidemias, hipertensão, obesidade e diabetes melito em população da área metropolitana da região Sudeste do Brasil. III – Hipertensão. Rev Saúde Pública 1997;31(5):466-71.
6. Rego RA, Berardo FA, Rodrigues SS. et al. Risk factors for chronic non-communicable diseases: a domiciliary survey in the municipality of Sao Paulo, SP (Brazil). Methodology and preliminary results. Rev Saúde Pública 1990;24(4):277-85. 7. Ayres JE. Prevalence of hypertension in the city of Piracicaba.
Arq Bras Cardiol 1991;57:33-6.
8. Ribeiro MD, Ribeiro AB, Stabile NC et al. Prevalência de hipertensão arterial na força de trabalho da grande São Paulo: influência da idade, sexo e grupo étnico. Rev Ass Med 1982; 28:209-11.
9. Melhado JC, Mosa AAP, Dine JM. Avaliação de níveis de pressão arterial em operários da construção civil. Revista Brasileira de Saúde Ocupacional 1984;45(12):68-73.
10. Chor D. Hipertensão arterial entre funcionários de banco estatal no Rio de Janeiro. Hábitos de vida e tratamento. Arq Bras Cardiol 1998;71(5):653-60.
11. Nogueira AR, Alves PM, Miranda RF et al. Colesterol e outros fatores de risco cardiovascular nos servidores da UFRJ. Prevalência e influência de variáveis sociais. Arq Bras Cardiol 1990;55:227-32.
12. Cordeiro R, Lima FE, Almeida IM. Pressão arterial em trabalhadores de cortume. Rev Saúde Pública 1998;32:467-76.
13. Aquino EMLL, Magalhães LBNC, Araújo MJ, et al. Hipertensão arterial em trabalhadoras de enfermagem-padrão de ocorrência, diagnóstico e tratamento. Arq Bras Cardiol 2001; 76:197-202.
14. Dioguardi GS, Pimenta J, Knoplic J, et al. Fatores de risco para doenças cardiovasculares em médicos. Dados preliminares do projeto VIDAM da Associação Paulista de Medicina. Arq Bras Cardiol 1994;62:383-8.
15. Facci Jr C, Carvalho JJM, Facci A, et al. Prevalência de hipertensão arterial nos funcionários de um hospital geral. Arq Bras Cardiol 1986;46:195-8.
16. IV Diretrizes Brasileiras de Hipertensão Arterial. Hipertensão 2002;5(4):126-63.
17. Helmert U, Mielck A, Classen E. Social inequities in cardiovascular disease risk factors in East and West Germany. Soc Sci Med 1992;35:1283-92.
18. Singh RB, Sharma JP, Rastogi V, Niaz MA, Singh NK. Prevalence and determinants of hypertension in the Indian social class and heart survey. J Hum Hypertens 1997;11(1):51-6. 19. Bone LR, Hill MN, Stallings R, Gelber AC, Barker A, Baylor I, et
al. Community health survey in an urban African-American neighborhood: distribution and correlates of elevated blood pressure. Ethn Dis 2000;10(1):87-95.
20. Schnall PL, Schwartz JE, Landsbergis PA, Warren K, Pickering TG. Relation between job strain, alcohol, and ambulatory blood pressure. Hypertension 1992;19(5):488-94.
21. Gus M, Moreira LB, Pimentel M et al. The association between different measurements of obesity and the prevalence of hypertension. Arq Bras Cardiol 1998;70(23):111-14. 22. Faerstein E, Chor D, Lopes CS. Confiabilidade da História Referida