J of Evolution of Med and Dent Sci/ eISSN- 2278-4802, pISSN- 2278-4748/ Vol. 4/ Issue 54/ July 06, 2015 Page 9375
A STUDY OF RELATIONSHIP BETWEEN ARTERIAL BLOOD PRESSURE AND
BODY MASS INDEX IN YOUNG ADULTS
Vesti Randa Solanki1, M. Shiralkar2, R. Soni3
HOW TO CITE THIS ARTICLE:
Vesti Randa Solanki, M. Shiralkar, R. Soni. A Study of Relationship between Arterial Blood Pressure and Body Mass Index in Young Adults . Journal of Evolution of Medical and Dental Sciences 2015; Vol. 4, Issue 54, July 06; Page: 9375-9382, DOI:10.14260/jemds/2015/1361
ABSTRACT: The present study was done to find out the correlation between body mass index (BMI) and blood pressure, systolic blood pressure (SBP), diastolic blood pressure (DBP); pulse pressure (PP) and mean arterial pressure (MAP) values. There is paucity of information on the variation in blood pressure and pulse rate parameters of normal individuals. The aim of the study was to assess the correlation between BMI and BP. The study was conducted in 184 MBBS 1st year students. There
were 119 male and 65 female students. In view of gender differences in autonomic regulation, data of male and female subjects were analyzed separately. We used analysis of variance to compare differences between Mean±SD, maximum, minimum values and Pearson correlations of BMI and blood pressure values. CONCLUSION: There is Mean±SD of blood pressure was higher in overweight subjects as compared to underweight subjects. A p value *0.05 and * 0.01 was considered statistically significant for both male as well as in female subjects. There was significant Pearson’s correlation between BMI and BP in both male as well as in female subjects.
KEYWORDS: Systolic blood pressure, Diastolic blood pressure, Pulse pressure, Mean arterial pressure and Body mass index.
INTRODUCTION: The world is rapidly modernizing so the life is becoming more fast, competitive and stressful. This has a direct impact on the health status of the population. In large cross sectional study of adolescents, BMI has been shown to be a better index of body fatness as compared to waist- hip ratio.[1]Hypertension is a common cardiovascular disease. It is as prevalent in developing
countries as in industrialized developed ones, affecting at least 10% of the adult population in most countries. Hypertension is an entity associated with high morbidity and mortality. This disease is a silent threat to the health of people all over the world. It is suggested that hypertension has its origin in childhood or adulthood but goes undetected unless specifically looked for during this period. Blood pressure is one of the most important physiological characters. It is sensitive to socioeconomic conditions, urbanization, activity patterns, diet, body weight and fat, other physical and cultural conditions apart from having a strong genetic as well as physiological components.[2]Blood pressure
(BP) is regulated by activity in the autonomic nervous system.[3] Obesity if associated with
sympathetic activation, it is the leading risk factor for the development of hypertension.[4]
Hyper-tension is a major problem, affecting both developed and developing countries; and it may lead to irreversible damages in vital organs, including central nervous system, cardiovascular system, and kidney. Besides being a major cause of morbidity and mortality, uncontrolled high blood pressure has a heavy impact on patients and families.[5] The price we are paying for an affluent and developed
society is a sedentary life style and faulty dietary habits which result in an imbalance between energy intake and energy expenditure, which, in turn leads to obesity. Overweight and obesity represent a rapidly growing threat to the healthy population in many countries.[6] Obesity is becoming a global
J of Evolution of Med and Dent Sci/ eISSN- 2278-4802, pISSN- 2278-4748/ Vol. 4/ Issue 54/ July 06, 2015 Page 9376 occurred in both children and adults [7]. Body Mass Index (BMI) is a reliable indicator of health and
nutritional status of human beings. The aim of the present study has been to assess the correlation between BMI and BP.
AIMS AND OBJECTIVES: To assess the correlation between BMI and BP in young adults.
MATERIAL AND METHOD: This cross sectional study was done in Mahatma Gandhi Memorial Medical College, and Maharaja Yashwantrao Hospital, Indore. The study population was 184 1st year
medical students, of which 119 were males and 65 were females of 17 to 26 years age group. After obtaining ethical clearance and satisfying the inclusion and exclusion criteria; written consent was taken from every subject. Blood pressures were determined by standard calculation of 184 subjects.
Inclusion Criteria:
M.B.B.S. first year students who gave written consent to participate in the study.
Student free from serious illness.
Healthy, non-smoker and non-alcoholic subjects select for study.
Exclusion Criteria:
Student not ready to give consent.
Systemic disorder including hypertension, diabetes mellitus, any sign and symptoms related to renal or endocrinal diseases and any acute illness during the past 1 month.
Anthropometric Measurements: Anthropometric measurements were also taken. Height (In cm) was measured by a vertical measuring scale was used, body weight (In kg) by portable weighing machine, mid arm circumference (MUAC in cm) were also taken. All anthropometric measurements were taken in light clothing.
Body Mass Index Quetlets’s )ndex : Is defined as the weight in kilograms divided by the square of the height in metres (kg/m2). Body mass index (BMI) is measure of body fat based on height and
weight that applies to both adult men and women. Subjects were classified into four groups based on BMI as follows: Subjects were classified into four groups based on BMI as follows: <18.5 Underweight (22males and 21 females), 18.5-24.9 Normal weight (91males and 39 females), 25-29.9 Overweight
(6males and females and ≥ Obesity female .
Measurement of Blood Pressure: Standardization of instrument. Blood pressure Measurements were taken on right arm with a mercury sphygmomanometer and a standard stethoscope placed at the heart level of the subject who has been rested at least 5 minutes in relaxed and supine position on a couch. Systolic blood pressure (SBP) and diastolic blood pressure (DBP) were recorded to the nearest mmHg as the appearance (phase I) and disappearance (phase V) of Korotkoff’s sound, respectively, since the main target of the study was to examine the relationship between BMI and blood pressure. Blood pressure was recorded Morning at 8 to 9 Am.
J of Evolution of Med and Dent Sci/ eISSN- 2278-4802, pISSN- 2278-4748/ Vol. 4/ Issue 54/ July 06, 2015 Page 9377 STATISTICAL ANALYSIS: A detailed database was prepared using Microsoft Excel Software.
The statistical analysis included calculation of mean, standard deviation; maximum, minimum
value, Pearson’s correlation and p value were performed using the statistical package for social
sciences (SPSS - 22) software.
RESULTS: In view of the possibility that there could be gender differences in regulation of cardiovascular autonomic function, we have analyzed data in males and females separately.[8,9]
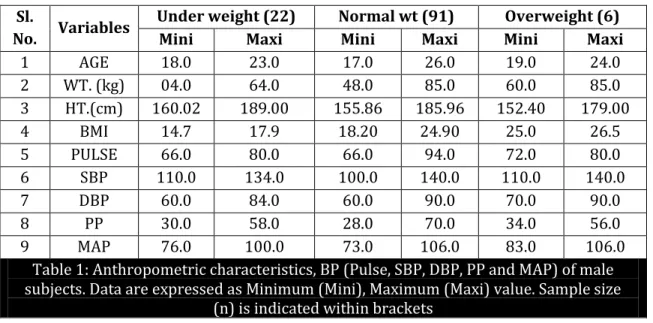
Sl.
No. Variables
Under weight (22) Normal wt (91) Overweight (6)
Mini Maxi Mini Maxi Mini Maxi
1 AGE 18.0 23.0 17.0 26.0 19.0 24.0
2 WT. (kg) 04.0 64.0 48.0 85.0 60.0 85.0
3 HT.(cm) 160.02 189.00 155.86 185.96 152.40 179.00
4 BMI 14.7 17.9 18.20 24.90 25.0 26.5
5 PULSE 66.0 80.0 66.0 94.0 72.0 80.0
6 SBP 110.0 134.0 100.0 140.0 110.0 140.0
7 DBP 60.0 84.0 60.0 90.0 70.0 90.0
8 PP 30.0 58.0 28.0 70.0 34.0 56.0
9 MAP 76.0 100.0 73.0 106.0 83.0 106.0
Table 1: Anthropometric characteristics, BP (Pulse, SBP, DBP, PP and MAP) of male subjects. Data are expressed as Minimum (Mini), Maximum (Maxi) value. Sample size
(n) is indicated within brackets
Sl.
No. Variables
Under weight (21) Normal wt (39) Overweight (4)
Mini Maxi Mini Maxi Mini Maxi
1 AGE 17.0 23.0 18.0 24.0 18.0 19.0
2 WT. (kg) 36.0 53.0 42.0 65.0 65.0 68.0
3 HT.(cm) 142.00 181.00 143.86 167.64 160.0 162.4
4 BMI 12.9 17.9 18.1 24.5 25.0 25.8
5 PULSE 70.0 78.0 70.0 90.0 74.0 78.0
6 SBP 90.0 122.0 90.0 128.0 112.0 128.0
7 DBP 65.0 80.0 60.0 88.0 70.0 82.0
8 PP 20.0 50.0 20.0 50.0 40.0 46.0
9 MAP 75.0 95.0 73.0 101.0 84.0 97.0
Table 2: Anthropometric characteristics, BP (Pulse, SBP, DBP, PP and MAP) of female subjects. Data are expressed as Minimum (Mini), Maximum (Maxi)
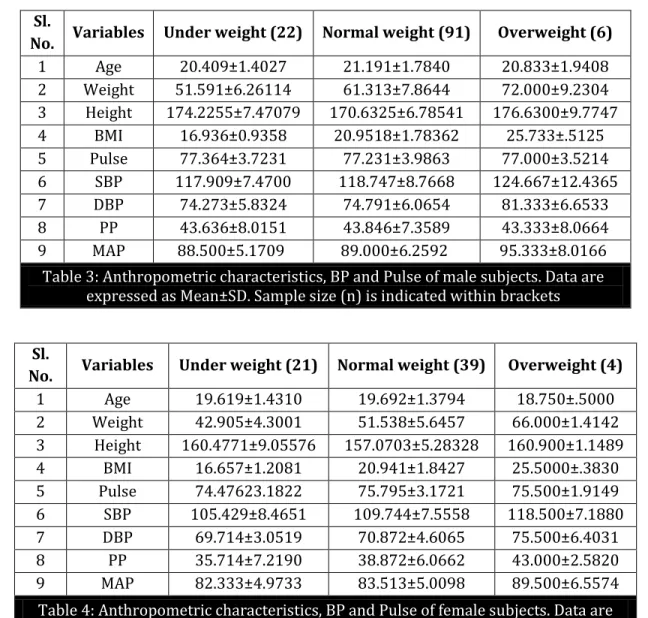
J of Evolution of Med and Dent Sci/ eISSN- 2278-4802, pISSN- 2278-4748/ Vol. 4/ Issue 54/ July 06, 2015 Page 9378 Sl.
No. Variables Under weight (22) Normal weight (91) Overweight (6) 1 Age 20.409±1.4027 21.191±1.7840 20.833±1.9408 2 Weight 51.591±6.26114 61.313±7.8644 72.000±9.2304 3 Height 174.2255±7.47079 170.6325±6.78541 176.6300±9.7747 4 BMI 16.936±0.9358 20.9518±1.78362 25.733±.5125 5 Pulse 77.364±3.7231 77.231±3.9863 77.000±3.5214 6 SBP 117.909±7.4700 118.747±8.7668 124.667±12.4365 7 DBP 74.273±5.8324 74.791±6.0654 81.333±6.6533
8 PP 43.636±8.0151 43.846±7.3589 43.333±8.0664
9 MAP 88.500±5.1709 89.000±6.2592 95.333±8.0166
Table 3: Anthropometric characteristics, BP and Pulse of male subjects. Data are expressed as Mean±SD. Sample size (n) is indicated within brackets
Sl.
No. Variables Under weight (21) Normal weight (39) Overweight (4)
1 Age 19.619±1.4310 19.692±1.3794 18.750±.5000
2 Weight 42.905±4.3001 51.538±5.6457 66.000±1.4142 3 Height 160.4771±9.05576 157.0703±5.28328 160.900±1.1489
4 BMI 16.657±1.2081 20.941±1.8427 25.5000±.3830
5 Pulse 74.47623.1822 75.795±3.1721 75.500±1.9149 6 SBP 105.429±8.4651 109.744±7.5558 118.500±7.1880
7 DBP 69.714±3.0519 70.872±4.6065 75.500±6.4031
8 PP 35.714±7.2190 38.872±6.0662 43.000±2.5820
9 MAP 82.333±4.9733 83.513±5.0098 89.500±6.5574
Table 4: Anthropometric characteristics, BP and Pulse of female subjects. Data are expressed as Mean±SD. Sample size (n) is indicated within brackets
Sl.
No. Variables Male (119) Females (65) 1 Pulse r =-.019 NS (p=.840) r = -.051 NS (p=.685) 2 SBP r =.241** HS (p=.008) r =.316* S (p=.010)
3 DBP r =.258** HS (p=.005) r =.256* S (p=.040)
4 PP r =.082 NS (p=.373) r =.233 NS (p=.062) 5 MAP r =.276** HS (p=.002) r =.254* S (p=.041)
Table 5: Pearson Correlation (r) of body mass index with BP (Pulse, SBP, DBP, PP and MAP) of both male as well female subjects
*. Correlation is significant at the 0.05 level (2-tailed). **. Correlation is significant at the 0.01 level (2-tailed).
J of Evolution of Med and Dent Sci/ eISSN- 2278-4802, pISSN- 2278-4748/ Vol. 4/ Issue 54/ July 06, 2015 Page 9379 Wt = weight, ht = height.
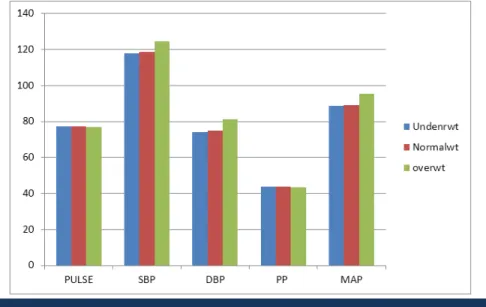
This figure shows that all parameters are higher in male subjects as compared to female subjects.
In present study mean of SBP, DBP and MAP was more in overweight subjects.
In Male Subjects: There was a significant difference in the three groups in terms of BMI. Whereas Mean±SD of SBP, DBP and MAP were lowest in underweight and highest in overweight subjects. Pulse and PP were no differences in the three groups.
Female Subjects: There were significant differences in SBP amongst the three groups. It was highest in overweight subjects and least in underweight subjects; however, differences in the DBP and MAP did similar it was least in underweight subjects and highest in overweight subjects.
Fig. 1: Comparisons of various variables of male and female subjects
J of Evolution of Med and Dent Sci/ eISSN- 2278-4802, pISSN- 2278-4748/ Vol. 4/ Issue 54/ July 06, 2015 Page 9380 Correlations: In male subjects Pearson correlation BMI with various parameters was; for pulse r=-.019 (p=.840), for SBP r=.241** (p=.008), for DBP r=.258** (p=.005), for PP r=.082 (p=.373), and for
MAP. In female subjects, Pearson correlation was for pulse r=-.051 (p=.685), for SBP r=.316* (p=.010),
for DBP r=.256* (p=.040), for PP r=.233 (p=.062), and for MAP r=.254* (p=.041).
There were statistically significant correlation between BMI and all BP indices in all male as well as in female subjects.
DISCUSSION: In both males and in females we found that SBP, DBP and MAP were highest in overweight subjects and least in underweight subjects. This is possibly due to sympathetic tone between underweight and overweight subjects. However, PP similar, assuming that arterial compliance was not different among the groups, this suggests that stoke volume is similar. Pulse rate also similar. It is because of cardiac output was not significant different in the various groups. Differences in BP could be largely due to peripheral resistance which in turn is greatly influenced by tonic sympathetic control of resistance vessels, our results indirectly suggest that the higher BP in overweight subjects is due to heightened sympathetic vascular tone.[10] According to CL Ghai,
overweight individuals tend to have higher blood pressure. Since resistance to blood flow through a blood vessel depends on its length, increased length of blood vessels is bound to increase the resistance and hence blood pressure. (Each extra kg of adipose tissue is associated with the development of an additional 400 km of blood vessels).[11]
Similar finding were reported by various investigators (Sandin et al., 1990 [12]; Roche and
Siervogel, 1991;[13] Chen et al., 1995;[14] Roberto J. Rona et al., 1996;[15] Kaufman et al., 1997;[16]
Venkataramana et al., 2001;[17] Mufunda et al., 2006[18] Singal, P., et al 2008[19] and Zuhul 2008[20] in all
studies they found as association between height, weight, body mass index and blood pressure).
CONCLUSION: In both males and females; Mean±SD of blood pressure were higher in overweight subjects as compared to underweight subjects. There was significant Pearson correlation between BMI and BP (SBP, DBP and MAP) in both male and female subjects. Our results indicate that SBP, DBP and MAP were linearly related to BMI in male as well as in female subjects.
ACKNOWLEDGEMENTS: I am very thankful from the depth of my heart to Dr. (Mrs.) Deepa Raghunath M.D., and Dr. Vandan Varma, for her guidance in data analysis and suggestions.
REFERENCES:
1. Neovius M, Linne Y, and Rossner S. BMI, waist circumference and waist – hip ratio as diagnostic tests for fatness in adolescents. Int J Obes 2004; doi: 10.1038/sj.ijo.0802867, URL: www.nature.com.)
2. Sudip Banik Datta. Age-Sex and Diurnal Variation of Blood Pressure in different nutritional states among the Adult Telegas. Coll. Antropol. 31(2007) 3: 717–22.
http://hrcak.srce.hr/file/42586
3. Ravishankar P, Madanmohan, Kavirajaudupa and E. Sankaranarayanan Prakash
Correlation between body mass index and blood pressure indices, handgrip strength and
handgrip endurance in underweight, normal weight and overweight adolescents . Indian J
J of Evolution of Med and Dent Sci/ eISSN- 2278-4802, pISSN- 2278-4748/ Vol. 4/ Issue 54/ July 06, 2015 Page 9381 4. Rahmouni K, Correia MLG, Haynes WG, Mark AL. obesity associated hypertension. Hypertension
2005; 45: 9-14.
5. Hamideh Shajari, Ahmad Shajari, Mohsen AkhavanSepahi, Amir Houshang Mehrparvar, Reza Roghani, and Mohammad HoseinAtaeeNakhaei. Relationship between Arterial Blood Pressure and Body Mass Index of School Age Children of Southern Region of Iran Acta MedicaIranica, Vol. 49, No. 11 (2011).
6. Kanavi Roopa Shekharappa, SmileeJohncy S, Mallikarjuna P T, Vedavathi K J, Mary PremJayarajan. Correlation between body mass index and ardiovascular parameters in obese and non-obese in different age groups.Int J Biol Med Res. 2011; 2(2): 551-555
7. Mokdad AH, Serdula MK, Dietz WH, Bowman BA, Marks JS, Koplan JP. The spread of the obesity epidemic in the United States, 1991-1998. JAMA. 1999; 282:1519-1522.
8. Bseke SD, alvarez GE, ballard TP, and davy KP, gender difference cardio vagalbaroreflex gain in
humans. JAPPI physiol 2001; 91: 2088-2092.
9. Tank J, Diedrich A, Szezeeh E, Luft FC, and Jordan J. baroreflex regulation of heart rate and
sympathetic vasomotor tone in women and men . Hypertension 2005; 45: 1159-1164.
10.Sorof J Daniels S. obesity hypertension in children. A problem of epidemic proportions. Hypertension 2002; 40: 441-447.
11.CL Ghai. A textbook of practical physiology, 8th edition. New Delhi: Jaypee Brothers Medical
Publishers (p) Ltd; 2013. Page no. 177.
12.Sandin, M., Ugalde, M., Montero, P. and Sanchez, C. Relationship between blood pressure and variable of body composition in 6 to 15 years olds longitudinal study.J. Hum. Ecol. 1990. 1: 37-48.
13.Roche, A.F. and Siervogel, R.M. Measure of body composition: their relationship to blood pressure and use in epidemiologic research. Ann. Epidemiol. 1991. 1: 313-320.
14.Chen, Y., Rennie, D.C. and Reeder, B.A. Age related associations between body mass index and blood pressure. The Humboldt study. Int. J. Obesity 1995. 19: 825-831.
15.Roberto J. Rona, Sameena Qureshi and Susan Chinn. Factors related to total cholesterol and blood pressure in British 9 year olds.Journal of Epidemiology Community Health, 1996;50:512-518.http://www.jstor.org/stable/25568322.
16.Kaufman, J.S., Asuzu, M.C., Mufunda. J., Forrester, T., Wilks, R., Luke, A., Long, A.E. and Cooper, R.S. Relationship between blood pressure and body mass index. Hypertension 1997. 30: 1511-1516.
17.Venkatramana, P., Vam, C. and Chenga Reddy, P. Association of body mass index, body fat distribution and fat patterning with blood pressure in two populations of Andhra. J. Hum. Ecol. 2001; 12: 63-68.
18.Mufunda, J., Mebrahtu, G., Usman, A., Nyarango, P., Kosia, A., Ghebrat, Y. et al. The prevalence of hypertension and its relationship with obesity: results from a national blood pressure survey in Eritsea. J. Hum. Hypertens2006; 20:59-65.
19.Singal, P., Bhatnagar, D.P., Kaur, I., Kaur, V. and Kaur, K. Body Mass Index, Blood Pressure and Haemoglobin in Jat Sikh Children Ranging in Age from 10 to 16 Years.Journal of exercise science and physiotherapy 2008; vol. 4, No.1: 44-49.http://medind.nic.in/jau/t08/i1/jaut08i1p44.pdf. 20.Zuhal Gundogdu. Relationship Between BMI And Blood Pressure In Girls and boys. Public
Health Nutrition (2008), 11(10), 1085-1088.
J of Evolution of Med and Dent Sci/ eISSN- 2278-4802, pISSN- 2278-4748/ Vol. 4/ Issue 54/ July 06, 2015 Page 9382 AUTHORS:
1. Vesti Randa Solanki 2. M. Shiralkar 3. R. Soni
PARTICULARS OF CONTRIBUTORS: 1. Assistant Professor, Department of
Physiology, MGM Medical College, Indore, Madhya Pradesh.
2. Professor & HOD, Department of Physiology, S. S. Medical College, Rewa, Madhya Pradesh.
FINANCIAL OR OTHER
COMPETING INTERESTS: None
3. Professor & HOD, Department of
Physiology, MGM Medical College, Indore, Madhya Pradesh.
NAME ADDRESS EMAIL ID OF THE CORRESPONDING AUTHOR: Dr. Vesti Randa Solanki,
# 44, Radha Krishna Vihar Colony, Piplyahana Indore, Madhya Pradesh. E-mail: [email protected]