*e-mail: [email protected]
Received: 25 February 2014/Accepted: 17 May 2014
Assessment of walker-assisted gait based on Principal Component
Analysis and wireless inertial sensors
Maria Martins*, Arlindo Elias, Carlos Cifuentes, Manuel Alfonso, Anselmo Frizera, Cristina Santos, Ramón Ceres
Abstract Introduction: This study investigates a gait research protocol to assess the impact of a walker model with forearm supports on the kinematic parameters of the lower limb during locomotion. Methods: Thirteen healthy participants without any history of gait dysfunction were enrolled in the experimental procedure. Spatiotemporal and kinematic gait parameters were calculated by using wireless inertial sensors and analyzed with Principal Component Analysis (PCA). The PCA method was selected to achieve dimension reduction and evaluate the main effects in gait performance during walker-assisted gait. Additionally, the interaction among the variables included in each Principal Component (PCs) derived from PCA is exposed to expand the understanding of the main differences between walker-assisted and unassisted gait conditions. Results: The results of the statistical analysis identii ed four PCs that retained 65% of the data variability. These components were associated with spatiotemporal information, knee joint, hip joint and ankle joint motion, respectively. Conclusion: Assisted gait by a walker model with forearm supports was characterized by slower gait, shorter steps, larger double support phase and lower body vertical acceleration when compared with normal, unassisted walking.
Keywords Biomechanics, Principal Component Analysis, Intervention effectiveness, Walker-assisted gait.
Introduction
Walker-assisted gait rehabilitation is a popular treatment method of several disabling clinical conditions. The structure of a walker allows the use of the residual motion capabilities of the users to improve motor strength and locomotion performance. Such devices can be used to provide partial weight bearing during daily functional activities, preventing functional loss and the progression of disability (Youdas et al., 2005).
In conventional walker-assisted rehabilitation, therapists evaluate motor function and patients’ performance based on qualitative information and personal expertise about the movement patterns. Joint displacement and muscle force are also manually
assessed, which makes the i nal clinical decisions
empirical and subjective (Frizera et al., 2012). To make this evaluation more objective and precise, researchers have used 3D motion systems based on infrared cameras, electromyography, goniometers and dynamic force plate measurements to track the human body and perform multidimensional analysis of gait. However, these systems present some major drawbacks, such as marker occlusions during data acquisition, the need of a considerable workspace, expensive processing devices, pre-calibration experiments and dedicated personnel to conduct the procedures. Such devices are limited to laboratory research, are problematic to be used in daily clinical practice and
cannot be used to assess gait patterns in external environments (Karaulova et al., 2002).
Studies of human motion analysis, traditionally performed with photogrammetry techniques, are starting to be conducted with different implementations of Inertial Measurement Units (IMU) (Acht et al., 2007). IMU devices combine different MEMS sensors through data fusion techniques to estimate the body segment orientation. Usually, 3D accelerometers (inclination), 3D gyroscopes (angular velocity), magnetometers (heading angle), and temperature sensors (thermal drift compensation) are used together (Frizera et al., 2013). It has been demonstrated that 3D orientation can be accurately estimated by fusing the information derived from accelerometers and gyroscopes (Luinge et al., 1999). Magnetometers are used to avoid heading drift. However, they are so sensitive to magnetic disturbances (Roetenberg et al., 2005). In addition, IMU sensors can provide accurate 3D movement analysis, but this process does not provide any information concerning relative positions on the human body. This can be solved, in many cases, by using additional knowledge such as human kinematic models (Veltink and De Rossi, 2010).
There is not a great diversity of studies in the literature that provide for a compelling quantitative
can bring to their users. In addition, the majority of
the studies (Alkjaer et al., 2006; Bateni and Maki, 2005; Youdas et al., 2005) focused on standard frames
and rollators with handgrips and used optical motion
capture systems. In the research of Alkjaer et al. (2006),
Bateni and Maki (2005), Youdas et al.(2005) and
Frizera et al.(2012) one identiied some differences
on gait performance with and without these types of walkers: improved balance, improved stability, decrease in speed and step width, and increase of
stance phase time. However, only Alkjaer et al. (2006)
presented a kinematic analysis of the lower limbs, concluding that a rollator with handgrips causes an
increase in hip lexion due to trunk forward lexion
and also a reduction in the range of motion of all lower limbs’ joints.
The present study will evaluate the lower limb gait kinematics with the use of a walker with forearm supports. In addition, the authors expect to obtain
similar results as Alkjaer et al. (2006), with respect
of the joint motion characteristics. The authors’ preliminary hypothesis is that the users will present weight-bearing strategies during walk that will
inluence joint motion. The effects of the changes in
the joints’ motion, bodyweight support and the act of push the walker forward may be converted in a decrease of speed, cadence and increase in stance phase time. Since the forearm supports were designed to help the user maintain an upright posture and improve dynamic stability, reduced excursion of the trunk in all planes are also expected to occur.
Gait analysis yields redundant information that is
often dificult to interpret and it is not always clear
what measurements or which analyses are the most appropriate for a particular clinical purpose (Karg et al.,
2010; Kavanagh, 2009; Olney et al., 1998).
The complex interactions among the biomechanical parameters measured during gait trials have been addressed by multivariate statistical approaches to minimize bias and reduce data dimensionality to improve interpretation. Principal Component Analysis (PCA) is currently one of the most used statistical methods to achieve both of such objectives and produces a summary of the interactions by its Principal
Components (PCs) (Jolliffe, 2002; Karg et al., 2010; Kavanagh, 2009; Olney et al., 1998; Sadler et al., 2011).
The analysis of the PCs constitutes a valuable mean to interpret the most important relationships
in the data. The correlation coeficients between the
PC scores and the original variables measure the importance of each variable in accounting for the variability in the PC. For example, a high loading
value between the irst PC and a variable indicates
that the variable is associated with the direction of
the maximum amount of variation in the data. If a variable does not correlate to any PC, or correlates only with the least important PCs, it may suggest that the variable has small or no contribution to the variability in the data and should be removed to
improve the overall analysis (Olney et al., 1998).
The goal of this paper is to perform a gait analysis experiment to investigate the main differences between kinematic parameters of unassisted (normal) and assisted gait by a walker model with forearm supports. Spatiotemporal parameters and lower limb joint kinematics were acquired using wearable inertial sensors and the PCA technique was applied to determine the main features (PCs) that explained most of the effects of assisted gait and therefore could be used to emphasize a comparison between both methods of locomotion. The correlation patterns among the variables included in the selected PCs were also explored to provide a broad understanding of the
walker inluence over gait kinematics.
Methods
Participants
Thirteen healthy male subjects without any history of gait dysfunction or injuries in the lower limbs volunteered to participate in this study. The summary statistics (mean ± standard deviation) of the subjects
characteristics are: Age (years): 26.84±4.55; Weight (kg): 68.76±10.74; Height (m): 1.76±0.08; Body Mass
Index (kg/m2): 22.05±2.58.
Written informed consent for publication was obtained from all individuals and this study was approved by the Ethics Committee of the Federal University of Espirito Santo, Brazil.
Equipment
Inertial Measurement Unit (IMU) is executed by integrating the output of gyroscopes and accelerometers to compute velocity, position and orientation.
As previously mentioned, a fusion algorithm combines the MEMS sensor information to get the
3D orientation. Kalman ilters have been widely used
to design IMU fusion algorithms (Seong-hoon et al.,
2008). On the other hand, Direction-cosine-matrix
(DCM) algorithm is used for IMU application in model planes and helicopters. The latter algorithm reduces the overhead and improves the portability due to mathematical simplicity (Frizera et al., 2013).
implementation. Additionally, this algorithm does a normalization to the matrix, due to the numerical errors in the integration will gradually violate the orthogonally constraints that the DCM must satisfy. It is necessary to perform adjustments to the elements of the matrix to satisfy the constraints.
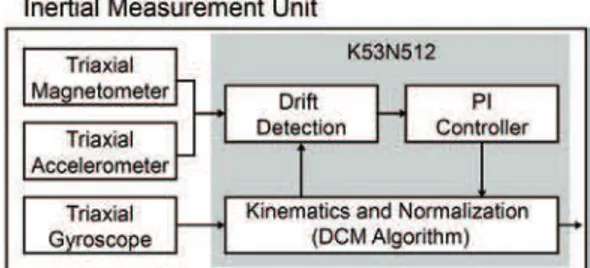
IMU design was developed using the K53N512 microcontroller that is shown in Figure 1. As one can be observed, it is necessary to apply a gyroscope Drift Detection, as the gyroscope offset will gradually accumulate errors in the DCM elements. This feature is realized in three stages: (1) use orientation reference vectors to detect orientation error by computing a rotation vector that will bring the measured and computed values of reference vectors into alignment. These vectors are obtained from the magnetometer, used to detect yaw error, and the accelerometer, used
to detect pitch and roll; (2) feed the rotation error
vector back through a proportional-integral controller
to produce a rotation rate adjustment for the gyros;
(3) subtract the rotation error to the actual gyro signals. The initial orientation is guaranteed at the beginning of the every test by the correct posture and sensor positioning, both performed with the assistance of a therapist. Angular parameters are captured by the gyroscope and, as previously discussed, the IMU algorithm corrects this data by using tridimensional accelerometers and gyroscopes. This approach was evaluated with an optical system in (Cifuentes et al., 2010) showing high repeatability inter and intra subject without the presence of artifacts or signal distortion. However, it is important to mention that this implementation does not consider changes in the
magnetic ield during experiment as the magnetometer
calibration is performed at the beginning of each experiment. This is not a limitation in this work considering the duration of each experiment and the environment in which they were performed.
The sensor sampling is performed at 60 Hz. The
IMU sensor was integrated in a wearable sensor system developed consists on a ZigBee network named ZIMUED composed of one Coordinator (ZC) and several sensor nodes named End Devices (ZED) (Cifuentes et al., 2010). This network was a star
coniguration where ZC receives patient’s signals data
from several ZEDs. The proposed network protocol was based on Time Division Multiplexing (TDM),
where a speciic time was deined for the transmission
of every ZED to the ZC (Cifuentes et al., 2010).
Experimental setup
The participants were instructed to perform a level walking gait trial in two different test conditions: unassisted (normal) and walker-assisted ambulation. In each trial, the subjects kept a self-selected speed
to avoid artiicial motion patterns that could bias the inal results.
The height of the forearm support was adjusted to be the height between the elbow of the user and the ground. This adjustment was necessary for the user to keep an upright posture during walker-assisted trials.
The inertial sensors were placed in the middle of the thigh and calf (10 cm below the patella) segments of the dominant lower limb and sacrum in two different
conigurations (Figure 2), since only 3 inertial sensors
were available.
All subjects were barefoot and asked to perform three repetitions of each test condition along 10 m.
Data processing
Custom Matlab software (Mathworks, Natick, MA, USA) was used for all data processing, calculations and analysis of gait parameters.
The variables selected for statistical analysis were grouped into 2 categories: (1) spatiotemporal and (2) joint kinematics. Considering that the subjects presented no motor dysfunctions, symmetrical gait
pattern was assumed (Winter, 1987). The spatial
orientation can be described by three consecutive
angular rotations, named Euler angles: 1) yaw ψ, rotate the segment about its z axis; 2) pitch θ, rotate
the segment about its y axis; and 3) roll φ, rotate the segment about its x axis (Figure 3).
The parameter deinitions are shown in Table 1.
These variables are commonly reported in gait analysis
(Olney et al., 1998; Sadler et al., 2011; Winter, 1987).
Spatiotemporal parameters were calculated following the work of Watanabe et al. (2011) and kinematic joint angles and accelerations were extracted directly from the inertial sensors. The median values over the three test trials were calculated for each variable per subject, and formed the basis for all subsequent
analyses. This procedure reduced the inluence of
random errors that could affect the measurements.
Principal Component Analysis
In this application, PCA was applied to an n x p
matrix, where n = 26 is the number of participants
normalization (Jolliffe, 2002). Due to the existence of two study groups (assisted and unassisted ambulation)
with 13 users each, this resulted in a 26 × 31 matrix.
Furthermore, a standardized covariance matrix was constructed and used for all subsequent analysis with PCA.
The PCs were constructed successively as follows:
the irst PC (PC1) was the linear combination of
variables for which the variation between subjects
was the greatest (%). The second PC (PC2) worked
in the same fashion, using the variability that was left
after the irst PC had been removed. This process was
repeated for all the other PCs.
The PC score vectors were composed by the coefficients that measured the contribution of
the principal components to each individual. The interpretation of the PCs in this work was accomplished by examining the loading values and the individual gait parameters. The number of selected PCs was
estimated by keeping the irst few PCs that retained
the most variation of data, according to the following
criteria. The irst criterion (Kaiser’s criterion) was to
select PCs with eigenvalues greater than one. The second criterion to determine how many PCs were required to explain the variation in the data was based on the analysis of the scree plot (a graph of the relationship between the relative magnitude of the eigenvalues and the number of components). The PCs along the level part of the scree graph (including the transition point) were discarded and only the PCs along the precipitously dropping part of the graph that
explained 60% to 70% of the variability were retained,
effectively achieving dimensionality reduction of the data (Jolliffe, 2002).
In order to inspect interactions between subjects, variables and components, biplots were used to visualize the magnitude and sign of each variable’s contribution to the PCs.
Analysis of group differences in the PC scores
The PC scores were analysed for determining group differences by using Student’s t-tests and discriminant analysis. Normality assumptions were checked using the Kolmogorov-Smirnov test (Conover, 1971) and
the asymmetry coeficient (Cramér, 1946).
Figure 2. Inertial sensors position a) type 1: A-Thigh; B-Calf; C-Foot; and b) type 2: A-Sacrum; B-Hip; C-Thigh.
A Student’s t-test for paired data was used to identify statistical differences between use and non-use
of walker in the selected PCs. The level of signiicance in all statistical tests was set to 5%.
Results
Basic gait parameters
The mean, standard deviation (SD) and median values of each gait parameter (Table 1) for each condition over all trials are presented in Table 2. A
great effect for speed was identiied for all
spatial-temporal parameters. The cadence, step length and swing duration are lower when the user is assisted by the walker. As a consequence, double support is higher, as well as step time and stance duration. In terms of joint excursions, hip, knee and ankle range of motions decreased as well as the range of motion of sacrum when the user is assisted. In the opposite
way, hip lexion increased. It is also noteworthy that the users present a lower lexion of the sacrum as
well as a lower excursion of the sacrum in all planes.
Principal Components Analysis
The PCA algorithm resulted in 9 PC’s with eigenvalues greater than 1, taking into account the Kaiser’s
criterion. Therefore, the inal number of PCs was
mainly determined by the analysis of the scree plot (Figure 4), which descends more rapidly towards the 5th PC before leveling out. The irst four PCs were
retained for subsequent analysis, and accounted for
65% of the variation of the gait variables. While this
could result in discarding some important information, the objective was to explain the majority of variation in the data. Furthermore, the smaller variance PCs can
be harder to interpret (Deluzio et al., 1999; Jolliffe,
2002). Table 3 presents the variables with the highest loadings for the four retained principal components.
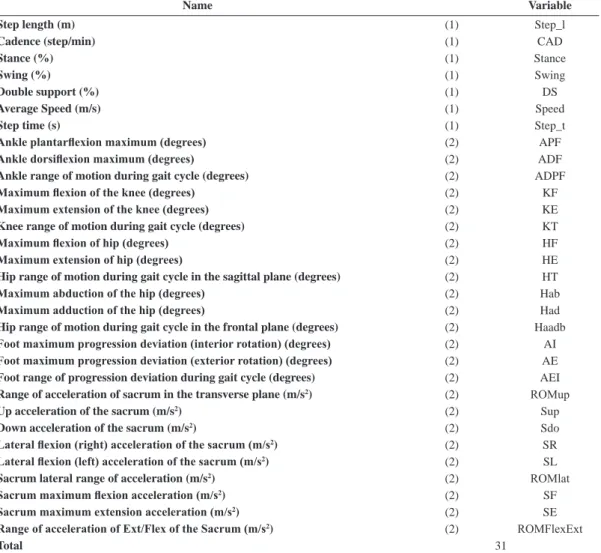
Table 1. Deinition of gait analysis variables.
Name Variable
Step length (m) (1) Step_l
Cadence (step/min) (1) CAD
Stance (%) (1) Stance
Swing (%) (1) Swing
Double support (%) (1) DS
Average Speed (m/s) (1) Speed
Step time (s) (1) Step_t
Ankle plantarlexion maximum (degrees) (2) APF
Ankle dorsilexion maximum (degrees) (2) ADF
Ankle range of motion during gait cycle (degrees) (2) ADPF
Maximum lexion of the knee (degrees) (2) KF
Maximum extension of the knee (degrees) (2) KE
Knee range of motion during gait cycle (degrees) (2) KT
Maximum lexion of hip (degrees) (2) HF
Maximum extension of hip (degrees) (2) HE
Hip range of motion during gait cycle in the sagittal plane (degrees) (2) HT
Maximum abduction of the hip (degrees) (2) Hab
Maximum adduction of the hip (degrees) (2) Had
Hip range of motion during gait cycle in the frontal plane (degrees) (2) Haadb
Foot maximum progression deviation (interior rotation) (degrees) (2) AI
Foot maximum progression deviation (exterior rotation) (degrees) (2) AE
Foot range of progression deviation during gait cycle (degrees) (2) AEI
Range of acceleration of sacrum in the transverse plane (m/s2) (2) ROMup
Up acceleration of the sacrum (m/s2) (2) Sup
Down acceleration of the sacrum (m/s2) (2) Sdo
Lateral lexion (right) acceleration of the sacrum (m/s2) (2) SR
Lateral lexion (left) acceleration of the sacrum (m/s2) (2) SL
Sacrum lateral range of acceleration (m/s2) (2) ROMlat
Sacrum maximum lexion acceleration (m/s2) (2) SF
Sacrum maximum extension acceleration (m/s2) (2) SE
Range of acceleration of Ext/Flex of the Sacrum (m/s2) (2) ROMFlexExt
Table 3 shows that PC1 was positively high
correlated with 8 variables and negatively high
correlated with 3 variables. The included variables suggested that PC1 was related to the spatiotemporal parameters of the users. PC2, PC3 and PC4 were
related to the changes in total excursion of the knee, hip and ankle joint, respectively.
For a better visual inspection of these results, it was built a biplot for the interaction between
PC1/PC2 (Figure 5), PC1/PC3 (Figure 6) and PC1/
PC4 (Figure 7). In the biplots, the odd numbers corresponded to unassisted gait condition subjects and even numbers corresponded to assisted gait condition subjects.
As PC1 was the component with higher variance, incorporating more relevant information, it was plotted PC1 against the other three components to provide expanded information about walker-assisted effects on gait.
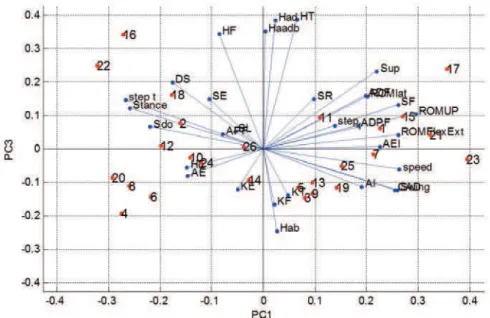
Biplot result of PC1 with PC2
The biplot of Figure 5 shows the high correlated variables related with PC1 and PC2 in comparison with Table 3. ROMup, ROMFlexExt, Speed, CAD, and Swing were positively high correlated with PC1; Stance
Table 2. Variables’ values (Mean±Standard Deviation(Median)).
Variables Non-assisted Walker assisted
step_l (m) 0.66±0.13(0.62) 0.53±0.13(0.55)
CAD (step/min) 132.88±16.32(130.59) 95.60±23.74(86.86)
Stance (%) 61.06±4.22(61.23) 73.23±5.72(72.94)
Swing (%) 38.94±4.22(38.78) 26.77±5.72(27.06)
DS (%) 26.85±4.63(27.78) 36.61±8.36(37.59)
Speed (m/s) 1.37±0.23(1.41) 0.83±0.18(0.83)
step_t (m) 0.92±0.10(0.93) 1.32±0.26(1.38)
HF (º) 31.24±4.62(30.37) 34.53±6.67(35.08)
HE (º) 8.22±4.26(6.56) 11.05±5.54(12.18)
HT (º) 22.60±5.35(21.76) 21.11±7.42(20.39)
KF (º) 40.49±7.63(40.20) 37.72±8.74(34.00)
KE (º) 10.38±3.94(10.32) 11.26±4.87(11.07)
KT (º) 30.34±6.51(28.43) 26.74±6.76(25.37)
ADF (º) 16.76±4.72(17.44) 10.10±4.92(9.76)
APF (º) –19.92±7.33(–20.87) –12.86±7.87(–16.16)
ADPF (º) 36.20±8.04(35.63) 22.50±7.38(19.49)
AE (º) –21.78±7.85(–18.65) –17.10±7.69(–18.19)
AI (º) 9.24±4.39(9.31) 4.28±4.04(4.64)
AEI (º) 31.85±9.82(31.17) 21.36±7.72(20.03)
ROMFlex/Ext (º) 25.84±9.49(25.76) 11.06±3.66(10.24)
ROM lateral (º) 16.98±8.86(13.42) 7.85±6.40(7.39)
SF (º) 11.29±6.72(9.03) –1.33±5.66(0.98)
SE (º) –14.97±3.84(–15.92) –12.87±3.48(–12.14)
SR (º) 14.25±8.82(19.09) 10.27±13.57(16.08)
SL (º) –3.28±9.60(–2.18) 2.33±14.92(7.87)
Hab (º) –3.32±2.31(–2.20) –3.73±2.97(–2.92)
Had (º) 3.82±2.01(2.839 3.57±2.42(3.07)
Haadb (º) 7.15±3.90(4.88) 7.39±4.42(6.22)
Sup (º) 8.62±4.56(8.86) 4.36±2.89(4.29)
Sdo (º) –13.10±3.74(–14.11) –8.37±2.33(–8.22)
ROMUP (º) 22.57±5.98(20.51) 12.52±2.08(11.81)
Table 3. Variables correlating with each of the four PCs.
PC1 Correlation PC2 Correlation PC3 Correlation PC4 Correlation
ROMUP 0.294781 KF 0.375953 HT 0.388293 APF 0.461993
speed 0.263151 KT 0.314162 Had 0.385747 AEI 0.349821
ROM Flex/Ext 0.260647 Haadb 0.256178 Haadb 0.354397 ADPF –0.33875
SF 0.260483 SR –0.2413 HF 0.346192 AE –0.42192
SwingE 0.259065 Hab –0.26071 Hab –0.24603
CAD 0.254311 SE –0.31963
AEI 0.224974
Sup 0.219248
Sdown –0.21966
StanceE –0.25906
step time –0.26787
Figure 5. Biplot relating PC1 with PC2. Non users of the walker correspond to odd numbers and users of the walker correspond to even numbers.
and Step_t were negatively high correlated with PC1; KF and KT were positively high correlated with PC2; SE and Hab were negatively high correlated with PC2.
Observing the case samples, one can notice that
the ones related with unassisted walking were mostly
in the irst and forth quadrants, whereas those case
samples related with the use of the walker were in
the second and third quadrants. Therefore, the irst
and fourth quadrants had variables with positive correlations with PC1, which means that cases located in such regions were faster and presented greater body accelerations, which were related to normal walking. The variables that are located in the second and third quadrants presented slower gait patterns and more stable ones, which were related to the use of walker. PC2 alone was not able to make a clear division between groups.
Biplot results of PC1 with PC3
In Figure 6, one can verify the same high correlated variables for PC1 as in Figure 5, and One can observe
that Had, HT, Haadb and HF were positively high correlated with PC3. In contrast, Hab was negatively high correlated with PC3 (Table 3).
Observing the case samples, PC1 presented the
same data separation as before, whereas PC3 was not able to make a clear division between groups, in a similar fashion than PC2.
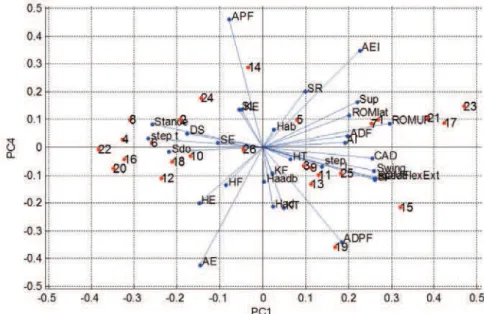
Biplot results of PC1 with PC4
In Figure 7, one can verify the same high correlated variables for PC1 as in Figure 5, and one can observe that APF was positively high correlated, whereas
AE and ADPF were negatively high correlated with PC4 (Table 3).
Analysis of group differences in the PC Scores
The retained PC scores were tested with the Kolmogorov-Smirnov test and the asymmetry
coeficient for normality assessment (Conover, 1971; Cramér, 1946). All groups were validated as
normal data and Student’s T-test was applied to assess differences between groups.
This statistical analysis, together with the PC scores, revealed that the assisted gait provides a lower speed than non-assisted gait (p-value < 0.05). No statistical difference between both conditions in terms of knee, hip and ankle joints movement was observed (p-value > 0.05 for each comparison).
Discussion
Basic gait parameters
Analyzing all gait parameters one can notice that the average gait velocity (Speed), cadence (CAD), and step length (Step_l) are larger when the person is walking without assistance. As a consequence, Swing duration is larger, double support (DS) is shorter, as well as step time duration (Step_t). This happens because
the walker usage has a great inluence on the speed of the user that inluences the overall spatiotemporal parameters (Frizera et al., 2012; Liu et al., 2009; Youdas et al., 2006).
In terms of joint excursions, hip, knee, ankle and hip excursions decrease as well as the range of motion of sacrum when the user is assisted. This decrease is explained by the reduction of weight load over the lower limbs and the extra support that is given by the forearms of the walker. In the opposite way, hip
lexion (HF) increased since the user has to push the
walker to move forward. All these kinematic changes can be related to posture, speed and balance changes that are affected by the use of the walker (Alkjaer et al.,
2006; Bateni and Maki, 2005).
A limitation of this work is the lack of information regarding changes in upper limb’s kinematics that occurs with the use of this type of walker. Previous studies were already done with standard walkers and
rollators (Bachschmidt et al. 2001; Haubert et al. 2006;
Takanokura, 2010), but their main focus was in the kinetics of the upper limbs. Their conclusion was that the walker increased load on the shoulder and elbow and to decrease this effect the walker needs a correct adjustment of its height. Thus, the effects on these joints caused by the forearms are still unknown and further studies are required.
Principal components analysis
The primary purpose of this study was to investigate the effects of walker usage over gait kinematic patterns and if PCA technique could be used to identify the main effects in gait performance during walker-assisted locomotion.
According to the established criteria, the principal components that resulted from PCA were considered for analysis when the eigenvalues were greater than one. Consequently, nine PCs were selected but only four were chosen since these were enough to
explain the majority of variance in the data (65%).
The number of PCs required to account for greater
than 65% of variance was extremely low compared
to the 31 dimensional set of absolute possibilities. The following sections present a detailed analysis for each one of the four PCs previously introduced and attempts to gain further insight into the differences between unassisted and walker-assisted gait.
The PC1 is associated with speed-related variables, which presented positive correlation with cadence (CAD) and swing duration (swing), and negative correlation with stance and step times. Body
acceleration was also inluenced by speed as shown
by the increased motion of the sacrum in sagittal and frontal planes.
The PC2 was related to knee joint movement. In particular, greater knee range of motion is related to
an increase of knee lexion. One can observe that the
users presented different weight-bearing strategies
during walker-assisted gait, augmenting the variability of the knee excursion values. This should be explored in a future study, in order to explore the relationship between different strategies of weight-bearing and knee range of motion.
The PC3 was related to hip joint movement.
One can also observe that different weight-bearing strategies potentially inluenced hip joint kinematics,
especially HT and Haadb.
The PC4 was related to ankle joint movement, since the major variables of this component were variables associated with ankle joint.
The statistical analysis showed that only PC1 was capable to distinguish both conditions. Therefore,
speed-related parameters presented signiicant changes
during walker-assisted ambulation.
Biplot analysis of PC1 against PC2
The biplot presented in Figure 5 shows the correlation between features of PC1 and PC2. This interaction present some high correlated variables such as: (a) Had with KT: this correlation, located in the 1st
quadrant, indicates that when the excursion of the knee increases, hip adduction also increases. (b) AEI with step_l and ROMlexExt: this correlation is located in the 1st quadrant and indicates that during
unassisted gait (user 15), step_l was related with increased ankle excursion in the frontal plane and increased knee motion in the sagittal plane. These
indings suggest that unassisted ambulation was
marked by larger step length, increased knee excursion and increased adduction/abduction of the foot. Such pattern is consistent with larger spatio-temporal
parameters (specially speed) (Jolliffe, 2002); (c) Speed with SF and ROMup: this correlation is located in the 1st quadrant and have a strong correlation with
PC1, which indicates that higher speed is associated with higher vertical body acceleration and sacrum
lexion, which is consistent with Ishikura (2001). This
interaction was more pronounced during unassisted
ambulation (user 17); (d) ROMlat with CAD and Sup: This interaction is located in the 2nd quadrant of the
biplot and suggests an increase in the range of lateral acceleration of the sacrum in response to increased CAD, especially during unassisted gait.; (e) SL and SE: located in the third quadrant, this interaction indicates that walker-assisted gait was marked by extension and left inclination of the sacrum, as a function of lower
values of speed; (f) HT and SR: The unassisted gait presented increased hip range of motion in z-axis and was associated with some degree of right lateral inclination of the sacrum (user 13 and 11).
as: (a) Stance and Swing: this correlation indicated that swing and stance phases are opposite phases,
as expected (6 compared with 1). Stance phase time increases with the use of the walker; (b) DS and CAD: this correlation indicates that greater CAD was associated with reduced time that the feet were on the
loor. This is more accentuated when the person was walking unassisted (1 compared with 4); (c) Step_t and Sup: this correlation indicates that increased step time suggested a slower and more stable pace, which was associated with lower vertical acceleration of the body. This interaction was stronger during
walker-assisted ambulation (4 compared with 1); (d) HE and ADPF: increased extension of the hip joint was associated to a lower excursion of the ankle during walker-assisted gait (14 compared with 25).
Based on the presented interactions, walker-assisted gait was marked by smaller speed and increased stance phase time as compared to unassisted gait. These
results corroborate previous indings by Frizera et al.
(2012), who also reported increased stance phase time and double support phase time during walker-assisted
ambulation. In particular, such indings suggest that
walker-assisted gait is stable.
It is noteworthy that KF and KT, besides being the variables with greater PC2, are not related with
any speciic case sample and were not correlated to any spatiotemporal parameters, speciically step_t and CAD.
Biplot analysis of PC1 against PC3
The biplot presented in Figure 6 shows the correlation
between features of PC1 and PC3. The main interactions between variables of this plot are: (a) SF with step_l: this correlation is located in the 1st quadrant and shows that when the step is bigger, the
person inclines his trunk forward, (user 1); (b) APF
with step_t: this correlation is located in the 2nd quadrant and indicates that step_t is associated with
the plantar-lexion angle of the ankle joint. These
variables were greater with the use of the walker
(user 2); (c) ADPF with ROMUp: this correlation is
located in the 1st quadrant and explains the fact that the vertical acceleration of the body was associated with ADPF, and both variables increased during
unassisted ambulation (user 15); (d) KF with Hab: this
correlation is located in the 4th quadrant and shows the
interaction between knee lexion and hip abduction,
which presented greater values during unassisted
gait (user 5); (e) CAD with Swing: this correlation is located in the 4th quadrant and conirms that speed
and CAD are strongly positive correlated (user 25).
Figure 6 also reveals some negative correlations
between variables, located in opposite quadrants, such
as: (a) step_t with Swing and CAD: this correlation explains that a bigger step time associated with walker use is opposite to the increase of the swing phase (swing) and CAD, suggesting slower gait speed (2
compared with 25); (b) AE with Step_l and SF: this correlation shows that the decrease of AE (in module) is associated with the increase of SF and step length, meaning that an increase of speed makes the foot progression (exterior) to increase (1 compared with
24); (c) HE with ADPF: this correlation indicates that hip extension, related to walker usage, decreases the
vertical excursion of the ankle (24 compared with 1);
(d) HF with KT: this correlation indicates that the
increase of the hip lexion is related to the decrease
of the knee excursion. However, since the user sample has individuals with different heights and the walker
was not perfectly adjusted to them, the hip lexion
parameter was not capable of differentiating between the two groups of study.
The location of HF in the 2nd quadrant corroborates
our preliminary hypothesis that walking with a device with forearm supports can lead to increased hip
lexion due to anterior lexion of the trunk further
corroborating the work of Ishikura (2001).
Biplot analysis of PC1 against PC4
The biplot presented in Figure 7 shows the positively high correlated variables in this interaction: (a) SE with Step_t: this correlation is located in 2nd quadrant
and was related to the association between extension of the sacrum and step time. The increase of these parameters was associated with walker-assisted cases
(user 6); (b) Speed with ROMFlexExt and Step_l: this is located in the 4th quadrant and relates the speed
with ROMFlexExt and Step_l. These components
were greater unassisted gait (user 25); (c) KT with KF: this correlation is located in the 4th quadrant and
relates KF with KT. This was expected since KF is the maximum of the range of motion KT. The increase
of these variables is not related to a speciic group. Some negative correlations were also identiied:
(a) APF with KT and KF: this correlation suggested that the increase (in absolute value) of the plantar
lexion of the ankle was associated with the increase of the knee lexion and its excursion as well; (b) HE with AEI: this correlation showed that extension of the hip reduced ankle motion in the sagittal plane.
Main contributions
In conclusion, it has been identiied four PC’s that retained 65% data variability. These components
that only the irst PC was able to detect differences
between the two study groups. Based on such analysis, walker-assisted gait was characterized by slower gait, short steps, higher double support phase and reduced body vertical acceleration. These conclusions are in accordance with previous studies. Additionally, several correlations patterns among the variables included in each PC were presented and discussed.
The knowledge of gait parameters and biomechanical properties of walker-assisted ambulation (with forearm supports) may contribute to future studies regarding the development of novel robotic walker
models and the design of speciic rehabilitation or
functional compensation strategies that incorporate such devices. Improved adaptation of patient’s individual needs and treatment progression by the
clinician are major beneits that can be achieved with
the enhancement of this technology.
Acknowledgements
This work has been supported by FCT – Fundação para a Ciência e Tecnologia in the scope of the
project: PEst-OE/EEI/UI0319/2014, the Portuguese Science Foundation (grant SFRH/BD/76097/2011) and the Brazilian National Council for Scientiic
and Technological Development (CNPq) (Process
# 471804/2012-6).
References
Alkjaer T, Larsen P, Pedersen G, Nielsen L, Simonsen E. Biomechanical analysis of rollator walking. Biomedical Engineering Online. 2006; 5(2). PMid:16398933 PMCid:PMC1334195. http://dx.doi.org/10.1186/1475-925X-5-2
Acht V, Bongers E, Lambert N, Verberne R. Miniature wireless inertial sensor for measuring human motions. In: Proceedings of the 29th Annual International Conference of the IEEE Engineering in Medicine and Biology Society; 2007. p. 6278-81.
Bachschmidt R, Harris G, Simoneau G. Walker-assisted gait in rehabilitation: a study of biomechanics and instrumentation. IEEE Transactions Neural Systems Rehabilation Engineering. 2001; 9(1):96-105. PMid:11482369. http:// dx.doi.org/10.1109/7333.918282
Bateni H, Maki BE. Assistive devices for balance and mobility: beneits, demands and adverse consequences. Archives Physical Medical Rehabilitation; 2005; 86(1):134-45. http://dx.doi.org/10.1016/j.apmr.2004.04.023 Cifuentes CA, Gentiletti GG, Suarez MJ, Rodriguez LE. Development of a Zigbee platform for bioinstrumentation. In: Proceedings of the 2010 Annual International Conference of the IEEE Engineering in Medicine and Biology Society; 2010. p. 390-3. PMid:21096976. http://dx.doi.org/10.1109/ IEMBS.2010.5627607
Conover WJ. Practical nonparametric statistics. New York: John Wiley & Sons; 1971. p. 295-301.
Cramér H. Mathematical methods of statistics. Princeton: Princeton University Press; 1946.
Deluzio KJ, Wyss UP, Costigan P, Sorbie C, Zee B. Gait assessment in unicompartmental knee arthroplasty patients: principal component modelling of gait waveforms and clinical status. Human Movement Science. 1999; 18(5):701-11. http://dx.doi.org/10.1016/S0167-9457(99)00030-5 Frizera A, Elias A, Ama J, Ceres R, Bastos T. Characterization of spatio-temporal parameters of human gait assisted by a robotic walker. In: The Forth IEEE RAS/EMBS International Conference on Biomedical Robotics and Biomechatronics; 2012 June 24-17. p. 1087-91.
Frizera A, Cifuentes C, Bastos T. Motion capture system based on the integration of 3D accelerometer in a wireless Inertial Measurement Unit. In: André PSB, Varum H, editors. Accelerometers: principles, structure and applications. 1th ed. Hauppauge: Nova Science Publishers; 2013. v. 1. p. 57-77. Haubert L, Gutierrez D, Newsam C, Gronley J, Mulroy S, Perry J. A comparison of shoulder joint forces during ambulation with crutches versus a walker in persons with incomplete spinal cord injury. Archives of Physical Medicine and Rehabilitation. 2006; 87(1):63-70. PMid:16401440. http://dx.doi.org/10.1016/j.apmr.2005.07.311
Ishikura, T. Biomechanical analysis of weight bearing force and muscle activation levels in the lower extremities during gait with a walker. Acta Medica Okayama. 2001; 55(2):73-82. PMid:11332202.
Jolliffe, I. Principal component analysis. 2nd ed. New York: Springer; 2002.
Karaulova I, Hall P, Marshall A. Tracking people in three dimensions using a hierarchical model. Image and Computing. 2002; 20(9-10):691-700. http://dx.doi. org/10.1016/S0262-8856(02)00059-8
Karg M, Kuhnlenz K, Buss M. Recognition of affect based on gait patterns. IEEE Transactions on Systems, Man, and Cybernetics. Part B: Cybernetics. 2010; 40(4):1050-61. PMid:20350859. http://dx.doi.org/10.1109/ TSMCB.2010.2044040
Kavanagh J. Lower trunk motion and speed-dependence during walking. Journal of NeuroEnginering and Rehabilitation. 2009; 6:9. PMid:19356256 PMCid:PMC2674051. http://dx.doi.org/10.1186/1743-0003-6-9
Liu HH, McGee M, Wang W, Persson M. Comparison of gait characteristics between older rolling walker users and older potential walker users. Archives of Gerontology and Geriatrics. 2009b; 48(3):276-80. PMid:18359111. http:// dx.doi.org/10.1016/j.archger.2008.02.004
Luinge HJ, Veltink PH, Baten CT. Estimating orientation with gyroscopes and accelerometers. Technology Health Care. 1999; 7(6):455-9. PMid:10665681.
Roetenberg D, Luinge HJ, Baten CT, Veltink PH. Compensation of magnetic disturbances improves inertial and magnetic sensing of human body segment orientation. IEEE Transactions Neural Systems Rehabilation Engineering. 2005; 13(3):395-405. PMid:16200762. http:// dx.doi.org/10.1109/TNSRE.2005.847353
Sadler E, Graha R, Stevenson J. The personal lift-assist device and lifting technique: a principal component analysis. Ergonomics. 2011; 54(4):392-402. PMid:21491281. http:// dx.doi.org/10.1080/00140139.2011.556259
Seong-hoon W, Melek W, Golnaraghi F. Position and orientation estimation using Kalman iltering and particle iltering with one IMU and one position sensor. In: 34th Annual Conference of IEEE Industrial Electronics IECON; 2008. Orlando, USA. p. 3006-10.
Takanokura M. Optimal handgrip height of four-wheeled walker on various road conditions to reduce muscular load for elderly users with steady walking. Journal of Biomechanics. 2010; 43(5):843-8. PMid:20006337. http:// dx.doi.org/10.1016/j.jbiomech.2009.11.020
Watanabe T, Saito H, Koike E, Nitta K. A preliminary test of measurement of joint angles and stride length with wireless inertial sensors for wearable gait evaluation system. Computational Intelligence and Neuroscience. 2011; 2011:1-12. PMid:21941531 PMCid:PMC3175383. http://dx.doi. org/10.1155/2011/975193
Veltink PH, De Rossi D. Wearable technology for biomechanics: e-textile or micromechanical sensors. IEEE Engineering in Medicine and Biology Magazine. 2010; 29(3):37-43. PMid:20659856. http:// dx.doi.org/10.1109/MEMB.2010.936555
Winter D. The biomechanics and motor control of human gait: normal, elderly and pathological. 2nd ed. Waterloo: University of Waterloo Press; 1987.
Youdas J, Kotajarvi B, Padgett D, Kaufman K. Partial weight-bearing gait using conventional assistive devices. Archives Physical Medicine Rehabilitation. 2005; 86(3):394-8. PMid:15759217. http://dx.doi.org/10.1016/j. apmr.2004.03.026
Authors
Maria Martins*, Cristina Santos
Industrial Electronics Department, University of Minho (UMinho), Campus Azurém, 4800-058, Guimarães, Portugal.
Arlindo Elias
Biotechnology Department, Federal University of Espirito Santo (RENORBIO - UFES), Vitoria, ES, Brazil.
Carlos Cifuentes, Manuel Alfonso, Anselmo Frizera
Electrical Engineering Department, Federal University of Espirito Santo (UFES), Vitoria, ES, Brazil.
Ramón Ceres