*e-mail: [email protected]
Modeling of Asphalt-rubber Rotational Viscosity by
Statistical Analysis and Neural Networks
Luciano Pivoto Spechta*, Oleg Khatchatouriana, Lélio Antônio Teixeira Britob,
Jorge Augusto Pereira Cerattib
a
Universidade Regional do Noroeste do Estado do Rio Grande do Sul – UNIJUÍ
Campus Universitário, Rua do Comércio 3000, Ijuí - RS, Brazil
b
Universidade Federal do Rio Grande do Sul – UFRGS
Escola de Engenharia, Rua Osvaldo Aranha 99, 3º andar, Porto Alegre - RS, Brazil
Received: July 12, 2006; Revised: December 8, 2006
It is of a great importance to know binders’ viscosity in order to perform handling, mixing, application processes and asphalt mixes compaction in highway surfacing. This paper presents the results of viscosity measurement in asphalt-rubber binders prepared in laboratory. The binders were prepared varying the rubber content, rubber particle size, duration and temperature of mixture, all following a statistical design plan. The statistical analysis and artificial neural networks were used to create mathematical models for prediction of the binders viscosity. The comparison between experimental data and simulated results with the generated models showed best performance of the neural networks analysis in contrast to the statistic models. The results indicated that the rubber content and duration of mixture have major influence on the observed viscosity for the considered interval of parameters variation.
Keywords: asphalt-rubber, viscosity, modeling, artificial neural network
1. Introduction
Petroleum asphalt cements are complex materials due to their chemical formulation and physical properties. For their use, these binders need either to be heated, emulsified or dissolved1-3. The
as-phalt develops viscous behavior when loaded over a long period of time or under high temperatures (> 50 °C) and behaves as an elastic material in a reverse situation. In pavement applications, the asphalt, and consequently all materials with its addition, displays both viscous fluid behavior and elastic solid behavior, when loaded by traffic. This behavior provokes the main pavement distress causes (rutting and fatigue cracking). Rheology studies the material properties of fluid and semi-solid materials and determines the relation between force, defor-mation and time variables. The viscosity is one of the most important rheological characteristics of a fluid which indicates resistance to flow. The known dependence of viscosity to temperature, shear rate and other parameters can be used to predict behaviour of asphalt in various condi-tions, in particular at low temperature4,5. So far, experimental research
is the most reliable method to obtain these dependences.
Superpave (Superior Performing Asphalt Pavements) binder specification, which is a widespread methodology in the world, rec-ommends Brookfield Viscometer to assess rheological properties at high temperatures. The relation between viscosity and temperature is essencial to define temperature ranges to pumping, mixing, and compaction of asphalt mixes6,7.
The high cost of the petroleum and, therefore of the asphalt cements, has motivated engineers and researchers to search for new materials with the ability of combining durability to good performance at low costs. As an example, modified asphalt binders can use polymers as SBS (Styrene-butadiene-styrene), SBR (Styrene-butadiene-rubber) and EVA (Ethylene-vinyl-acetate) in order to enhance some properties8-13. Another
used technique since the sixties is the asphalt modification by tire rubber inclusion. There are several techniques to accomplish this modification, namely, wet, dry and mixed processes. The wet process is used to obtain the well known asphalt rubber. In this process 15-25% of tire rubber (in
relation to binder weight) reacts with asphalt under high temperature (170-200 °C) for a specific period of time to produce a material suitable for use as binder in almost all paving applications14-20.
Over 45 millions waste tires are discarded in Brazil annually and there is a strong interest in developing alternative uses for them, especially due to economical and environmental appeal. The Brazilian road network relies only on 10% of sealed roads, on which approxi-mately 63% of all journeys occur. Improvements in the engineering of road materials, as asphalt binders, represent an important impact on pavement performance and consequently on maintenance costs.
Several factors influence the interaction between asphalt and rub-ber and, as such, on the mixes behavior. Unfortunately, for the problem in analysis the final result cannot be calculated through superposition of the effects from each individual parameter. Likewise, it is very ex-pensive to obtain experimentally the sufficient number of relationships connections between independent & and response variables. In spite of progress in theoretical studies, up until now, no general theory is able to predict a total influence of involved phenomena and parameters on asphalt mixes properties. Previous researches make use21 of numerical
methods as statistical and artificial neural networks, to study interaction among asphalt, crumb rubber and shale oil residue.
The interaction between rubber particle and asphalt binder is not a natural chemical reaction, but instead, it is a diffusion of light aromatic components of the binder into the crumb rubber5,22,23. The
final product behavior depends on the properties of the binder, of the rubber and of the mixing variables such as a temperature, duration and mixing process type20,24,25.
temperature of mixture in a wide range of parameters variation useful for practical application, as well as to develop mathematical model based on statistical analysis and neural network techniques.
2. Materials and Methods
2.1. Experimental plan and sample preparation
The experimental plan includes preparation of rubber-modified asphalt samples for measurement of the apparent viscosity and sub-sequent development of mathematical model with use of statistical analysis and neural networks techniques. Table 1 shows the independ-ent variables and their levels.
Table 2 presents a complete factorial matrix and the included design matrix (dark cells) obtained by the optimization methods of statistical techniques of experiments design26,27. This optimization,
fulfilled by an iterative process to minimize dimension of the design matrix with analysis of significance of representative data for each step, reduces significantly the time and the cost of the experimental project. The viscosity measurements were accomplished for all variables combinations determined by the design matrix for each of 4 levels of Read Temperature – RT (135, 155, 175 and 195 °C).
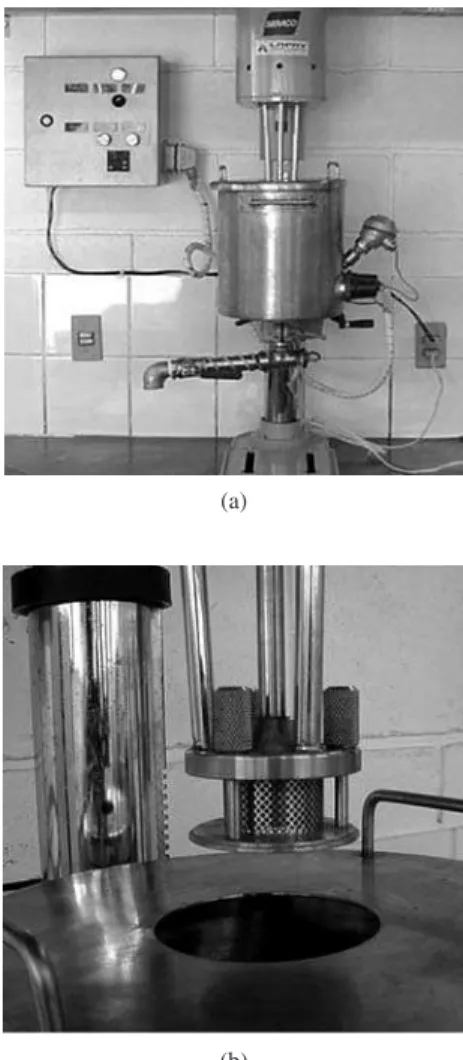
Figure 1 illustrates the equipment used in sample preparation. Binder samples were prepared on a high shear mixer (4000 RPM); the
Table 1. Independent variable and levels.
Independent Variables Levels
Rubber Content (RC)1 6,12,18%
Rubber Particle Size (RS)2 #50, #30 e >#30
Mixing Temperature (MP) 160, 180 e 200 °C Mixing Duration (MD) 30, 45 e 60 minutes
Note: 1Rubber content was calculated in relation to total mass; 2Rubber Particle
Size was analyzed as specific surface (SS).
(a)
(b)
Figure 1. Device used in sample preparation.
RT - 195 °C RC - 6% RC - 12% RC - 18%
RS - #50 RS - #30 RS - > #30 RS - #50 RS - #30 RS -> #30 RS - #50 RS - #30 RS - > #30
MP - 160 °C MT - 30 m 1 10 19 28 37 46 55 64 73
MT - 45 m 2 11 20 29 38 47 56 65 74
MT - 60 m 3 12 21 30 39 48 57 66 75
MP - 180 °C MT - 30 m 4 13 22 31 40 49 58 67 76
MT - 45 m 5 14 23 32 41 50 59 68 77
MT - 60 m 6 15 24 33 42 51 60 69 78
MP - 200 °C MT - 30 m 7 16 25 34 43 52 61 70 79
MT - 45 m 8 17 26 35 44 53 62 71 80
MT - 60 m 9 18 27 36 45 54 63 72 81
RT - 175 °C RC - 6% RC - 12% RC - 18%
RS - #50 RS - #30 RS - > #30 RS - #50 RS - #30 RS -> #30 RS - #50 RS - #30 RS - > #30
MP - 160 °C MT - 30 m 1 10 19 28 37 46 55 64 73
MT - 45 m 2 11 20 29 38 47 56 65 74
MT - 60 m 3 12 21 30 39 48 57 66 75
MP - 180 °C MT - 30 m 4 13 22 31 40 49 58 67 76
MT - 45 m 5 14 23 32 41 50 59 68 77
MT - 60 m 6 15 24 33 42 51 60 69 78
MP - 200 °C MT - 30 m 7 16 25 34 43 52 61 70 79
MT - 45 m 8 17 26 35 44 53 62 71 80
MT - 60 m 9 18 27 36 45 54 63 72 81
RT - 155 °C RC - 6% RC - 12% RC - 18%
RS - #50 RS - #30 RS - > #30 RS - #50 RS - #30 RS -> #30 RS - #50 RS - #30 RS - > #30
MP - 160 °C MT - 30 m 1 10 19 28 37 46 55 64 73
MT - 45 m 2 11 20 29 38 47 56 65 74
MT - 60 m 3 12 21 30 39 48 57 66 75
MP - 180 °C MT - 30 m 4 13 22 31 40 49 58 67 76
MT - 45 m 5 14 23 32 41 50 59 68 77
MT - 60 m 6 15 24 33 42 51 60 69 78
MP - 200 °C MT - 30 m 7 16 25 34 43 52 61 70 79
MT - 45 m 8 17 26 35 44 53 62 71 80
MT - 60 m 9 18 27 36 45 54 63 72 81
RT - 135 °C RC - 6% RC - 12% RC - 18%
RS - #50 RS - #30 RS - > #30 RS - #50 RS - #30 RS -> #30 RS - #50 RS - #30 RS - > #30
MP - 160 °C MT - 30 m 1 10 19 28 37 46 55 64 73
MT - 45 m 2 11 20 29 38 47 56 65 74
MT - 60 m 3 12 21 30 39 48 57 66 75
MP - 180 °C MT - 30 m 4 13 22 31 40 49 58 67 76
MT - 45 m 5 14 23 32 41 50 59 68 77
MT - 60 m 6 15 24 33 42 51 60 69 78
MP - 200 °C MT - 30 m 7 16 25 34 43 52 61 70 79
MT - 45 m 8 17 26 35 44 53 62 71 80
MT - 60 m 9 18 27 36 45 54 63 72 81
Note: The dark cells present done mixes; the numbers (1… 81) represent the mix code.
Table 3. Properties of rubber.
Rubber Effective Diameter (mm)
Specific Gravity (kN/m3)
Bulk Specific Gravity (kN/m3)
Carbom Black (%)
Specific Surface (m2/kN)
#50 0.18 11.34 3.30 35.62 141300.9
#30 0.18 11.46 4.10 32.26 131655.6
> #30 0.50 11.47 4.40 32.21 78808.3
Note: Effective Diameter represent the size of 10% of passing particles on size distribution.
(a)
(b)
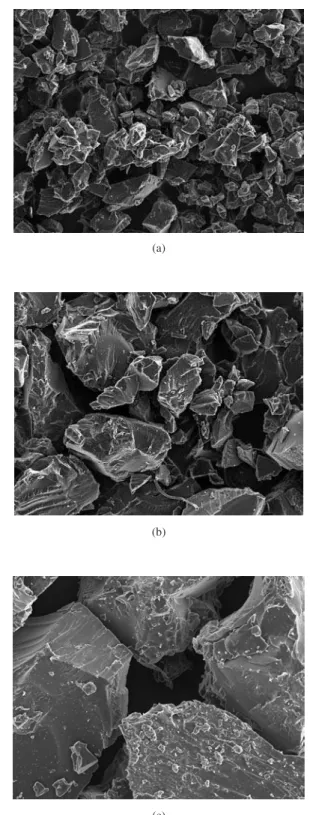
(c)
Figure 2. Electronic microscopy scanner pictures of rubber grains (magnifica-tion 100x). a) #50; b) #30; and c) > #30.
temperature was reached using a vessel with thermal oil and two electric resistances (2000W each) – all process was controlled automatically.
2.2. Materials
The crumb rubber of tire bands, used in this study to prepare the mixes, was categorized into three different classes according to its particle size, namely, #50, #30 and > #30. Rubbers properties are presented on Table 3. Figure 2 presents EMS (Electronic Microscopy Scanner) pictures. The detailed tests description is detailed in work of Specht20.
In all tests, Petroleum Asphalt Cement from Alberto Pascoalini Refinery of trade mark AC 20 was used, which corresponds to a PG 64-22, according to the Superpave specification28. Table 4 shows
the basic asphalt properties.
2.3. Test methods
Viscosity measurements were performed in rotational viscometer (Brookfield Viscometer DV-II+), changing the shear rate (5, 20, 50 and 100 RPM) and the temperature (135, 155, 175 and 195 °C). Four readings of viscosity were made to each combination (shear rate and temperature) totalizing 1792 measurements. The spindle 27 was used, in agreement to the Asphalt Institute (2000)7 recommendation
for modified binders, instead of spindle 21 as specified by Asphalt Institute (1994)6 for conventional binders.
3. Results and Discussion
Figure 3 presents a correlation between shear rate and viscosity (η). For each rotating speed of spindle that corresponds to a definite shear rate, the viscosity value was calculated using average values of all 448 measurements. As the results indicate, there is a non-lin-ear trend that demonstrates the non-Newtonian and pseudoplastic behavior of the asphalt rubber binders.
The multiple regression analysis and analysis of variance (ANO-VA) were used for processing the experimental data. It is usual to adjust functions to collected data in order to quantify how strong is the influence of the independent variables, its interactions and quadratic effects on the response variables (in this study, the rotational viscos-ity - η). To perform a statistical analysis is common practice to use codified values to the different independent variables (-1 to 1, where -1 assumes the lowest value possible, whereas +1 assumes the highest; the intermediate values are linearly distributed), allowing, therefore, direct comparisons among the coefficients – provided that with such codification all different variables get on the same scale. The software Statistica for Windows (4.3B) was used. The experimental data was quantitatively analyzed through models of multiple regressions, for the correlation of each response variable y with n levels26,29. Multiple
regression analysis equation has the following format:
y = a0 + a1 . x1 + a2 . x2 + a11 . x12 + a
12 . x1 . x2 +...+ (1)
an . xn +... + ann . x2
n +...+ an1n2 . xn1 . xn2
valid only inside the tested range. To verify how well the models represent the experimental data it is useful to verify the determina-tion coefficient (R2) and the standard error (ε
p). In this research the
level of significance used in the ANOVA analyses was 0.05, that represent a probability of 5% of the hypothesis represented by the model not to be true.
The statistic models were generated for all temperature tests (Equations 2 to 5). These models must be used with codified values [-1, 0, 1], and shall only be applied in regard to this research scope. The experimental data for 20 RPM (shear rate = 6.8/s) was only used to perform the modeling.
η @135 (Pa.s) = 0.72 + 1.80.RC + 1.07.RC.RC + 0.83.RC.TP + 0.72RC.MP + 0.58.MD – 0.57.SS
(R2 = 0.89 and ε
p = 1.01) (2)
η@155 (Pa.s) = 0.15 + 0.96.RC + 0.57.RC.RC + 0.42.RC.MD + 0.36.RC.MP + 0.28.MD + 0.38. MP.MT
(R2 = 0.90 and ε
p = 0.50) (3)
η@175 (Pa.s) = – 0.0014 + 0.74.RC + 0.42 RC.RC + 0.27.MP.MD
(R2 = 0.89 and ε
p = 0.27) (4)
η@195 (Pa.s) = – 0.40 + 0.80RC + 0.40 RC.RC + 0.30. MP.MD
(R2 = 0.86 and ε
p = 0.44) (5)
where: η = rotational viscosity, RC = Rubber Content, MD = Mixing Duration, MP = Mixing Temperature and SS = Rubber Specific Surface.
As the results indicate, there is strong influence of the RC in the mixes viscosity, which is present in all models as the main factor, represented by larger numeric coefficient. The quadratic effect of RC is significant too. The variable RC also appears in interactions with other variables such as MD and MP.
Models 2 and 3 indicate that growing mixing duration, increases viscosity. The interaction MP.MD appears in three models, increasing the viscosity value. It is fully explainable, on the physical point of view, because the increase of temperature and mixing duration ampli-fies the interaction of the binder with the rubber particles.
Rubber Specific Surface (SS), which represents indirectly the size of rubber, appears only on model 2 and with low influence on the measured viscosity.
The Equations 2-5 were obtained for different read temper-atures (RT). With inclusion of read temperature as a variable on the model, it is possible to obtain Equation 6, which interconnects all independent variables. In this model RC continues as the main factor, showing the greatest influence on the viscosity. The reading temperature RT is located directly after RC. Figure 4 displays the viscosity variation as function of RC and RT for MT = 45 minutes, MP = 180 °C and SS = 133656 m2/kN where it is possible to perform
a sensibility analysis about the influences of RC and RT on η. Notice that some area of the modeling surface, (light area) is located below zero, what contradicts physical sense, because the viscosity can not assume negative values. This inconsistency do not allowed use of this model with some values combinations.
η (Pa.s) = 0.23 + 1.07.RC – 0.67RT + 0.64.RC.RC + 0.42.RC.MT + 0.31.RC.MP + 0.29.MT – 0.27.SS – 0.27.SS.MP – 0.24.RC.SS – 0.21.MP
(R2 = 0.76; ε
p= 0.79 Pa.s) (6)
where: η = rotational viscosity, RT = Read Temperature, RC = Rubber Content, MT = Mixing Time, MP = Mixing Temperature and SS = Rubber Specific Surface.
0.100 1,000 10,000
0 10 20 30 40
Shear rate (1/s)
V
iscosity (P
a.s)
5 RPM 20 RPM 50 RPM 100 RPM
Figure 3. Experimental relation between shear rate and viscosity:
Non-New-tonian behavior of asphalt rubber.
140 150
160 170
180 190
6 8 10 12 14 16
18 - 3
- 2 - 1 0 1 2 3
MT = 45 minutes; MP = 180 °C; SS = 133656 m2/kN
Rubber content (%)
V
iscosity (P
a.s)
Read temperature (°C)
Figure 4. Surface ηx RC x RT to statistical approach.
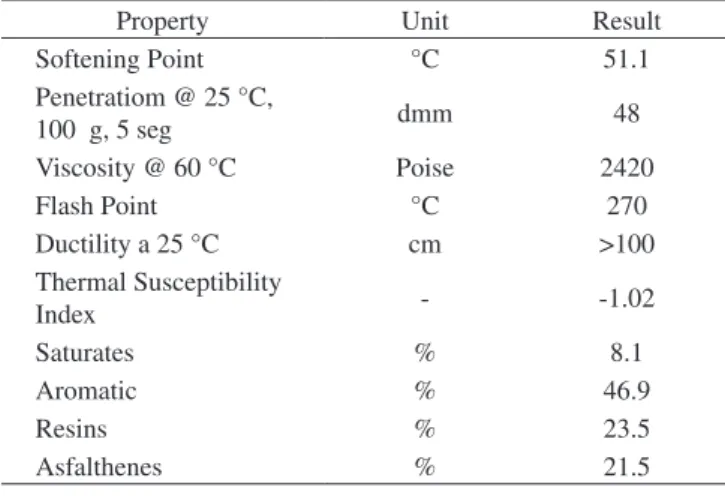
Table 4. Properties of asphalt cement base.
Property Unit Result
Softening Point °C 51.1
Penetratiom @ 25 °C,
100 g, 5 seg dmm 48
Viscosity @ 60 °C Poise 2420
Flash Point °C 270
Ductility a 25 °C cm >100 Thermal Susceptibility
Index - -1.02
Saturates % 8.1
Aromatic % 46.9
Resins % 23.5
The other technique to simulate the mixes viscosity used was Artificial Neural Networks – ANN30,31. The architecture of Artificial
Neural Network selected in this work (Figure 5) for the viscosity simulation is the multilayer feed-forward net trained by back propaga-tion with two layers of hidden units. The output units and the hidden units have biases. The output layer has 1 neuron. All the analyses were performed with use of the MatLab software.
Initially the Neural Network was trained only by the experimental data (448 input vectors and target values). The obtained square mean deviation between the experimental data and results obtained by the Neural Network was very small, indicating that the Neural Network describes the experimental data with great precision. Even though, it was not efficient to use this same net to simulate the viscosity in other points, because for any deviation from experimental points in the input parameters, the simulated viscosity differs greatly from real meaning. The variation of a number of neurons and hidden layers has not improved simulation results as well. Thus, the direct application of ANN with input vectors formed by rules of statistical experiment planning is not satisfactory, because the function, which describes experimental data, is not determined in a method ANN on beforehand, as opposed to a statistical method.
Therefore, in this work, to obtain ANN, which well describes the experimental data for the total interval of variation of the parameters, all elements of the complete factorial matrix (Table 2) were used as the input data for training. The matrix elements, for which there were not experimental data, were calculated using the obtained statistical model. The points with negative values of viscosity were eliminated from consideration.
To minimize the sum squared error (SSE) the weight and bias values of network were updated according to Levenberg-Marquardt optimization process with Bayesian regularization32,33. The minimal
reached value of the SSE = 0.21 was obtained with 379 iterations. Figure 6 shows the results of the viscosity simulation, performed by ANN for the same conditions which were used for the viscosity simulation by statistical model presented on Figure 4. It is important to emphasize what the viscosity values simulated by ANN are non-nega-tive in all studied domain as opposed to viscosity values simulated by statistical model. The surface simulated by ANN has a form rather more complex than a surface obtained by statistical model.
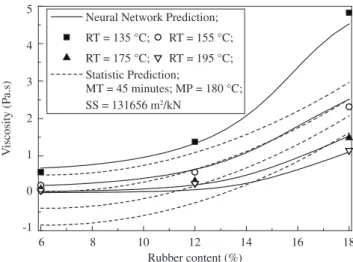
Figure 7 presents the experimental data (points) and simula-tion results (curves) of viscosity from the rubber content that is the main factor on viscosity variation, and the read temperature. As the experimental data show, the viscosity increases with rubber content addition for all read temperature values. The comparison between the experimental and predicted data indicates that ANN predictions describe experimental data better than statistical models. Figure 8 shows a comparison between the observed and predicted values of viscosity for all experimental data. The solid points, obtained by ANN
p1 p2 p3 p5 w1 1.1 w 2 1.1 w2 8.6 w3 6.1 w3 1.1 w1 5.8 b1 1 b1
2 b22 b
3 1 b2 1 b2 6 b1 8 n1 8 n 2 6 n2 2 n 3 1 a1 8 n1 2 n2 1 a1 2 a 2 2 a 3 3 a2 6 n1 1 a 1 1 a 2 1 1 1
1 1 1
1 1 f f f f f f f
Input Hidden Layer Hidden Layer Output Layer
Figure 5. Considered neural network architecture.
140 150 160 170 180 190 6 8 10 12 14 16 18 0.0 0.5 1.0 1.5 2.0 2.5 3.0 3.5 4.0 MT = 45 minutes; MP = 180 °C;
SS = 133656 m2/kN
Rubber content (%)
V
iscosity (P
a.s)
Read temperature (°C)
Figure 6. Surface ηx RC x RT to neural network approach.
6 8 10 12 14 16 18
Neural Network Prediction;
RT = 135 °C; RT = 155 °C;
RT = 175 °C; RT = 195 °C; Statistic Prediction;
MT = 45 minutes; MP = 180 °C; SS = 131656 m2/kN
V
iscosity (P
a.s)
Rubber content (%) 5 4 3 2 1 0 -1
Figure 7. Dependence of viscosity from rubber content and read
tempera-ture.
Figure 8. Scattering graph: comparison between observed and predicted values.
0 1 2 3 4 5 6
-1 0 1 2 3 4 5 6
Predicted viscosity (P
a.s)
Observed viscosity (Pa.s) Dependence Ideal
technique, were much nearer to equality line than the open points, representing the statistic model.
The determination coefficients (R2) calculated for both methods
were correspondingly equal to 0.76 for statistic model and 0.97 for ANN. Hence, it is sensible to say that the ANN technique has showed better performance than statistical model for the studied data collection.
4. Conclusions
This paper presents results of viscosity measurement and simulation in asphalt-rubber binders. The binders for experimental analysis were prepared in laboratory, varying the rubber content, particle size, duration and temperature of mixture in a wide range useful for practical applica-tion. To reduce the cost and the time of experiments the combinations of studied parameters were chosen by a statistical design plan.
Non-linear relation between shear rate and viscosity was ob-served, what indicates non-Newtonian and pseudoplastic behavior of asphalt-rubber.
Statistical Analysis and Artificial Neural Networks were used to simulate the mixes viscosity for prediction of the asphalt-rubber behavior. The statistical analysis shows that the Rubber Content is a main factor of viscosity variation in the studied domain.
There is also a significant influence of the mixing duration and read temperature in the viscosity variation. The mixes viscosity increases with a rise on these variables level. Among all studied parameters the rubber specific surface, that represents rubber size, has the lowest influence on response variable.
Both modeling techniques, Statistical Analysis and Artificial Neural Networks, can be used for academic and practical applica-tion to obtain the properties of a required mix; to understand the influence of involved phenomena and predict the behavior of these materials. The ANN method provides a best prediction of viscosity than statistical method.
The use of statistical analysis with statistical planning design and ANN method has allowed to obtain a satisfactory mathematical model for mixes viscosity prediction and showed that this combination is an excellent tool to simulate the mixes proprieties with reduced cost and laboratory efforts.
References
1. Asphat Institute. Asphalt handbook. Lexington: Manual Series Nº4 (MS-4); 1989.
2. Hunter RN. Bituminous mixtures in road construction. London: Thomas Telford; 1994.
3. Read j, Whiteoak D. Shell bitumen handbook. London: Thomas Telford; 2003.
4. Zaman Aa, fricke al, beatty cl. Rheological properties of rubber-modified asphalt. Journal of Transportation Engineering. ASCE. 1995; 121(6):461-67.
5. Newcomb DE, Stroup-Gardiner M, Kim JR, Allen B, Wattenhoffer-Spry J. Polymerized crumb rubber modified mixtures in Minnesota. Maplewood: Department of Civil and Mineral Engineering – University of Minnesota / Minnesota Department of Transportation. MN/RC 94/08; 1994. 6. Asphat Institute. Performance grade asphalt binder specification and
testing. Lexington: Superpave Series Nº1 (SP-1); 1994.
7. Asphat Institute. Superpave protocols for modified asphalt binders. Lexington: NCHRP 9-10 (Preliminary Draft); 2000.
8. Brulé B, Druon M. La microscopie de fluorescence appliquée à l’observation de bitumes thermoplastiques.Bulletin des laboratories des Ponts et Chaussées. LCPC. 1975; 11-14.
9. Bonemazzi F, Braga V, Corrieri C, Giavarini C, Sartori F. Characteristics of polymer and polymer-modified binders. Transportation Research Record. 1996; 1535:36-47.
10. Shin EE, Bhurke ES, Rosveld S, Lawrence TD. Microstructure, morphol-ogy, and failure modes of polymer-modified asphalts.Transportation Research Record. 1996; 1535:61-73.
11. Ceratti JA, Ruwer PM, Oliveira JA. Estudo do comportamento mecânico de concreto asfáltico com ligante modificado com polímeros. Proceed-ings of the13th Encontro do Asfalto. 1996; Rio de Janeiro, BR; 1996.
p. 90-103.
12. Silva LS, Forte MC, Specht LP, Ceratti JA. Polímeros modificadores asfálticos. Rio de Janeiro: Transportes. 2002; 10(1):84-106.
13. Leite LFM. Estudo de preparo e caracterização de asfaltos modificados por polímero. [Dr. thesis]. Rio de Janeiro: Universidade Federal do Rio de Janeiro; 1999. 266p.
14. Lucena LCC, Soares SA, Soares JB. Characterization and thermal behavior of polymer modified asphalt. Materials Research. 2004; 7(4):529-34.
15. Road Research Laboratory. Bituminous materials in road construction. London Department of scientific and industrial research. London; 1962. 16. Bahia HU, Davies R. Factors controlling the effect of crumb rubber on
critical properties of asphalt binders. Journal of the Association of Asphalt Paving Technologists. 1995; 64:130-163.
17. Fager GA. Asphalt-rubber overlay on rubblized concrete pavement on I-135. Transportation Research Record. 1996; 1543:71-78.
18. Takalou BH, Bahia HU, Perdomo D, Schwartz R. Use of Superpave technology for design and construction of rubberized asphalt mixtures. Transportation Research Record. 1997; 1583:71-81.
19. Way GB. Flagstaff I-40 asphalt rubber overlay project, nine years of success. Transportation Research Record. 78thAnnual Meeting. 2000.
Whasington, USA. 2000.
20. Specht LP. Avaliação de misturas asfálticas com incorporação de bor-racha reciclada de pneus. [Dr. thesis]. Porto Alegre: Universidade Federal do Rio Grande do Sul. 2004. 279p.
21. Faxina AL, Fabbri GTP, Sória, MAA, Leite LFM. Aplicação de redes neurais artificiais e de modelagem estatística para a previsão de proprie-dades convencionais de asfalto.Proceedings of the36th Reunião Anual
de Pavimentação; 2005; Curitiba: BR; 2005. p.1-12.
22. Heitzman M. Design and construction of asphalt paving materials with crumb rubber modifier. Transportation Research Record. 1992; 1339:1-8.
23. Epps AL. Thermal Behavior of crumb-rubber modified asphalt concrete mixtures. [D. Phil thesis]. Berkeley. University of Califórnia; 1997. 24. Oda S. Análise da viabilidade técnica da utilização do ligante
asfalto-bor-racha em obras de pavimentação. [Dr. thesis]. São Carlos. Universidade de São Paulo; 2000. 251p.
25. Lougheed TJ, Papagiannakis at. Viscosity characteristics of rubber-modified asphalts. Journal of materials in civil engineering. 1996; 8(3):153-156.
26. Montgomery DC. Design and analysis of experiments. New York: John Wiley and Sons; 1984.
27. Nanni LF, Ribeiro JL. Planejamento e avaliação de experimentos. Porto Alegre: Caderno de Engenharia; 1987.
28. American Society for Testing and Materials. Standard specification for performance graded asphalt binder. Annual Book of ASTM Standards. 2003; 9.01:1-3.
29. Draper NR, Smith B. Applied regression analysis. New York: John Wiley and Sons; 1967.
30. Fausett LV. Fundamentals of Neural Networks: architectures, algorithms, and applications. New Jersey: Prentice-Hall Inc; 1994.
31. Schalkoff RJ. Artificial Neural Networks. New York: The McGraw-Hill; 1997.
32. Foresee FD, Hagan MT. Gauss-Newton approximation to Bayesian regu-larization. Proceedings of theInternational Joint Conference on Neural Networks; 1997. Houston: USA; 1997. p. 1930-35.