doi: 10.1590/0101-7438.2016.036.01.0133
DECISION WITH ARTIFICIAL NEURAL NETWORKS IN DISCRETE EVENT SIMULATION MODELS ON A TRAFFIC SYSTEM
Mar´ılia Gonc¸alves Dutra da Silva
1, Jo˜ao Jos´e de Assis Rangel
2*,
David Vasconcelos Corrˆea da Silva
1, T´ulio Almeida Peixoto
2and ´Italo de Oliveira Matias
2Received October 6, 2014 / Accepted March 18, 2016
ABSTRACT.This work aims to demonstrate the use of a mechanism to be applied in the development of the discrete-event simulation models that perform decision operations through the implementation of an artificial neural network. Actions that involve complex operations performed by a human agent in a pro-cess, for example, are often modeled in simplified form with the usual mechanisms of simulation software. Therefore, it was chosen a traffic system controlled by a traffic officer with a flow of vehicles and pedestri-ans to demonstrate the proposed solution. From a module built in simulation software itself, it was possible to connect the algorithm for intelligent decision to the simulation model. The results showed that the model elaborated responded as expected when it was submitted to actions, which required different decisions to maintain the operation of the system with changes in the flow of people and vehicles.
Keywords: simulation, computational intelligence, artificial neural networks.
1 INTRODUCTION
The need for a more accurate representation of logical operations that involve decisions in the discrete-event simulation models (DES) has motivated several researchers as highlighted by Robinson et al. (2001). In general, modelers elaborate decisions made by the systems inves-tigated by means of basic rules, using logical operators as: “<”, “>”, “==”, “AND”, “OR”, “XOR” and their combinations. In a simpler way, the decisions in the systems are in many cases characterized in the models by a percentage of occurrence of a specific action. These percent-ages come from the historical data or observations of the logic function of the system. Thus, some operations that configure complex decisions as the ones carried out by a person who acts
*Corresponding author.
1Instituto Federal Fluminense (IFF), Campos dos Goytacazes, RJ, Brasil. E-mails: [email protected]; [email protected]
in a machine or a manual inspection of a process are often represented in an easier way in the models. For this reason, Banks et al. (2010) point that very simplified model results can lead to imprecise interpretations and induce decision-makers to errors.
On the other hand, according to Swain (2007), around 71% of the softwares used to build DES models allow customization by means of algorithms derived from other languages or external modules, which can be incorporated to the model codes. Thus, it is possible the combination of simulation models with genetic algorithms or artificial neural networks (ANNs) for optimization of variables or performance of more realistic decisions. For example, Bergmann et al. (2014) used ANN together with DES models to approximate the behavior of more intelligent decisions instead of trying to determine exact representations of the logic of the system. Pinho et al. (2012) has evaluated an optimization method based on genetic algorithms as a way of verifying the effi-ciency concerning the computational time when compared with commercial software packages. They have also cited a variety of techniques that can be found to combine simulation models with optimization.
In order to find ways to represent accurate decisions from the systems to be modeled, several researchers have sought manners to integrate simulation models with computational intelligence techniques to obtain models that make generation of more reliable results possible. For exam-ple, Silva et al. (2014) evaluated frameworks to generate ANN algorithms to be incorporated to DES models. The analysis was focused on finding ways that allow the performance of decisions through algorithms to be directly integrated to the code of the simulation model. The results showed that it was possible to use a framework that proved to be suitable for the creation of ANN, not presenting operating errors and incompatibilities with the code of the model built with a free and open-source software (FOSS) used for the construction of simulation models.
According to the exposed, this paper aims to show the application of the mechanism proposed by Silva et al. (2014) on modeling a system involving decision held by a logical action of a human agent acting within a process. For this, we modeled a system of urban traffic with an intersection containing flow of people and vehicles and traffic control managed by a traffic officer. In this case, the traffic officer’s actions were recorded over a period and, subsequently, incorporated into the simulation model code by way of an ANN. The “smart” algorithm sought to act in the model to represent the decisions of the traffic officer necessary to control the dynamics of traffic, considering different situations for the traffic of people and vehicles.
The article presents the following subdivisions: The first section displays the context and the purpose of the work. The second one introduces the concepts and methods. The third section describes the simulation model, and the fourth one exposes the results and discussions. Lastly, the fifth section shows the final considerations of the work.
2 CONCEPTS AND METHODS
2.1 Artificial Neural Networks (ANNs)
The Artificial Neural Networks have been motivated since the beginning by the analysis that the human brain processes information differently from the conventional digital computer. The brain presents itself as a highly complex, nonlinear and parallel computer (Haykin, 2001). McCulloch & Pitts proposed the artificial model of a biological neuron, in 1943, based on what was known about the biological neuron. Its mathematical description resulted in a model composed of n input terminals (dendrites), which receive the valuesx1,x2, . . .xn, and only 1 output terminal y. To represent the behaviour of synapses, the neuron input terminals have connected weights
w1, w2. . . wn, which values can be either positive or negative, depending on the corresponding synapses (Braga et al., 2011).
Heaton (2010) also claim that the ANNs are designed to perform small tasks and not great ones. In case of a complete application implemented with ANNs, there is a specific one for each task.
According to Zuben (2003), an ANN can emulate human behavior from input and output sam-ples. The input vector contains the set of information received by a human being and the output vector, the relative actions taken by him based on the information received.
2.2 Encog Framework
Encog is a framework of Artificial Intelligence (AI) Java.Net and C/C++ that was initially de-signed to support only ANN, but, over the years, it has been expanded to also work with machine learning in general. It has a graphical application known as Encog Workbench, which allows performing various tasks without having to write code lines. Because it is based on Java, the generated files can be used with any Encog framework. The Encog is under the Apache License 2.0, which is similar to LGPL (Lesser General Public License) (Heaton, 2010).
Researches conducted by Silva et al. (2014) presented data obtained from Baptista & Days (2013), Matviykiv & Faitas (2013), Codeproject (a-b 2010), in which was possible to conclude that Encog displayed better results when compared with other frameworks. It was also observed that the Encog has a large range of information available in tutorials, forums, discussion lists and published books, which, in terms of FOSS, ensures a greater prospect of continuity, growth, development of new resources and improvement of the tool.
The results of the tests showed that the Encog framework allowed the coupling of an ANN with a DES model run on FOSS. Thus, the framework proved to be suitable to create a smart module, without any operating errors and incompatibilities among the codes, having been able to perform an ANN in a reliable manner.
2.3 Methodology
software; verification and validation; experimental design; experimentation; and interpretation and analysis of the results.
The conceptual model was developed using the IDEF-SIM language proposed by Montevechi et al. (2010). The simulations were initiated only after the verification and validation of the model, which followed the methodology proposed by Sargent (2013) and Leal et al. (2011).
The creation of the ANN for the representation in the model code regarding decisions from the traffic officer was generated by applying the Encog framework.
The simulation model was built employing the Ururau FOSS. Information about this software as source code structure, site for download and cooperation, command description, among other features can be found in Peixoto et al. (2013).
3 SIMULATION MODEL
In this topic, we expose the analysis of an urban traffic system and the simulation model imple-mented from the respective system.
3.1 System description
Dotoli & Fanti (2006) described that the urban traffic systems can be seen as event-oriented systems and asynchronous systems. Its dynamics depends on the complex interactions among the time of several discrete events, as arrivals or departures of vehicles at intersections, and start or conclusion of all time stages of the traffic light plans that control the intersections.
There are specialized softwares that perform simulation of traffic intersections based on real-world data; however, some of those systems, although effective for operation and traffic mod-eling, have some limitations. Those systems are for specific use, which allows modeling the performance and behavior of vehicular traffic, not being possible to be used in different domains. Authors such as Helbing (2003), Baptista & Rangel (2013), and Ringhofer (2010) have studied traffic systems in analogy with the production lines of the industries. Considering the propitious environment for data collection, the road traffic constitutes itself as a good environment for study and research of discrete and dynamic system operations.
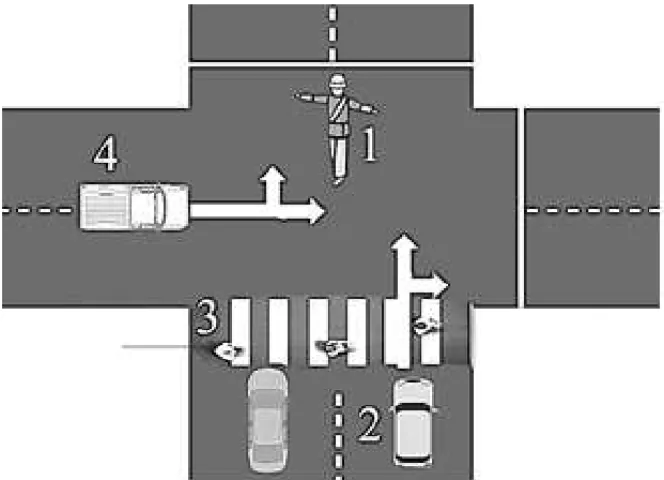
To develop this work, we chose an intersection controlled by a traffic officer, who decides whether the traffic flow moves in a specific street. He determines his resolutions based on several variables of traffic as the number of vehicles on every street, the number of pedestrians waiting to cross the street, the time required for the flow of traffic, among others. Figure 1 shows the schematic drawing of this intersection.
Figure 1– Urban intersection controlled by a traffic officer. (1) traffic officer; (2) pri-mary street with larger traffic flow; (3) crosswalk; and (4) secondary street.
The data were obtained by means of direct measurement, with time interval in terms of seconds, executed at the local of the intersection, in a period of uninterrupted 3 hours. It is important to emphasize that the measurements were executed without the traffic officer be aware. We took that decision so that his behaviour was as natural as possible. Besides, his identity was ignored, and all information that could lead to his identification was eliminated. Considering that there are several traffic officers who take turns in that place, we can ensure the information anonymity.
After collecting , the data were treated with the Input Analyzer software to determine the sta-tistical functions for the probability distributions that were more adapted to each data set of the system. An algorithm of ANN that in the Ururau software can be modeled directly by means of the ANN Decisor module, performed the traffic light control.
3.2 Model implementation
Figure 2 presents the simulation model of the system under study. The upper part of the model provides the primary and secondary streets, and the crosswalk. The other part represents the control logic of the intersection being carried out by the traffic officer. In this part, the ANN Decisor module represents the decisions of the traffic officer to let the traffic flow or not.
The Create module (En) is responsible for the generation of the entities that flow by the model.
ANN
Decisor module (1)
(2)
(3)
Figure 2– Traffic model in the Ururau.
The Hold module (Ln) corresponds to the element that retains the entities in a queue while a
certain condition is not true. In this case, while the variable “variablesemaforo” is equal to 1, the primary street is interrupted to vehicle traffic flow, similar to the traffic officer’s decision when interrupting the traffic flow in the street.
On the other hand, when the value of the “variablesemaforo” is equal to 0, it means that the primary street will be opened to traffic of vehicles, similar to what happens in a real intersection, when the traffic officer lets the vehicles pass.
Assign module (Cn) is responsible for the assignment of the variable “VariableCarStreet1”,
which will be incremented every time an entity vehicle goes through the system during the sim-ulation. This information is useful to generate reports of simulation and testing.
The Write module (Wn) is the means by which the data concerning the variable of vehicle
count-ing are recorded in a text file, while the simulation model runs.
Table 1 presents the model parameters relating to the part of the system that represents the flow of vehicles on the primary street, that is, the upper part of the simulation model (Fig. 2):
Table 2 presents the parameters of the model that represents the flow of vehicles of the secondary street. In this case, what distinguishes both streets are the configuration parameters of the model.
Table 1– Ururau software modules with description and configuration data of the primary street.
Module Name Description Configuration Data
Create E1 Responsible for the creation of entities
T. Arrival: LOGN (2.78, 3.84) seconds
T. First Arrival: 2 seconds Max. Arrival: Infinite
Hold L1 Holds the entities in a queue Expression: until the condition is satisfied VariableSemaforo=1
Assign C1 Adds a variable to the model
Type: Variable Name: VariableCarStreet 1 Value: VariableCarStreet 1+1
Write W1 Writes values of a variable on file
Name of the variable: VariableCarStreet 1
File: exit.txt
End – Ends the list of commands –
Table 2– Ururau software modules with description and configuration data of the secondary street.
Module Name Description Configuration Data
Create E2 Responsible for the creation of entities
T. Arrival: LOGN (3.5, 2.5) seconds T. First Arrival: 2 seconds
Max. Arrival: Infinite
Hold L2 Holds the entities in a queue Expression: until the condition is satisfied VariableSemaforo=0
Assign C2 Adds a variable to the model
Type: Variable Name: VariableCarStreet 2 Value: VariableCarStreet 2+1
Write W2 Writes values of a variable on file
Name of the variable: VariableCarStreet 2
File: exit2.txt
End – Ends the list of commands –
Observing Figure 2, every time an entity reaches the ANN Decisor (1) module, it is activated, receiving as input data: i) size of the vehicle queue of the primary street; ii) size of the vehicle queue of the secondary street; iii) size of the pedestrian queue; iv) value of the variable “time”; v) value of the variable “VariableSemaforo”.
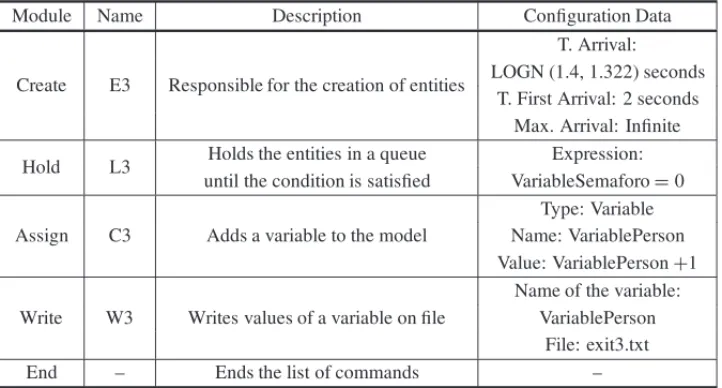
Table 3– Ururau software modules with description and configuration data for pedestrian flow.
Module Name Description Configuration Data
Create E3 Responsible for the creation of entities
T. Arrival: LOGN (1.4, 1.322) seconds
T. First Arrival: 2 seconds Max. Arrival: Infinite
Hold L3 Holds the entities in a queue Expression: until the condition is satisfied VariableSemaforo=0
Assign C3 Adds a variable to the model
Type: Variable Name: VariablePerson Value: VariablePerson+1
Write W3 Writes values of a variable on file
Name of the variable: VariablePerson
File: exit3.txt
End – Ends the list of commands –
Appendix A presents the description of the modules used in modeling with the respective infor-mation about their contents. This part of the model presents the ANN Decisor module, which represents the actions of the traffic officer, and decides the moment when the traffic flow is per-mitted in each street. The Create Module (E4) is responsible for creating the entities regarding each increment step of a second simulated. In other words, the control operations carried out by the simulation model for the actions of the traffic officer are checked in this time interval. Analyz-ing the real system, it was noticed that the traffic officer only starts checkAnalyz-ing the need to permit the traffic flow moves in a street after a minimum time; so, the module (C4) assigns a variable “time” to the model that is responsible for acting as a counter, key to ensure the synchronicity throughout the simulation model.
Figure 3 shows the screen for the configuration of the ANN Decisor module. On this screen, the data concerning the logic of operation of the traffic officer may be typed to be used in the generation of the ANN algorithm. This way, the algorithm regarding the ANN will be part of the simulation model code and will be run on an integrated manner in simulation time.
The training algorithm used was the Resilient Propagation Training. Training algorithms with propagation use supervised training, in which it is necessary to inform values of inputs and outputs expected. An advantage in relation to the use of Resilient Propagation Training is that it does not require the use of parameters, as learning rate, which is often difficult to determine (Heaton, 2010).
Figure 3– Configuration screen of ANN Decisor for traffic model.
expressions of neurons 4 and 5 (Fig. 3) are related to the values of the variables “time ” and “variablesemaforo”.
Note that the ANN created for that model uses 4 neurons in the hidden layer and 1 neuron in the output layer.
During the runtime of the simulation model, the ANN is activated whenever an entity needs to pass by the ANN Decisor module and needs to take a decision on its route.
Referring to Figure 4, there is the operation routine of the simulation model with the smart module. That is, the data collected from the real system (1) are used for the training of the ANN (2). This should be performed before the start of the simulation. Subsequently, the entities start their course along the simulation model (3). Every time an entity reaches the Decisor module (4), the ANN (5), previously trained, is activated.
1
2
3
4
5
6 7
8
1 Real Data 5 ANN
2 ANN Training 6 ANN Input Data
3 Simulation Model 7 ANN Output Data
4 ANN Decisor Module 8 ANN Decision
Figure 4– Scheme of the Simulation Model Implementation in the Ururau with ANN.
expression evaluator of the Ururau, such as the size of a given queue, the time an entity waits in line or even the result of an expression. The output result after carrying out the decision by the ANN is shown in (7). The output value of that ‘intelligent’ decision acts in the model by means of the deviation of the entity that flows in (8) deciding the path it has to take through the logic of the model.
That is, when any entity that flows through the model is being executed in the Decisor module (4), that entity will start the execution of the intelligent decision with the ANN in (5). At that moment, the ANN (6 and 7) is performed. The result of that decision implements the deviation of the entity in (8), that may flow through the upper part in (W4 or W5) or the lower part in (W6 or W7).
4 RESULTS AND DISCUSSIONS
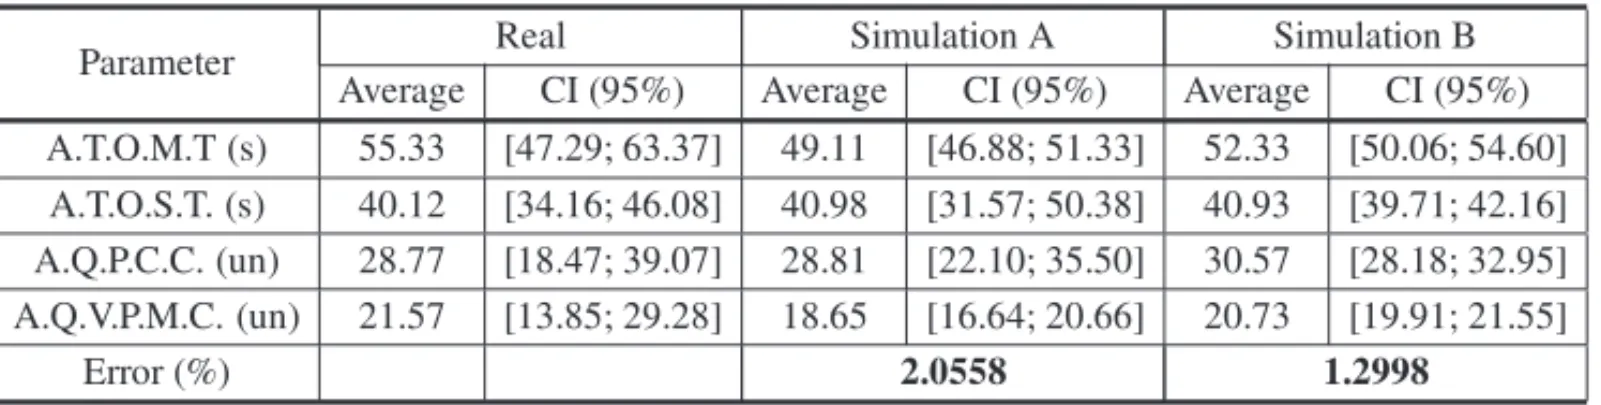
Table 4– Results of the Simulation Model Execution with ANN.
Parameter Real Simulation A Simulation B
Average CI (95%) Average CI (95%) Average CI (95%) A.T.O.M.T (s) 55.33 [47.29; 63.37] 49.11 [46.88; 51.33] 52.33 [50.06; 54.60] A.T.O.S.T. (s) 40.12 [34.16; 46.08] 40.98 [31.57; 50.38] 40.93 [39.71; 42.16] A.Q.P.C.C. (un) 28.77 [18.47; 39.07] 28.81 [22.10; 35.50] 30.57 [28.18; 32.95] A.Q.V.P.M.C. (un) 21.57 [13.85; 29.28] 18.65 [16.64; 20.66] 20.73 [19.91; 21.55]
Error (%) 2.0558 1.2998
A.T.O.M.T.: Average Time the Primary Street is opened to Traffic (in seconds) A.T.O.S.T.: Average Time the Secondary Street is opened to Traffic (in seconds) A.Q.P.C.C.: Average of the amount of Pedestrians Crossing the Street by Cycle (unit) A.Q.V.P.M.C.: Average of the amount of Vehicles Passing by the Primary Street by Cycle (unit) CI: Confidence Interval
With the analysis of the implementation results of the model, it was possible to observe the value of the error of ANN in relation to the real data of the system. Note that Simulation B had less er-rors regarding Simulation A. It is important to mention that the average values obtained are close in both situations, however, in some cases, it was verified a greater difference between the Confi-dence Interval (CI) of measurement of the real system with the Simulation A and Simulation B. It is possible that this difference is related to the fact that the measurements of the simulations have a quantity of observations greater than the real system due to the ease of generating data automatically in the simulated system.
In addition, some factors may have influenced those data as, sometimes, the traffic officer’s decision did not reflected any predetermined pattern. That happened because he got distracted talking to someone that approached him, consequently, taking no decision for a period of time superior to what had been executed so far. Similarly, in some moments, there was a traffic jam due to, for example, passengers that got off the bus in the middle of the street rather than at the bus stop, or pedestrians who crossed the street outside the crosswalk.
All variables of the real system, when analyzed, showed a strong connection among them given that, as it was an intersection, when a street was open to the traffic flow, the other one had to be closed. When trying to reproduce these atypical behaviors in the simulation model using ANN, the training data of the network receives values that are not in any standard, which can influence both in the error of the ANN and in the decision taken by it.
On the other hand, to try to remove those different points of the simulation data means to modify the function curve that represents the rate of arrival of the entities in the model, i.e. the simulation model shall not represent the real system. For these reasons, we chose to keep the data collected according to the real system and analyze their impact, noting the error of the ANN.
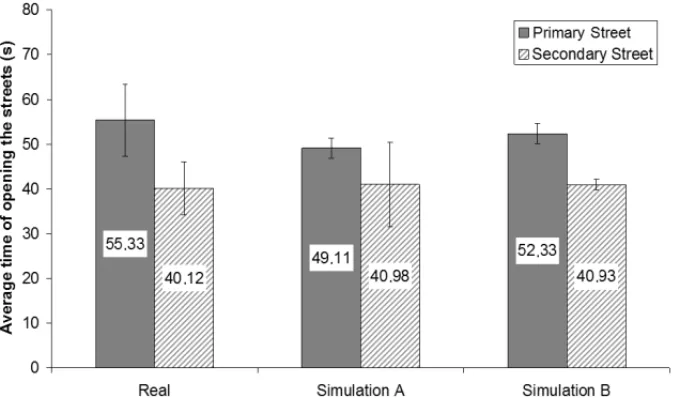
Figure 5– Comparison of the average time of opening the streets to traffic in the real and in the simulated systems.
The times obtained in the Simulation B approach a little more to the real traffic system, cor-roborating with the fact the ANN had presented a lower error value during the simulation. A similar behaviour can be observed in Figure 6, which presents a comparison of the average time of opening the streets to traffic in the real and simulated systems.
Figure 6– Comparison of the average amount of vehicles and pedestrians in the real and simulated systems.
Scenario 1: Increase in the rate of arrival of vehicles on the primary street. It was observed that there is significant increase in the flow of vehicles passing by the primary street at peak times, which correspond to the times of arriving and leaving of students from schools. This street has schools along it, and is still one of the accesses to other educational institutions, which are located close to it. This way, in order to represent an increase in the flow of vehicles on the primary street, the arrival rate of vehicles was doubled.
Scenario 2: Increase in the rate of arrival of pedestrians. A large number of pedestrians crosses the place where the intersection under study is located since it is an area where the municipal market and popular shops are located. On holidays, such as Christmas and Mother’s Day, we see a considerable increase in the number of people around there as it is a good area to buy gifts and things at a more affordable price. To characterize this scenario, the function that represents the rate of arrival of pedestrians to cross the primary street was doubled. In this case, the same function that represents the real system was also maintained.
Table 5 shows the information about the real system and of the two simulated scenarios.
Table 5– Results of the Execution of the Simulation Model in Scenarios 1 and 2.
Parameter Real Scenario 1 Scenario 2
Average CI (95%) Average CI (95%) Average CI (95%)
A.T.O.M.T (s) 55,33 [47,29; 63,37] 63,15 [57,64; 68,66] 45,40 [43,59; 47,21] A.T.O.S.T (s) 40,12 [34,16; 46,08] 39,72 [38,65; 40,49] 43,96 [37,26; 50,66] A.Q.P.C.C (un) 28,77 [18,47; 39,07] 28,58 [27,29; 29,87] 62,48 [52,79; 72,16] A.Q.V.P.M.C (un) 21,57 [16,42; 34,72] 43,27 [38,90; 47,65] 16,65 [15,52; 17,79]
Error (%) 1.5810 1.6282
A.T.O.M.T.: Average Time of Opening the Primary Street to Traffic (seconds) A.T.O.S.T.: Average Time of Opening the Secondary Street to Traffic (seconds) A.Q.P.C.C.: Average Amount of Pedestrians Crossing the Street by Cycle (unit) A.Q.V.P.M.C.: Average Amount of Vehicles Passing by the Primary Street by Cycle (unit) CI: Confidence Interval
Note that, by increasing the rate of arrival of vehicles on the street 1 (scenario 1), the ANN responds by increasing the average time of opening this street to traffic, which enables a greater amount of vehicles passing by the street per cycle. The effect of this decision has some impact on the street 2, that has its average time slightly reduced compared to the real system. The average amount of pedestrians crossing the street suffered no major impact.
Figure 7 presents data concerning the amount of vehicles passing by the streets for the scenarios 1 and 2.
Figure 7– Comparison of average amount of vehicles and pedestrians in different scenarios.
Figure 8– Comparison of the average time of opening the street per cycle in different scenarios.
5 CONCLUDING REMARKS
The results also showed that the Ururau software enabled, by being free and open-source, be used as a scientific research environment for better understanding and improvement of the mechanism used. Until the final version of this work, it had not been found yet, in literature, a simulation software able to directly run an ANN in simulation time. Similarly, it could be considered pioneer the possibility of designing an ANN from the graphical interface of the simulation environment, and obtain the data that feed the input neurons of the ANN at runtime. The model created with data obtained from the real traffic system was able to represent an intersection controlled by a traffic officer. In this case, ANN managed to generate decisions similar to this one, assuming a confidence interval of 95%.
Thus, it was possible to note that the ANN algorithm generated results with good approximation in relation to the real behaviour of the traffic officer. Once trained, at each simulation, the algo-rithm can generate closer results, but different due to the random nature of the network training. Considering the results obtained in the two tested scenarios, it could be noted that ANN corre-sponded to what was expected, once it took different decisions when presented situations other than those that had been carried out.
The analogy sought between the industrial production lines and the open traffic systems en-abled the acquisition of free-form data to conduct studies. However, it is important to highlight that, in some cases, the behavior of the traffic officer was different from a typical situation of production line. This was noticed once the operator in an industrial environment tends to obey pre-established patterns to operate the system. Although this is also true for a traffic officer, the free and open environment of the streets makes that this behavior be often influenced and not reflect more restricted and predefined patterns.
ACKNOWLEDGMENTS
The authors thank the National Council for Scientific and Technological Development (CNPq) and the Research Foundation of the State of Rio de Janeiro (FAPERJ) for financial support for this research. Thanks are also due to Maria Marta Garcia for assistance with translating the paper into English.
REFERENCES
[1] BANKSJ, CARSONII JS, NELSONBL & NICOL D. 2010. Discrete-Event System Simulation. 5th ed., Prentice-Hall: Englewood Cliffs, NJ.
[2] BAPTISTAD & DIASFM. 2013. A survey of artificial neural network training tools. Neural Comput & Appic.New Applications of Artificial Neural Network in Modeling & Control. Springer-Verlag, London.
[3] BAPTISTARCT & RANGELJJA. 2013. Simulac¸˜ao a Eventos Discretos de uma Via Semaforizada com Controle Automatizado em Tempo Real.Revista Produc¸˜ao Online,13: 290–317.
[4] BERGMANNS, STELZERS & STRASSBURGERS. 2014. On the use of artificial neural networks in simulation-based manufacturing control.Jornal of Simulation,8: 76–90.
[6] CODEPROJECT– BENCHMARKING ANDCOMPARINGENCOG, NEUROPH ANDJOONE NEURAL NETWORKS. 03 de junho de 2010 (a). http://www.codeproject.com/Articles/85487/Benchmarking-and-Comparing-Encog-Neuroph-and-JOONE. Accessed 28/06/2013.
[7] CODEPROJECT– COMPARINGNEURALNETWORKS INNEUROPH, ENCOG ANDJOONE. 02 de Junho de 2010 (b). Dispon´ıvel em: http://www.codeproject.com/Articles/85385/Comparing-Neural-Networks-in-Neuroph-Encog-and-JOO. Accessed: 28/06/2013.
[8] DOTOLI M & FANTI MP. 2006. An urban traffic network model via coulored timed Petri nets. Control Engineering Practice,14: 1213–1229.
[9] HAYKINS. 2001. Redes Neurais Artificiais Princ´ıpios e Pr´atica. Traduc¸˜ao: Paulo Martins Engel. 2a. Edic¸˜ao. Porto Alegre: Bookman. 900 p.
[10] HEATON J. 2010. Introduction to Encog 2.5. Heaton Research, Inc. 108 p. Available on: http://www.Heatonresearch.com/Encog. Accessed: 15/07/2013.
[11] HELBING D. 2003. Modelling and Optimization of production processes: lessons fron traffic dynamics. Working Paper. Retirado de: http://www.santafe.edu/research/working-papers/abstract/ dacaed19ae05872fce780032a1f12456/ Accessed: 01/2012.
[12] LEALF, COSTARFS, MONTEVECHIJAB, ALMEIDADA & MARINSFAS. 2011. A practical guide for operational validation of discrete simulation models.Pesquisa Operacional,31(1): 57–77.
[13] MATVIYKIVOM & FAITASOI. 2013. Data Classification of Spectrum Analysis Using Neural Net-work. Lviv Polytechnic National University, Computer-Aided Design Department.
[14] MONTEVECHIJAB, LEAL F, PINHO AF, SILVA RFC, OLIVEIRA MLM & SILVA ALF. 2010. Conceptual modeling in simulation projects by mean adapted IDEF: An application in a Brazilian tech company. In: Winter Simulation Conference, 2010, Baltimore.Proceedings of the Winter Simu-lation Conference, p. 1624–1635.
[15] PEIXOTOTA, RANGELJJA, MATIASIO, MONTEVECHIJAB & MIRANDARC. 2013. Ururau – Um Ambiente para Desenvolvimento de Modelos de Simulac¸˜ao a Eventos Discretos. PODes –Revista Eletr ˆonica Pesquisa Operacional para o Desenvolvimento,5(3): 373–405.
[16] PINHOAF, MONTEVECHIJAB, MARINSFAS, COSTARFS, MIRANDARC & FRIENDJD. 2012. Evaluation of a proposed optimization method for discrete-event simulation models.Pesquisa Opera-cional,32(3): 543–559.
[17] RINGHOFERCA. 2010. Level set approach to modeling general service rules in supply chains. Communications in Mathematical Sciences, 909–930.
[18] ROBINSONS, ALIFANTIS T, HURRION R, EDWARDS JS, LADBROOKJ & WALLER T. 2001. Modelling and Improving Human Decision Making With Simulation. In: Winter Simulation Con-ference, IEEE, Arlington, p. 913–920.
[19] SARGENTRG. 2013. Verification and Validation of Simulation Models.Journal of Simulation,7: 12–24.
[20] SILVA MGD, RANGELJJA, SILVADVC, PEIXOTOTA & MATIASIO. 2014. Decis˜ao com Re-des Neurais Artificiais em Modelos de Simulac¸˜ao a Eventos Discretos.PODes – Revista Eletr ˆonica Pesquisa Operacional para o Desenvolvimento,6(2): 299–317.
[21] SWAINJJ. 2007. Discrete Event Simulation Software: New Frontiers in Simulation.OR/MS Today– INFORMS,34(5): 32–43.
APPENDIX A– Ururau modules with description and configuration data.
Module Name Description Configuration Data
Create E4 Responsible for the creation of entities
T. Arrival: Const. (1s) T. First. Arrival: 1 second
Max. Arrival: Infinite
Assign C4 Adds a variable to the model
Type: Variable Name: time Value: time+1
X (Decisor) X1 Deviates the execution of a function
Type: ANN with 2 ways Training file: C:\DataTreiningANN5Neurons
Modified.CSV Algorithm: ResilientPropagation Exp. Neuron 1: L1.Segurar1.queue Exp. Neuron 2: L2. Segurar2.queue Exp. Neuron 3: L3. Segurar3.queue
Exp. Neuron 4: time Exp. Neuron 5: variablesemaforo
Number Neurons Input Layer: 5 Number Neurons Hidden Layer: 4 Number Neurons Output Layer: 1
X (Decisor) X2 Deviates the execution of a function Type: 2 ways by condition Condition: variablesemaforo ==0
X (Decisor) X3 Deviates the execution of a function Type: 2 ways by condition Condition: variablesemaforo ==1
Write W4 Writes values of a variable on file Variable name: time File: semaforo1.txt
Write W5 Writes values of a variable on file Variable name: time File:semaforo1.txt
Assign C5 Adds a variable to the model
Type: Variable Name: variablecarstreet1
Value: 0
Assign C6 Adds a variable to the model
Type: Variable1 Name: variablecarstreet2
Value: 0
Assign C7 Adds a variable to the model
Type: Variable Name: variableperson
Value: 0
Assign C8 Adds a variable to the model
Type: Variable Name: time
Value: 0
Assign C9 Adds a variable to the model
Type: Variable Name: variablesemaforo