A I 0011.2 P;R E RM ;)01 USF 480 -tH 51-1
DCCLMENTATION & HEALTH IiNFG -,WASiINGTON DC USA
71
77
79
S
Traffic Accident
Introduction
Traffic accidents have ceased to be the exclusive domain of the developed countries and have be-come, particularly among active young people, one of the principal causes of injuries, disabilities, and deaths in developing countries. Consequently, for each death in a traffic accident, on the average about 30 man/years of life expectancy are lost. This figure *is considerably lower for cardiovascular diseases and cancer, which precede traffic accidents as a cause of mortality among the general population. On the other hand, individuals disabled by injuries in traffic accidents have displaced those affected by poliomye-litis in rehabilitation centers.
The economic impact is considerable; to direct costs such as damage to vehicles, roads, and proper-ty, medical care for the injured, and expenditures for administrative services indirect costs should be added, especially those due to the loss of potential productivity on the part of the victims.
In the countries of Latin America and the Carib-bean (where great differences exist between coun-tries or subregions), activities for the prevention and control of accidents and their consequences are, in
Vol. 5, No. 2, 1984
general terms, at an incipien: .tgo f dc-., t. In these countries, traffic accidents are assuming epidemic proportions due to the increase in the pop-ulation and in the total number of registered vehi-cles, as well as to the growth in urbanization and in-dustrialization. Advances in traffic legislation, high-way education for motorists, and road and vehicle safety have not kept pace with the factors generating the problem.
Latin American and Caribbean countries should consolidate the progress some have achieved and promote similar developments in the rest. Improved support systems can translate that progress into con-crete projects for preventing accidents and diminish-ing their consequences; the experience of the indus-trialized countries in this field can be creatively uti-lized and studies can be made of the countries' own situation in order to design appropriate programs.
Current Situation: Measuring the Magnitude and Seriousness of the Problem
As mentioned above, the countries of the Region of the Americas present widely diverse socioeconom-ic and cultural scenarios whsocioeconom-ich include the most and
IN THIS ISSUE...
· Traffic Accidents in the Americas
· Status of Chagas' Disease in the Region of the Americas · Diseases Subject to the International Health Regulations
* Application of Epidemiology in Medical Technology As-sessment
· Reports on Meetings and Seminars * Calendar of Courses and Meetings · Publications
least developed countries in the world; between these two extremes there is a great variety of situa-tions. Human transportation is, of course, among the important variables in development.
Table 1 presents the number of motor vehicles registered in 1969 and 1980 and the percentage in-creases which ranged between 13.3% and 324.4% for 15 countries in the Region.
Table 2 relates the population and the total reg-istered vehicles through the motorization index (number of motor vehicles/number of inhabitants), which ranged from 0.004 to 0.500 in 1969 and from 0.027 to 0.728 in 1980. A total of 14 of the 15 coun-tries in which a comparison could be made had per-centage increases in that period ranging between 12.2% and 875.0%; only one country (Cuba) ex-perienced a decrease in this indicator. This table supports the assumption that the risk of traffic ac-cidents among the population increased in almost all the countries analyzed.1
Regrettably, registration is uneven, since in most countries, data are collected only on those accidents considered serious. This inconsistency hinders veri-fication and renders deaths caused by accidents a necessary yardstick, even though these are defined in notably different ways: for some, these are deaths at the site of the event, and for others, they are deaths within the month or the year following the ac-cident.
Table 3 presents the traffic accident deaths in 1969 and 1980 as well as the rates per 100,000 in-habitants and per 10,000 vehicles, including the percentage variations observed for each of these two indicators. An analysis of this table reveals the following: in Costa Rica, Cuba, Ecuador, Guatema-la, Panama, Peru, Trinidad and Tobago, Uruguay, and Venezuela the specific mortality rate from 1969 to 1980 registered an increase which oscillated be-tween 9.7% and 167.3%; in Argentina, Chile, Can-ada, Colombia, Dominican Republic, El Salvador, and the United States reductions were noted in that rate ranging from 4.0% to 26.4%. The mortality rate per 10,000 vehicles increased in Cuba, Gua-temala, Panama, and Uruguay and ranged between 1.9 % and 90.0%; in the rest of the countries the rate decreased, ranging between 1.6% and 73.8%.
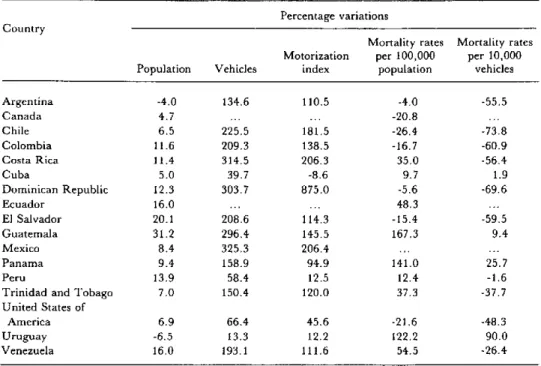
Table 4 summarizes the percentage variations of the five above-mentioned elements to provide a bet-ter comparative analysis. In general, it could be
1
Another important index correlates the total registered vehicles with the kilometers of roadway: greater density suggests greater risk.
Table 1. Number and percentage variation of vehicles registered in selected countries of the Americas
in 1969 and 1980.
Registered vehicles Variation Country
1969 1980 ( % )
Argentina 1,804,700 4,234,527 134.6
Brazil 2,490,900 ...
Canada 7,746,800a ...
Chile 254,500 828,480 225.5
Colombia 264,300 817,611 209.3
Costa Rica 51,600 213,904 314.5
Cuba 265,700 371,287 39.7
Dominican Republic 51,400 207,501 303.7
Ecuador 56,300 ...
El Salvador 47,200 145,680 208.6
Guatemala 5 2,8 0 0b 209,289 296.4
Mexico 1,465,800 6,221,397 324.4
Panama 53,200 137,721 158.9
Peru 306,900 486,048 58.4
Trinidad and Tobago 86,400 216,341 150.4 United States of
America 99,563,400 1 6 5,7 00,0 0 0c 66.4
Uruguay 232.300 263,119 13.3
Venezuela 863,784 2,532,000 193.1
...No data available. a1968.
b1967. c1981.
Table 2. Index and percentage variation of motorization in selected countries of the Americas in 1969 and 1980.
Motorization indexa Variation Country
1969 1980 (%)
Argentina 0.076 0.160 110.5
Brazil 0.028 ...
Canada 0.373 ...
Chile 0.027 0.076 181.5
Colombia 0.013 0.031 138.5
Costa Rica 0.032 0.098 206.3
Cuba 0.035 0.032 -8.6
Dominican Republic 0.004 0.039 875.0
Ecuador 0.010 ...
El Salvador 0.014 0.030 114.3
Guatemala 0.011 0.027 145.5
Mexico 0.031 0.095 206.4
Panama 0.039 0.076 94.9
Peru 0.024 0.027 12.5
Trinidad and Tobago 0.085 0.187 120.0 United States of America 0.500 0.728 45.6
Uruguay 0.082 0.092 12.2
Venezuela 0.086 0.182 111.6
...Data not available. aRatio of vehicles/population.
assumed that the increase in the motorization index contributed to raising the death rates per 100,000 population in nine of the countries analyzed; in con-trast, it appears to have contributed to reducing the death rates per 10,000 vehicles in 10 of the countries.
2
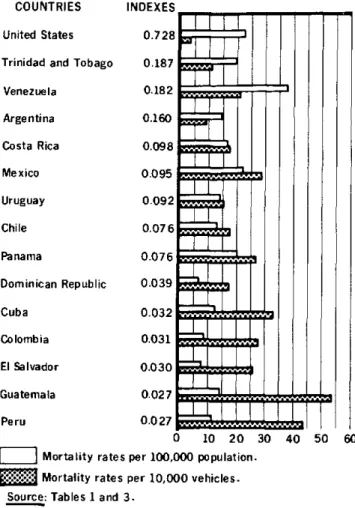
Figure 1 shows clearly the correlation between the two indicators most widely used in measuring the * magnitude and seriousness of traffic accidents: mor-tality rates per 100,000 population and per 10,000 vehicles. It can be seen that in the countries with a
very high motorization index (as in the United States) the mortality rate per 10,000 vehicles reaches, approximately, 22.2% of the value of the rate per 100,000 population. In countries with a high motori-zation index (0.160-0.187) that rate reaches 50-75%
Table 3. Number of deaths from traffic accidents in selected countries of the Americas in 1969 and 1980 and percentage variation.
Mortality rates per Mortality rates per Number of deaths 100,000 population 10,000 vehicles Country
1969 1980 1969 1980 Variation 1969 1980 Variation
(%) (%)
Argentina 3,524 3,779 14.9 14.3 -4.0 20.0 8.9 -55.5
Brazil ... 20,217 ... 16.4 ... ... ...
Canada 5,696 5,170a 27.4 21.7a -20.8 7.0
Chile 1,668 1,434 17.8 13.1 -26.4 66.0 17.3 -73.8
Colombia 2,026 2,242 10.2 8.5 -16.7 70.0 27.4 -60.9
Costa Rica 201 363 12.3 16.6 35.0 39.0 17.0 -56.4
Cuba 947 1,212 11.3 12.4 9.7 32.0 32.6 1.9
Dominican Republic 286 353 7.1 6.7 -5.6 56.0 17.0 69.6
Ecuador 837 1,817a 14.7 21.8a 48.3 149.0
El Salvador 296 371 9.1 7.7 -15.4 63.0 2 5.5b -59.5
Guatemala 261 1,123 5.5 14.7 167.3 49.0 53.6 9.4
Mexico ... 17,507 ... 26.8 ... ... 28.1 ...
Panama 114 364 8.3 20.0 141.0 21.0 26.4 25.7
Peru 1,336c 2,103 10.5c 11.8 12.4 44.Oc 43.3 -1.6
Trinidad and Tobago 148 230 14.5 19.9 37.3 17.0 10.6 -37.6
United States of
America 56,400 5 0,8 0 0b 28.3 2 2.2b -21.6 6.0 3.1b -48.3
Uruguay 177 400 6.3 14.0 122.2 8.0 15.2 90.0
Venezuela 2,424 5,211 24.2 37.4 54.5 28.0 20.6 -26.4
...Data not available. a1978.
b1981.
C1967.
Table 4. Percentage variations of some indicators related to deaths from traffic accidents between 1969 and 1980 in selected countries of the Americas.
Percentage variations Country
Mortality rates Mortality rates Motorization per 100,000 per 10,000 Population Vehicles index population vehicles
Argentina -4.0 134.6 110.5 -4.0 -55.5
Canada 4.7 ... ... -20.8 ...
Chile 6.5 225.5 181.5 -26.4 -73.8
Colombia 11.6 209.3 138.5 -16.7 -60.9
Costa Rica 11.4 314.5 206.3 35.0 -56.4
Cuba 5.0 39.7 -8.6 9.7 1.9
Dominican Republic 12.3 303.7 875.0 -5.6 -69.6
Ecuador 16.0 ... ... 48.3 ...
El Salvador 20.1 208.6 114.3 -15.4 -59.5
Guatemala 31.2 296.4 145.5 167.3 9.4
Mexico 8.4 325.3 206.4
Panama 9.4 158.9 94.9 141.0 25.7
Peru 13.9 58.4 12.5 12.4 -1.6
Trinidad and Tobago 7.0 150.4 120.0 37.3 -37.7
United States of
America 6.9 66.4 45.6 -21.6 -48.3
Uruguay -6.5 13.3 12.2 122.2 90.0
Venezuela 16.0 193.1 111.6 54.5 -26.4
...Data not available.
Figure 1. Ratio of mortality rates per 100,000 population and per 10,000 vehicles, according to motorization indexes
in selected countries, Region of the Americas, 1980.
COUNTRIES
United States
Trinidad and Tobago
Venezuela
Argentina
Costa Rica
Mexico
Uruguay
Chile
Panama
Dominican Republic
Cuba
Colombia
INDEXES
0.728
0.187
0.182
0.160
0.098
0.095
0.092
0.07 6
0.076
0.039
0.032
0.031
El Salvador 0.030
Guatemala 0.027
Peru 0.027 . ....
0 10 20 30 40 50 60 [
1
Mortality rates per 100,000 population.::,.': Mortality rates per 10,000 vehicles. Source: Tables 1 and 3.
of the rate related to population (Trinidad and To-bago, Venezuela, and Argentina). In the countries with a low motorization index, Costa Rica, Mexico, and Uruguay (0.092-0.098) the two rates are close or equal; finally, in the countries with a very low motori-zation index (less than 0.080) the mortality rate per 10,000 vehicles is one or more times higher than the value of the rate for the population.
It should be noted that categorization of the coun-tries according to the value of the motorization index is conventional and is only an attempt to explain the numerical phenomenon observed.
The PAHO/WHO Commitment
WHO categorically expressed its interest in traffic accidents during the XIX World Health Assembly in 1966 when the Member States approved a resolu-tion encouraging the Organizaresolu-tion to play a more active role in accident prevention. In 1976 a decision
was adopted to delegate responsibilities to the Re-gional Offices of WHO, entrusting the management of the world program to the Regional Office for Eu- O rope.
Since the beginning of the 1970s, several seminars and meetings have been held in the Region of the Americas under the auspices of PAHO for the pur-pose of promoting the formulation of comprehensive national programs for preventing traffic accidents. Among these activities, the following may be men-tioned: a seminar on "Alcoholism and Drug Addic-tion and the Problem of Traffic Accidents" (Lima, January 1976); two Andean subregional seminars
(Lima, November 1977 and Guayaquil, December 1978), and a seminar on "Traffic Accidents in De-veloping Countries," held jointly with the World Bank (Washington, D.C., May 1979).
As part of the plan for studying the problem and establishing effective measures for accident preven-tion, a conference was held in Mexico City in No-vember 1981 on "Traffic Accidents in Developing Countries." About 130 delegates from some 50 countries participated, representing different sectors of public and private service (particularly transpor-tation and public health) and a broad range of disci-plines. The discussions and recommendations were directed toward seven specific points: information, organization, legislation, alcohol and drugs, training and education, roads and vehicles, and international cooperation.
An important area of PAHO cooperation with countries interested in the problem is the provision of epidemiological and statistical support for mea-suring the problem; assistance in the planning and organization of services, including better data collec-tion; and promotion of the training and education of personnel involved in the respective programs. An example of this is the "Course on Prevention and Control of Injuries in Traffic Accidents in Develop-ing Countries," sponsored by WHO and held in June 1983 at the Johns Hopkins University, Mary-land, United States.
PAHO's role is to collect and disseminate infor-mation on traffic accidents in the countries and thus promote the adoption of uniform terminology and statistical systems that make possible the collection of correct and comparable data.
(Source. Health of Adults Unit, Health Programs Development, PAHO.)
4