ISSN 0104-6632 Printed in Brazil
www.abeq.org.br/bjche
Vol. 31, No. 03, pp. 715 - 726, July - September, 2014 dx.doi.org/10.1590/0104-6632.20140313s00002786
Brazilian Journal
of Chemical
Engineering
UASB REACTOR STARTUP FOR THE
TREATMENT OF MUNICIPAL WASTEWATER
FOLLOWED BY ADVANCED OXIDATION
PROCESS
Z. A. Bhatti
1*, F. Maqbool
2, A. H. Malik
1and Q. Mehmood
31Department of Environmental Sciences, COMSATS, Institute of Information Technology Abbottabad 22010, Pakistan.
E-mail: [email protected] 2
Department of Microbiology, Hazara University Mansehra 21300, KPK, Pakistan. 3Department of Plant and Soil Sciences, University of Kentucky KY 40546-0091 USA.
(Submitted: June 24, 2013 ; Revised: November 11, 2013 ; Accepted: November 19, 2013)
Abstract - The present study was done to shorten the start-up time of up-flow anaerobic sludge blanket (UASB) reactor. Two different nutrients were used during the UASB start-up period, which was designed to decrease the hydraulic retention time (HRT) from 48 to 24 and 12 to 6 hrs at average temperatures of 25-34 ºC. In the first stage, start-up was with glucose for 14 days and then the reactor was also fed with macro- and micronutrients as a synthetic nutrient influent (SNI) from 15 to 45 days as the second stage. For the control, a second reactor was kept on glucose feeding from day 1 to 45. The removal efficiencies of the chemical oxygen demand (COD) were 80% and 98% on the 6th and 32nd day of the first and second stage, respectively. The maximum substrate removal rate of 0.08 mg COD mg-1 VSS d-1 was observed for glucose and synthetic
nutrient influent (SNI) on the 8th and 40th days, respectively. When the reactor reached the maximum COD
removal efficiency it was then shifted to municipal wastewater (MWW) mixed with industrial wastewater. The HRT was reduced gradually with a one week gap while treating MWW. For further cleaning, the UASB effluent was treated with 40% waste hydrogen peroxide. The whole integrated treatment process was successful to reduce the COD by 99%, total suspended solids (TSS) by 73%, total nitrogen (TN) by 84% and turbidity by 67%.
Keywords:Start-up time; UASB reactor; COD removal; Substrate uptake.
INTRODUCTION
In many countries, UASB reactors have been used since last decade to treat sewage water due to their easy handling and low operating cost. However, to shorten the start-up period, the reactor is often inocu-lated with active microorganisms or granules, other-wise it takes more than three months or longer to achieve full efficiency for municipal wastewater (MWW) (Lettinga et al., 1993). Before direct treat-ment of wastewater, the UASB reactor passes through
a start-up time period with selected nutrients as sub-strate. The study by Zhou et al. (2006) proved that the substrate produced more electrolytes in the reac-tor, which improved the granulation and thus the treatment efficiency, as well as shortened the start-up time. An anaerobic process includes principally three metabolic phases, i.e., hydrolysis, acidogenesis and methanogenesis (Cohen et al., 1982). In another study, glucose with potassium acetate mixture as organic substrate was used to increase the number of
the granules and resulted in more than 97% COD removal efficiency (Kalyuzhnyi et al., 1996). Micro- and macronutrient supplementation were found to be very effective in reducing the startup period and achieving high COD removal efficiency. Ca2+ at con-centrations from 150 to 300 mg L-1 enhanced the bio-mass accumulation and granulation process in UASB reactors (Boonsawang et al., 2008). Macronutrients such as nitrogen, potassium, phosphorus and magne-sium are required for activation of microorganisms. Micro-nutrients such as nickel, cobalt and iron are known for their role as biochemical cofactors for methane production (Speece, 1996). So it is possible that supplementation of macro- and micronutrients enhances the organic matter degradation during anaerobic digestion. The division of biodegradable fractions (Fb) was first introduced to explain the oxygen demand in wastewater treatment systems (Dold et al., 1986). Parameters like Fb and the sub-strate uptake rate can be considered as wastewater parameters for evaluating treatment efficiency during reactor start-up. These biodegradable fractions are readily accessible as molecules such as glucose and acetate (Verstraete, 2005). In untreated MWW these fractions are normally found to be greater than 0.9 and should be below 0.4 after biological treatment.
There is no doubt that the UASB reactor is gain-ing fame over the past decade, but there still are few researches that explore a reduction of the start-up time. Some reasons for this can be ascribed to a lack of information on selection of sludge, kinetics in-volved during start-up of low and high strength wastewater treatment. Environmental factors can also affect process kinetics and substrate removal (Singh et al., 1999). The UASB reactor is a suitable low cost wastewater treatment system in developing countries. UASB is an attractive option which com-bines simple design and low operating cost with efficient removal of pollutants. Many developing countries are choosing anaerobic processes for their domestic wastewater rather than aerobic treatment processes due to technical simplicity and the small
quantity of sludge production. Furthermore, inor-ganic components like NH4+ are not reduced to accept-able limits. Therefore additional integrated treatment is preferable where nutrients removal is required.
The main objectives of the present study were to shorten the start-up time of COD removal efficiency by addition of different substrates (glucose and SNI). Secondly, to treat municipal mixed industrial waste-water by an advanced oxidation process (AOP) to polish the UASB effluent.
MATERIALS AND METHODS
Start-Up of UASB Reactor
The whole treatment process was performed in the laboratory where the temperature varied from 25 ºC – 35 ºC over two months. Both reactor and mix-ing tank were connected with tubes to transfer the liquid. Two UASB reactors were constructed with 5 mm thick transparent acrylic material with inner diameter of 11.7 cm, total height 43.5 cm. The total volume of each reactor was 4.6 L with a working volume of 4.4 L and the effluent was collected from 36.5 cm in height. The reactor had five ports; three on the left side of the reactor were used for effluent collection and recycling; the other port on the right side was used for influent feed. The higher port was left for gas collection. Reactor parameters are sum-marized in Table 1.
Two liters of sludge was collected from a local domestic septic tank for seeding the UASB reactor (Figure 1).
Both reactors were fed with glucose for an initial 14 days; from the 15th day reactor I was shifted to SNI (stage II) containing macro- and micro-nutrients (SNI) (Tables 2 and 3) to increase the desired popu-lation of microorganisms. The control reactor (reac-tor II) continued the feeding with glucose solution for 45 days as a control. Glucose and SNI solutions were prepared and adjusted to pH 7.
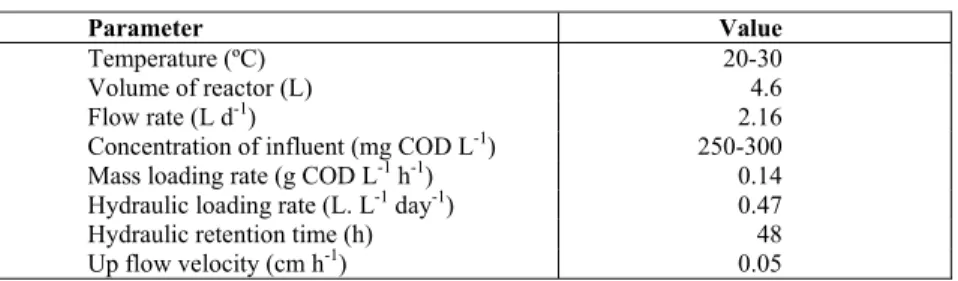
Table 1: UASB reactor parameters.
Parameter Value
Temperature (ºC) 20-30
Volume of reactor (L) 4.6
Flow rate (L d-1) 2.16
Concentration of influent (mg COD L-1) 250-300
Mass loading rate (g COD L-1 h-1) 0.14
Hydraulic loading rate (L. L-1 day-1) 0.47
Hydraulic retention time (h) 48
UASB Effluent
Treatment with waste H2O240%
Treated effluent Gas collector
Recycle
Stand pipe
Influent
P2 P1
UASB Effluent
Treatment with waste H2O240%
Treated effluent Gas collector
Recycle
Stand pipe
Influent
P2 P1
Figure 1: Design of the UASB, P1= peristaltic feed pump, P2 = peristaltic recycle pump.
Table 2: Composition of synthetic influent (SNI).
Synthetic influent Concentration
NaHCO3 1g L-1
Trace element solution 1ml L-1
MgCl2 1g L-1
KH2PO4 1g L-1
(NH4)2SO4 0.24g L-1
Table 3: Components of the trace element solution.
Components Conc. (g L-1)
Components Conc. (gL-1)
Components Conc. (g L-1)
Na2-EDTA 5 FeCl2⋅4H2O 3.58 CoCl2⋅6H2O 0.5
NaOH 11 MnCl2⋅2H2O 2.5 (NH4)6Mo7O244H2O 0.5
CaCl2⋅2H2O 7.34 ZnCl2 1.06 CuCl2⋅2H2O 0.14
The reactor was operated in a continuous mode and, after 39 days, the HRT was reduced from 48 to 24 hr with the same loading rate to see the effect of macro- and micro-nutrients. After achieving a stable COD removal of 99.9%, this reactor was used to treat municipal wastewater. In a previous investiga-tion by Subramanyam and Mishra (2007), the reactor was operated with glucose at concentrations of 100 to 1000 mg L-1 with 8 hrs HRT and the removal effi-ciency was 95% when microbial seed was collected from a fully efficient UASB plant.
Determination of the Substrate Uptake Rate, Bio-degradable Fractions and Growth Yield
The parameters substrate uptake rate and biode-gradable fractions were determined after fitting the experimental data with the following equations.
(
S Se)
U.X
ο−
= θ (1)
5
BOD Fb
0.65 COD
= × (2)
o e
o
S S
E 100
S ⎛ − ⎞ =⎜ ⎟×
⎝ ⎠ (3)
5
BOD bCOD
Fb
0.65 COD COD
⎛ ⎞
=⎜ ⎟=
×
⎝ ⎠ (4)
The mass loading rate and hydraulic loading rate were calculated as follows:
Q Hydraulic loading rate
A
= (5)
where flow rate and volume of the reactor are indi-cated by Q and V respectively.
o org
QS L
V
= (6)
Lorg= mass loading rate, So was taken as 300 mg L-1. The up-flow velocity was calculated by using the equation:
Q Up-flow velocity
A
= (7)
where ‘A’ is area of the reactor.
Analytical Procedures
All the analytical procedures were adopted from the standard methods for water and wastewater analysis (APHA, 2005). Wastewater samples were analyzed prior to and after the UASB and AOP treatments. COD was determined by the closed re-flux colorimetric method using a digester (HACH-LTG 082.99.40001), (APHA, 2005). The sample, di-gestion solution and sulphuric acid were digested in vials for two hours at 150 °C. After digestion, ab-sorbance was measured at the wavelength of 605 nm in a spectrophotometer (Lovibond tintometer GMBH, 44287 Dortmund). The pH was measured with a pH meter (HANNA, HI–991003) immediately after col-lection without stirring to prevent loss of CO2 from the sample; such losses may cause changes in pH. The H2O2 was collected from an industrial process after its use in a Tetra Pak® machine. The H2O2 con-centration was measured by a hydrometer according to the procedure given by Tetra Pak® manual (Tetra Pak, 2008). For the total Kjeldahl nitrogen, including organic nitrogen and ammonia nitrogen, the semi-micro-Kjeldahl digestion method (4500-Norg) was performed for 1-2hr at 200 and 300 ºC, followed by distillation to obtain the sum of organic and ammonia nitrogen. For NO3and NO2 determination the WAGSTECH kit was used. Granule size was measured by sieving procedures with mesh sizes of 2, 0.7, 0.5 and 0.2 mm placed vertically on top of each other.
RESULTS AND DISCUSSIONS
Effect of Glucose During the UASB Start-Up Period
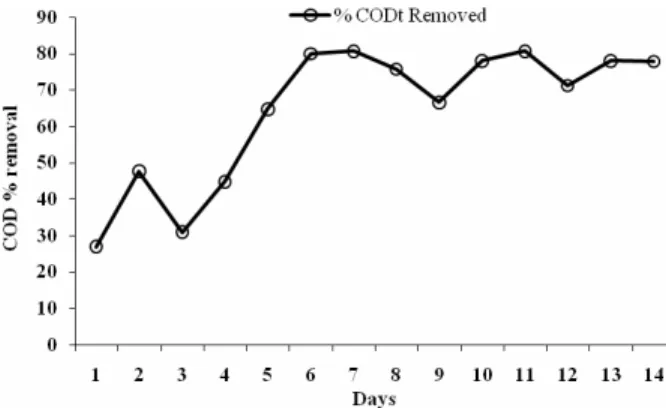
It was observed that, when only glucose was added as nutrient, reactor pH ranged between 7 - 7.4 during 1-6th days and decreased from 7.3 to 6.7 during days 6th–14th. The effluent pH remained higher than the influent pH until day 6 and, after 6thday, it dropped very sharply and remained below the influent value on day 14 (Figure 2) due to fermentation of glucose to acetate. Glucose served as a better carbon source for active biomass, which was easily biodegradable to form acetate. Therefore, the removal percentage of COD during the first five days of feeding with glu-cose were lower than 70%, but from the 6th day, as microbial growth increased, the removal efficiency increased to 80% (Figure 3), in accordance with the finding of Wang et al. (2014), who found that when glucose was added to the anaerobic reactor from day 105 to day 138, the total COD removal rate was increased from 23.93% to 85.71%.
Figure 2: pHi (influent), pHe (effluent) comparison during start-up of the UASB with glucose.
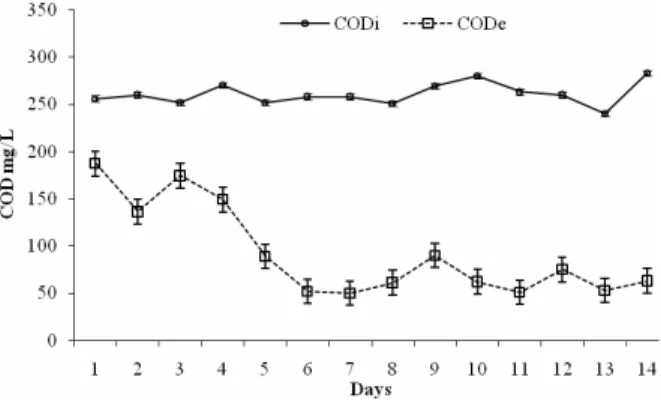
In order to check the reactor efficiency, effluent COD was compared with influent COD. In Figure 4 effluent COD decreased from 250 to 50 mg L-1 dur-ing the first 5 days and after six days it remained almost the same. In the study by Subramanyam and Mishra (2007), catechol was successfully mineral-ized in a UASB reactor in which microbial granula-tion was achieved with only glucose as the substrate. The reactor showed 95% COD removal efficiency. In another study by Majumder and Gupta (2007), sodium formate, sodium propionate, glucose and methanol were used separately as four different car-bon sources in the feed as co-substrate. Methanol was found to be the best carbon source, showing 95% 2-chlorophenol and 81.1% 2,4-dichlorophenol removals. In another study by Zhou et al. (2006), a UASB reactor was fed with three kinds of different substrates, glucose, skim milk and mixed volatile fatty acids (VFAs). Under mesophillic conditions at pH 7.4 and glucose substrate, 90% COD removal efficiency was achieved.
Figure 4: Comparison between CODi and CODe during start-up of the UASB with glucose.
In contrast, another study by Eng et al. (1986) used shock loads of sucrose in a lab-scale UASB reactor, treating diluted landfill leachate. Addition of shock loads of 10 g L-1 sucrose and also large amounts of volatile fatty acids in diluted leachate caused the pH value of the reactor effluent to drop from 7.2 to 4.7, which inhibited methanogenesis.
Not only did organic substrates successfully remove COD, but inorganic components such as zero-valent iron were also successful in COD reduction. Liu et al. (2011) demonstrated that when a voltage of 1.4 V was supplied to the zero-valent iron bed, the COD removal efficiency increased to 90% and the granule size reached up to 696 mm within 38 days.
Effect of SNI During the UASB Start-Up Period
During the second stage start-up process where SNI was used in same reactor, lower pH was ob-served in the beginning due to glucose conversion to acid as indicated in Figure 5 and gradually moves towards neutral and slightly alkaline pH.
By the addition of SNI it was clear from Figure 6 that COD removal reached more than 97% and re-mained until the end. Comparing glucose and SNI (Figs. 3 & 6) during start-up showed that using glu-cose in the influent removed 70% of the COD. After the 14th day, further addition of SNI in the influent gave COD removal > 97% and this maximum effi-ciency at 48 h HRT was changed to 24 h after 39 days. After 45 days the COD was below the detec-tion limit. Glucose in synthetic wastewater increased the specific methanogenic activity (Vadlani and Ramachandran, 2008) which helped to decrease the COD. Many studies have mentioned that UASB digesters need to be inoculated with sludge for full reactor efficiency. Without using seed culture, start-up of the reactor was considered to be feasible after 6 – 12 weeks at a HRT of 6 h and temperature above 20 ºC (Lettinga et al., 1993).
Figure 5: pHi and pHe comparison for SNI used for start-up.
58% total COD removal was reached at a tem-perature of 15 ºC and HRT of 11 h for 120 days by Alvarez et al. (2006). Kalogo et al. (2001a) and Kalogo and M’Bassiguie (2001b) achieved a removal effi-ciency of up to 65% of COD in a self-inoculated reactor treating domestic wastewater. In the present study it was observed that septic tank sludge was also effective to achieve full efficiency in 32 days when glucose was added in the first stage and SNI during the second stage with full efficiency of 99%. The key role of these macro- and micronutrients was to contribute to the synthesis of protein, cell wall permeability and new cell growth. In the study by Xu
et al. (2005), when single micronutrient zero-valence
Fe was used in a UASB reactor during the start-up time, it improved the COD removal efficiency up to 21%. Predominance of active biomass was also im-portant during start-up, which reduced the start time from 50 days to 30 days when seed sludge was taken from distillery effluent (Vadlani and Ramachandran, 2008).
Comparison of influent and effluent COD (Figure 7) shows a difference of COD concentration in the range of 300 – 50 mg L-1 during the second stage with SNI substrate.
C
O
D
(
m
g
. L
-1)
C
O
D
(
m
g
. L
-1)
Figure 7: Comparison of CODi and CODe from the fifteenth day with SNI.
Substrate Uptake Rate During Start-Up with Glu-cose and SNI
During the initial four days, the substrate uptake rate was lower and effluent COD was higher, which gradually start decreasing (Figure 8). From the 5th day substrate uptake increased and reached a maxi-mum level of 80% on the 8th day. During four days due to insufficient active biomass, the substrate up-take rate was low.
Addition of nutrients helped to increase the active biomass. Higher active biomass results in higher COD removal rate. With continuous feed of substrate at the same flow rate and concentration, non-active
biomass was washed out and active biomass in-creased and accumulated inside the reactor. The spe-cific uptake rate was calculated from volatile sus-pended solids (VSS), HRT and the reactor volume. The substrate uptake rate was increased after the 4th and 30th days with glucose and SNI, respectively.
Figure 8: CODe and substrate uptake rate with glucose. It was observed that affinity with the substrate was very important for the maximum COD removal efficiency and to shorten the start-up period for the maximum COD removal rate. Typically bacteria with high substrate affinity are found to be less efficient than those having low substrate affinity (Verstraete, 2005). Anaerobic species in the reactor have high affinity with glucose (stage I), so a lower COD re-moval rate of 80% was observed, while with SNI it was 99%. After 45 days, the reactor reached its full efficiency with continuous addition of SNI (Figure 9). The maximum COD removal efficiency of 99.9% with SNI was found on day 33. The significant nega-tive correlation of r = -0.7, n = 45 between substrate uptake rate and COD value was found, which indi-cates that, as the substrate was utilized, COD de-creased. Initially slow uptake rate of a specific sub-strate utilizing bacterial species was associated with a delay in maximum COD removal.
In the control reactor II it was observed that glu-cose alone was not enough to reach maximum COD removal efficiency. Macro- and micro-nutrients were used in two phases to stimulate the UASB reactor, clearly indicating that nutrients are essential for suc-cessful removal of COD.
Biodegradable Fraction Analysis During Substrate Uptake
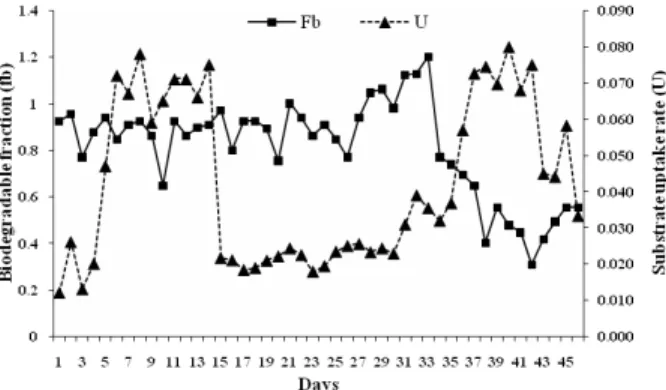
A clear representation in Fig. 10 showed that the initially biodegradable fraction (Fb) remained the same from the 1st to 30th days and then started to decrease on day 31, in accordance with the reduction of COD. A non-significant positive correlation (r = 0.4, n = 45) was found between the COD value and Fb. Initialy higher Fb might be due to the lower number of specific microorganisms, which increased with the paasge of time and this may be the reason that incomplete degradation of substrate results in higher Fb in the effluent. After 30 days when growth of micro-organisms in the reactor reached the maximum number, there was more degradation of substrate and less Fb (0.4) in the effluent.
Figure 10: Glucose and SNI effects on biodegrad-able fraction and substrate uptake.
During the initial three days, the glucose uptake rate was less and Fb was high, because effluent may have Fb from influent and sludge washing. It was indicated that organic matter present in the effluent was reduced as the uptake rate of biomass increased; a non-significant negative correlation (r = - 0.47, n = 45) was found between Fb and the substrate uptake rate. Jhung and Choi (1995) found that biodegradation and granulation influenced more with used waste than with the reactor itself. After the 6th day the substrate uptake rate remained the same from 0.07 – 0.08 per day. The decrease in Fb was also due to the granulation and settlement of organic solids.
Treatment of Municipal Wastewater After Start-Up of the UASB
After 46 days when the reactor reached its maxi-mum COD removal efficiency with SNI, it was shifted to municipal wastewater treatment. Municipal wastewater COD ranged from 250 to 350 mg L-1 during 47 to 54 days. The HRT was adjusted at 48, 24, 12 and 6 hours after 7 days working at each HRT. From days 48 to 54, the COD was below 50 mg L-1. On day 47 a high effluent COD of 78 mg L-1 was observed and might be due to municipal influent, but later on it decreased to 50 mg L-1 up to day 54. The HRT was adjusted to 24 h from days 55 to 61. When the HRT was changed the effluent COD was 157 mg L-1 and the next day it started to reduce until day 60, where the minimum COD of 30 mg L-1 was observed (Fig. 11). On day 61 the HRT was reduced again to 12 h and there was again a slight rise in COD and on day 62 it was found to be 80 mg L-1. The same be-havior was observed after day 68 when there was again a small rise in effluent COD. It was observed that the COD of municipal wastewater was lower than 350 mg L-1 during our whole experiment from days 47 to 74. During this experiment unexpected heavy rainfall caused dilution of the wastewater. Despite the small granule (0.5 mm) formation during this time period, the reactor efficiency was not af-fected to an unacceptable level. During this time period there was no excess sludge produced to re-move from the reactor. The biogas was not analyzed due to the unavailability of the equipment in the lab, but release of gas bubbles was observed in a water jar connected to the top of the UASB reactor. This indicates that methanogenic bacteria were active during phase II. During the last seven days of experiment at 6 h HRT, the COD was between 60-70 mg L-1.
Post Treatment of UASB Effluent with Waste H2O2
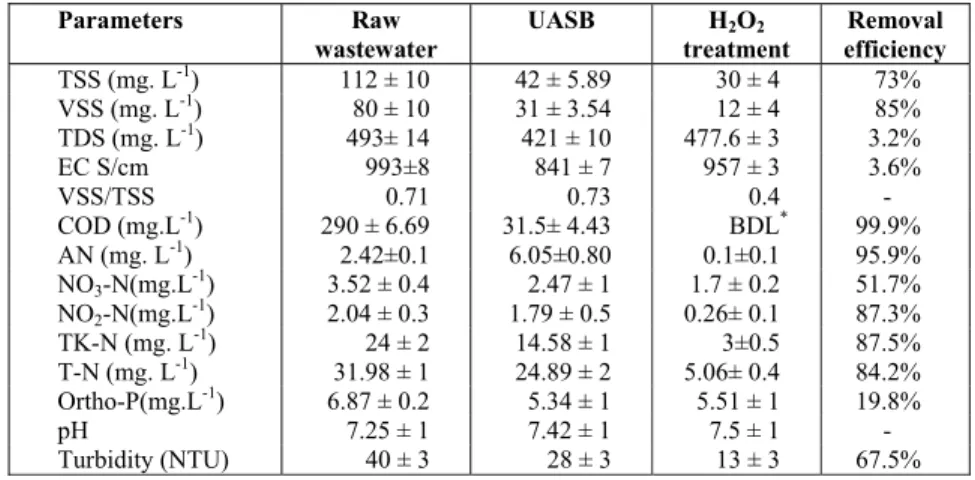
UASB effluent was treated with 40% waste H2O2 in a further step. A 2 ml L-1 dose of hydrgen peroxide was found to be very effective and total nitrogen re-moval of 84% was achieved with combined treat-ments of UASB and AOP. The removals of other pa-rameters like TSS, COD, TN and turbidity were 73%, 99%, 84% and 67.5% respectively. Ortho-P was not removed to an acceptable level of 2 mg L-1 (Table 4).
In the H2O2 treatment step, conductivity and TDS were not significantly removed, but both were below National Environmental Quality Standards (NEQS) (Table 5). The COD was below the standard limits. After UASB treatment the VSS/TSS ratio was increased from 0.71 to 0.73 and a drastic change of 0.4 was observed with AOP treatment. This was due to the bactericidal property of hydrogen peroxide, which kills most of the microbes present in the effluent and oxidaizes cell debris. Using hydrogen
peroxide as post-treatment was very attractive due to the COD removal of 99%. Although ammonia was detected (2.42 mg L-1) in the raw water sample, after UASB treatment its concentration was increased to 6 mg L-1 (Table 4). The increase of ammonia may be due to ammonification process inside the reactor and, after chemical treatment with hydrogen peroxide, decreased drastically (i.e., 0.1 mg L-1). This showed that post-treatment with hydrogen peroxide was very effective to reduce total nitrogen to an acceptable local standard.
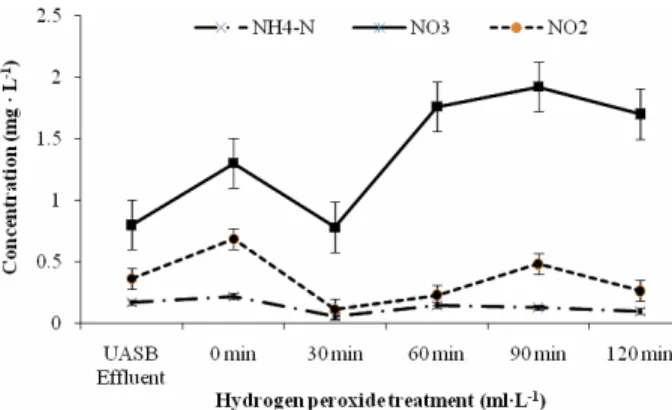
Ammonium nitrogen, which is toxic to aquatic species, was oxidized with H2O2. Table 6 showed that in UASB effluent the ammonium nitrogen concentra-tion reached 0.1 from 0.22 mg L-1 during 120 min. Nitrate concentration was 1.3 mg L-1 at 0 min and, after 30 min of mixing in the presence of hydrogen peroxide, its concentration decreased to 0.78 mg L-1. After 120 min of continuous mixing nitrate reached 1.7 mg L-1.
Table 4: Average characteristics of raw MWW and effluent at various treatment steps.
Parameters Raw wastewater
UASB H2O2
treatment
Removal efficiency
TSS (mg. L-1) 112 ± 10 42 ± 5.89 30 ± 4 73%
VSS (mg. L-1) 80 ± 10 31 ± 3.54 12 ± 4 85%
TDS (mg. L-1) 493± 14 421 ± 10 477.6 ± 3 3.2%
EC S/cm 993±8 841 ± 7 957 ± 3 3.6%
VSS/TSS 0.71 0.73 0.4 -
COD (mg.L-1) 290 ± 6.69 31.5± 4.43 BDL* 99.9%
AN (mg. L-1) 2.42±0.1 6.05±0.80 0.1±0.1 95.9%
NO3-N(mg.L-1) 3.52 ± 0.4 2.47 ± 1 1.7 ± 0.2 51.7%
NO2-N(mg.L-1) 2.04 ± 0.3 1.79 ± 0.5 0.26± 0.1 87.3%
TK-N (mg. L-1) 24 ± 2 14.58 ± 1 3±0.5 87.5%
T-N (mg. L-1) 31.98 ± 1 24.89 ± 2 5.06± 0.4 84.2%
Ortho-P(mg.L-1) 6.87 ± 0.2 5.34 ± 1 5.51 ± 1 19.8%
pH 7.25 ± 1 7.42 ± 1 7.5 ± 1 -
Turbidity (NTU) 40 ± 3 28 ± 3 13 ± 3 67.5%
*BDL = Below Detection Limit, TSS = Total Suspended Solids, VSS = Volatile Suspended Solids, TDS = Total Dissolved Solids, EC = Electrical Conductivity, AN= Ammonium Nitrogen, TK-N = Total Kjeldahl-Nitrogen.
Table 5: NEQ Standards for effluent discharge.
COD BOD Kjel-N NH4+ NO3- PO4- TN SS Working Goal
mg L-1 125 25 <10 1 1 2 15 35
Table 6: UASB effluent treatment with H2O2 at a dose of 2 ml L-1.
Time NH4
(mg.L-1)
NO3
(mg.L-1)
NO2
(mg.L-1)
TDS (mg.L-1)
COD (mg.L-1)
Temp °C
0 min 0.22 1.3 0.68 487 31 30.7
30 min 0.06 0.78 0.11 484 31 31.4
60 min 0.15 1.76 0.23 473 20 31.3
90 min 0.13 1.92 0.48 460 BDL* 30.6
120 min 0.1 1.7 0.26 455.5 BDL* 30.8
It seemed that nitrification was more dominant than denitrification. The hydroxyl redicals released from the dissociation of H2O2 might have caused the oxidation of ammonium to nitrate.
¯
4 2 3 2
NH ++O → NO +7H
Some chemicals have been already used for nitrification and denitrification processes. Sabzalim (2006) reported denitrification of nitrate using Zn and sulfamic acid treating ground water.
2
3 2 3 2 4 2
NO−+Zn H+ ++H NSO H→N +SO−−+Zn ++2H O
During anaerobic treatment inorganic compo-nents such as NH4+ are removed to a limited extent. Many additional systems have been proposed to re-move NH4+ from UASB effluent. Zeolite and duck-weed plants were used to reduce the NH4+ from UASB effluent in two different studies (Aiyuk et al., 2004; El-Shafai, 2007). Treatment efficiency of 99% was achieved with zeolite, but long recharging time was required (Aiyuk et al., 2004). Insignificant change was observed in TDS, but COD was decreased further to 0 mg L-1 from 31 mg L-1. One degree increase in temperature 30.7 to 31.4 ºC was observed after 30 min. This might be due to the exothermic oxidation of remaining pollutants. After complete oxidation of pollutants, when COD reached zero, the temperature reached 30.8 °C.
Overall total nitrogen removal was 84% with 5 mg L-1 effluent concentration; after peroxide treat-ment the value was below the Pakistan NEQS per-missible limit. In Fig. 12 ammonia, nitrate and nitrite were compared during reaction with hydrogen per-oxide for 120 min. After 30 min maximum decrease of nitrate, nitrite and ammonia was observed. Further mixing showed a slight decrease in ammonia and rise in nitrate due to nitrification of ammonia.
Figure 12: Effect on ammonium, nitrate and nitrite after treating UASB effluent with H2O2.
DifferentHRT, i.e., 48, 24, 12 and 6 h were tested to check the efficiency of COD removal, after com-pletion of the start-up period in four weeks. It was observed that HRT below 24 h disturbed the settled sludge in the reactor. Therefore, no obvious granula-tion occurred at low HRT for five weeks, but granule size was less than 0.5 mm. Increase in uplifting ve-locity of influent greater than 0.1 cm h-1 resulted in sludge bed disturbance. It took more time to develop granules at high uplifting velocity. Average COD reduced to 31.5 mg L-1 at 48 h HRT with 99% re-moval efficiency. No change was observed in tur-bidity, TDS, conductivity and pH. Many other re-searchers have worked to see the effect on treatment efficiency at lowest HRT. Mahmood (2007) ob-served, at 24 h HRT, 85% nitrate removal efficiency with zero ammonia in effluent from UASB where sludge was collected from an anaerobic methano-genic reactor. In the present work, 85% total nitro-gen, 95% ammonia and 83% COD removals were observed at HRT 24 h where inoculum was collected from a domestic septic tank. In contrast, Chelliapan
et al. (2011) observed a 94% COD removal at 4 days
HRT.
Many researchers have indicated that maximum COD removal efficiency related with granule forma-tion takes three months (Yu et al., 2001; Zhou et al., 2006; Kalogo et al., 2001). As indicated in Table 7, during start-up of the UASB reactor the maximum removal efficiency of 95% was observed with cattle manure as inoculums (Akila and Chandra, 2007). It is clear from the present research that domestic sep-tic tank sludge achieved the maximum COD removal efficiency of 85-99% in only six weeks at HRT of 24-48 h. It is clear that domestic septic tank sludge was very effective for removal of COD from MWW. Granulation was not included in this part of the study as municipal waste water was mixed with industrial waste water.
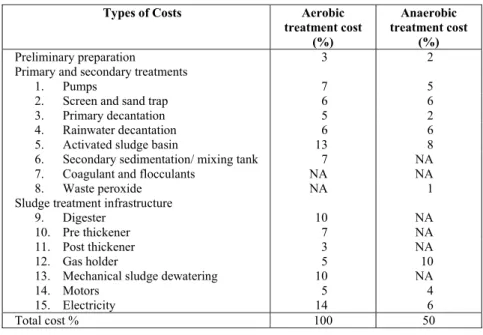
Economic Aspects
The total cost calculation showed that an inte-grated UASB system with post-treatment of hydro-gen peroxide has approximately 50% less cost than conventional aerobic wastewater treatment.
Table 7: Comparison of UASB HRT start-up with different inoculums.
HRT Inoculums source
COD Removal efficiency
Reference
6 d Self inoculation 84% Bodkhe, 2009
24 h Granular sludge 86% Ramakrishnan, 2007
24 h Cattle manure 90-95% Akila, 2007
10-11h Digested sludge 63-73% Alvarez et al., 2006
3 h Digested sludge 90-92% Singh et al., 1999
48h Domestic septic tank sludge 99% Present study
Table 8: Economical analysis of various treatment options for MWW.
Types of Costs Aerobic treatment cost
(%)
Anaerobic treatment cost
(%)
Preliminary preparation 3 2
Primary and secondary treatments
1. Pumps 7 5
2. Screen and sand trap 6 6
3. Primary decantation 5 2
4. Rainwater decantation 6 6
5. Activated sludge basin 13 8
6. Secondary sedimentation/ mixing tank 7 NA
7. Coagulant and flocculants NA NA
8. Waste peroxide NA 1
Sludge treatment infrastructure
9. Digester 10 NA
10. Pre thickener 7 NA
11. Post thickener 3 NA
12. Gas holder 5 10
13. Mechanical sludge dewatering 10 NA
14. Motors 5 4
15. Electricity 14 6
Total cost % 100 50
NA = Not Applicable
treatment cost. An average total investment cost is about US$100 per capita in which half of the cost is for building construction and the remaining for elec-trical and mechanical devices, which might vary considerably. The total cost for one year of treatment is approximately US$40 on the basis of information given in Table 8 assuming that one inhabitant pro-duces 180 liters of wastewater per day and a treat-ment cost range around approximately 0.5 US$/m3.
CONCLUSIONS
It is concluded from the present research that a self-inoculated UASB reactor with septic tank sludge achieved the maximum COD removal efficiency in 32 days with a two-step substrates feeding with glu-cose and SNI. Microbes in the reactor started to util-ize glucose initially as readily available carbon source and after addition of SNI reactor efficiency was increased and reached more than 97%. An opti-mized dose of 2 ml L-1 of 40% H2O2 was used to
treat UASB effluent. This proposed system was found to be very successful in removal of 99% COD, 67% turbidity, 95% ammonium, 85% VSS and 84% TN at low investment cost.
ACKNOWLEDGEMENT
This research work was completely funded by COMSATS research grant program, Islamabad.
NOMENCLATURE
AOPs Advanced Oxidation Processes HRT Hydraulic Retention Time H2O2 hydrogen peroxide
COD Chemical Oxygen Demand BOD5 Biochemical Oxygen Demand
NEQS National Environmental Quality Standards
REFERENCES
Akila, G. and Chandra, T. S., Performance of a UASB reactor treating synthetic wastewater at low-tem-perature using cold-adapted seed slurry. Process Biochem., 42(3), 466-471 (2007).
Alvarez, J. A., Ruiz, I., Gomez, M., Presas, J. and Soto, M., Start-up alternatives and performance of a UASB pilot plant treating diluted municipal wastewater at low temperature. Bioresource Technol., 97, 1640-1649 (2006).
Aiyuk, S., Amoako, J., Raskin, L., Vanhaandel, A. and Verstraete, W., Removal of carbon and nutri-ents from domestic wastewater using a low in-vestment. integrated treatment concept, Water Res. 38, 3031-3042 (2004).
APHA, American Public Health Association. Inc., Standard methods for the examination of water and wastewater (21st Ed.), New York, USA (2005). Bodkhe, S. Y., A modified anaerobic baffled reactor for municipal wastewater treatment. J. Env. Mang., 90(8), 2488-2493 (2009).
Boonsawang, P., Laeh, S. and Intrasungkha, N., En-hancement of sludge granulation in anaerobic treat-ment of concentrated latex wastewater. Songklana-karin, J. Sci. Technol., 30(1), 111-119 (2008). Chelliapan, S., Wilby, T. and Sallis, P. J., Effect of
hydraulic retention time on up-flow anaerobic stage reactor performance at constant loading in the presence of antibiotic tylosin. Braz. J. Chem. Eng., 28(1), 51-61 (2011).
Cohen, A., Breure, A., van Andel, J. G. and van Deursen, A., Influence of phase separation on the anaerobic digestion of glucose-II: Stability and kinetic response to shock loadings. Water Sci. Technol., 57(5), 687-692 (1982).
Dold, P. L., Bagg, W. K. and Marais, G. V. R., Measurement of the readily biodegradable COD fraction (Sbs) in municipal wastewater by ultrafil-tration UCT. Report No. W57. Department of Civil Engineering, University of Cape Town, Ronde-bosh, 7700, South Africa (1986).
Eng, S. C., Fernandes, X. A. and Paskins, A. R., Bio-chemical effects of administering shock loads of sucrose to a laboratory-scale anaerobic (UASB) effluent treatment plant. Water Res., 20, 789-794 (1986).
Jhung, J. K. and Choi, E., A comparative study of UASB and anaerobic fixed film reactors with de-velopment of sludge granulation. Water Res., 29, 271-277 (1995).
Kalogo, Y., Mbouche, J. H. and Verstraete, W., Physical and biological performance of self
in-oculated UASB reactor treating raw domestic sewage. J. Environ. Eng., 127(2), 179-183 (2001a). Kalogo, Y., M’bassiguie, A. and Verstraete, W.,
Enhancing the start-up of a USB reactor treating domestic wastewater by adding water extract of
Moringa oleifer seeds. Appl. Microbiol.
Biotech-nol., 55, 644-651 (2001b).
Kalyuzhnyi, S. V., Sklyar, V. I., Davlyatshina, M. A., Parshina, S. N., Simankova, M. V., Kostrikina, N. A. and Nozhevnikova, A. N., Organic removal and microbiological features of UASB-reactor under various organic loading rates. Bioresour. Technol., 55, 47-54 (1996).
Ksibi, M., Chemical oxidation with hydrogen per-oxide for domestic wastewater treatment. Chemi-cal Engineering Journal, 119, 161-165 (2006). Lettinga, G., De Man, A., van der Last, A. R. M.,
Wiegant, W., van Knippenberg, K., Fijns, J. and van Buuren, J. C. L., Anaerobic treatment of do-mestic sewage and wastewater. Water Sci. Technol., 27(9), 67-73 (1993).
Liu, Y., Zhang, Y., Quan, X., Chen, S. and Zhao, H., Applying an electric field in built-in zero valent iron- anaerobic reactor for enhancement of sludge granulation. Water Res., 45(3), 1258-1266 (2011). Mahmood, Q., Process performance, optimization
and microbiology of anoxic sulfide biooxidation using nitrite as electron acceptor. PhD Disserta-tion, pp. 44-69 (2007).
Majumder, P. S and Gupta, S. K., Effect of carbon sources and shock loading on the removal of chlorophenols in sequential anaerobic-aerobic re-actors. Bioresour. Technol., 99, 2930-2937 (2007). Mathiewu, S. and Etienne, P., Estimation of
waste-water biodegradable COD fractions by combining respirometric experiments in various So/XO ra-tios. Water Res., 34(4), 1233-1246 (2000). Singh, R. P., Kumar, S. and Ojha, C. S. P., Nutrient
requirement for UASB process: A review. Bio-chem. Eng. J., 3, 35-54 (1999).
Speece, R. E., In: Anaerobic Biotechnology for In-dustrial Wastewater. Archae Press, Nashville, Tenn. pp. 31-57 (1996).
Subramanyam, R. and Mishra, I. M., Biodegradation of catechol (2-hydroxy phenol) bearing waste-water in an UASB reactor. Chemosph., 69, 816-824 (2007).
Tetra Pak., Technical Data Manual Hydrogen Per-oxide. Doc. No.OM-2771726-0101, pp. 8-9 (2008). Vadlani, P. V. and Ramachandran, K. B., Evaluation
Verstraete, W., In: Environ. Biotech. Proc., pp. 1-30, Ghent University, Belgium (2005).
Wang, D., Ji, M. and Wang, C., The stimulating effects of the addition of glucose on denitrifi-cation and removal of recalcitrant organic compounds. Brazilian J. Chem. Eng., 31(1), 9-18 (2014).
Xu, G. R., Zhang, W. T. and Li, G. B., Adsorbent obtained from CEPT sludge in wastewater
chemi-cally enhanced treatment. Water Res., 39, 5175-5185 (2005).
Yu, H. Q., Tay, J. H. and Fang, H. H. P., The roles of calcium in sludge granulation during UASB re-actor start-up. Water Res., 35, 1052-1060 (2001). Zhou, W., Imai, T., Ukita, M., Sekine, M. and