The estimated magnitude of AIDS in Brazil:
a delay correction applied to cases
with lost dates
Estimativa da magnitude da AIDS no Brasil:
uma correção de atraso aplicada aos casos
com data perdida
1 Departamento de Matemática e Estatística, Universidade do Rio de Janeiro. Rua Frei Caneca 94, Rio de Janeiro, RJ 22270-000, Brasil. 2 Programa de Computação Científica, Fundação Oswaldo Cruz. Av. Brasil 4365, Antiga Residência Oficial, Rio de Janeiro, RJ 21045-900, Brasil.
[email protected] [email protected] 3 Instituto de Medicina Social, Universidade do Estado do Rio de Janeiro. Rua São Francisco Xavier 524, 7oandar, Bloco D, Rio de Janeiro, RJ 20559-900, Brasil.
Maria Tereza S. Barbosa 1,2 Claudio J. Struchiner 2,3
Abstract The number of HIV-infected people is an important measure of the magnitude of the AIDS epidemic in Brazil and allows for comparison with epidemic patterns in other countries. This quantity can be estimated from the number of reported AIDS cases, which in turn needs to be corrected for the distribution of reporting delays and under-recording of cases. These distribu-tions are unknown and must also be estimated from the recorded dates, which were missed to the Brazilian National AIDS registry. This paper estimates the number of AIDS cases diagnosed by imputing the lost information based on an estimate of the pattern in registration delay until 1996. We first fitted a non-stationary bivariate Poisson regression model to estimate the pattern in reporting delay. In the subsequent steps these models were applied to impute new data, thus replacing the missing information, and to estimate the magnitude of the AIDS epidemic in the country. Model estimates ranged from 36,000 to 50,000 AIDS cases diagnosed in Brazil and still unreported. Therefore, the epidemic was 20 to 30% greater than known from the available infor-mation as of February 1999. To be useful to health policy-makers, the surveillance system based on officially reported AIDS cases must be continuously improved.
Key words Acquired Immunodeficiency Syndrome; HIV; Surveillance
Resumo O número de pessoas infectadas pelo HIV é uma importante medida da magnitude da epidemia de AIDS no Brasil, e permite a comparação com o padrão epidêmico de outros países. Essa quantidade pode ser estimada a partir do número de casos notificados de AIDS, que neces-sita ser corrigido pela distribuição do atraso da notificação e pelas sub-notificações. Essas distri-buições são desconhecidas e devem ser estimadas a partir das datas registradas, que no Brasil fo-ram perdidas. Neste artigo, estima-se o número de diagnósticos de AIDS, imputando as informa-ções perdidas a partir da estimativa do padrão de atraso até 1996. Primeiro, ajustou-se uma re-gressão de Poisson bivariada para estimar o padrão de atraso, fazendo uma suposição de um atraso não estacionário. Nas etapas seguintes, estes modelos foram aplicados para imputar no-vos dados substituindo as informações perdidas e para estimar a magnitude da epidemia de AIDS no país. Os modelos estimaram que havia entre 36 mil e 50 mil casos de AIDS já diagnosti-cados e ainda não notifidiagnosti-cados. A epidemia era, portanto, de 20 a 30% maior do que a conhecida pelas informações disponíveis em fevereiro de 1999. Para ser útil aos que planejam as políticas de saúde, o sistema de vigilância que se baseia nas notificações oficiais de AIDS deve ser conti-nuamente melhorado.
Introduction
The AIDS epidemic in Brazil is monitored based on cases reported by the official surveillance system. Reporting is mandatory and is done by filling out a standard form. These data also help to plan the distribution of medicines, and to plan and evaluate preventive measures. It is thus indispensable to monitor the quality and consistency of existing information in such a complex and mutating epidemic. The HIV in-cubation period, already long since the begin-ning of the epidemic, was further increased by the introduction of combination anti-retroviral treatment. Since data published by the surveil-lance system refer to the number of infected individuals who have already developed AIDS, they tend to be even further from the actual number of HIV-infected individuals.
These data exclude not only individuals who are infected and asymptomatic but also cases that have never been reported (under-reporting) or those that will be reported late. To estimate the number of HIV-infected individuals based on the number of AIDS cases reported to the sur-veillance system, one needs an estimate of the number of AIDS cases at that moment, i.e., to correct for both reporting delays and estimated missing cases. Studies on under-reporting in Brazil are still limited to certain States of the country and certain periods of time and have utilized hospital or death records. They suggest under-reporting rates from 15% to 43.3% (Fer-reira & Portela, 1999; Lemos, 1998). To correct for reporting delay one must estimate the lag pattern, i.e., the distribution of time transpired between case diagnosis and reporting. Various methods have been applied to this estimate since the beginning of the AIDS epidemic. They assume that diagnosis and reporting dates are properly recorded, and many use these dates to compose time intervals for diagnosis and de-lay, besides making corrections based on the adjustment of log-linear models (Brookmeyer & Damiano, 1989; Brookmeyer & Liao, 1990; Harris, 1990; Zeger et al., 1989). With other types of approaches, Sellero et al. (1996) formulated the problem of estimating delay distribution as one of survival analysis, calculating the delay as a number of days, while Brookmeyer & Gail (1994) made suppositions about the change in reporting behavior over time, adjusting a log-logit model through diagnostic periods for each delay interval.
In delay corrections conducted for the Brazilian case, Barbosa & Struchiner (1997a, 1997b, 1998) used 88,349 cases reported as of September 1996, of which only 70% contained
the reporting date, and estimated the epidem-ic’s magnitude by both region and exposure category, making the supposition that the dates were missed randomly. They compared the results obtained when the delay was mea-sured in number of days and the correction performed on the basis of a survival model with those obtained from a Poisson regression when the cases were distributed in a contin-gency table formed by cross-analyzing semes-ter of diagnosis with number of semessemes-ters in the delay. In evaluating the results, the authors highlighted the need for a model that incorpo-rated the effect of the semester of diagnosis, since the reporting pattern could be affected by free distribution of combination anti-retroviral treatment.
According to these evaluations, in order to update the delay corrections and estimate the magnitude of the Brazilian epidemic, models were needed that considered the hypothesis of non-stationary delay. Nevertheless, due to a technical problem, and this time in non-ran-dom fashion, an even larger amount of case-re-porting data was lost from the database of the National Disease Reporting Information Sys-tem (SINAN). More recent studies have dis-cussed various aspects related to the effect of correcting reporting delay, when one considers the concrete situation of surveillance system data. Thus, Law & Kaldor (1997) propose to take into account the way in which time lag is measured, and Gebhardt et al. (1998) evaluate the effect of including non-stationarity in the models when comparing incidence in various countries. Becker & Kui (1997) analyzed the ef-fect of including AIDS data prior to the begin-ning of registration of reporting dates. Others have proposed that the analytical approach as-suming delay stationarity throughout the peri-od was responsible for distortions in estimates of AIDS cases in recent periods (Gebhardt et al., 1998; Harris, 1990; Lindsey, 1996).
An-other iteration was added to these values, lead-ing to the forecast magnitude of the epidemic in 1998.
Database and Epidemiological Bulletin
There are two principal sources of data in Brazil allowing one to infer the behavior of the AIDS epidemic. One source, the SINAN Database, in-volves primary data, while the other inin-volves secondary data: the Epidemiological Bulletins published regularly since the beginning of the epidemic and consisting of the periodical to-talization of data from the base by place of res-idence, State (including the Federal District), year of diagnosis, exposure category, age brack-et, sex, etc. The dates pertaining to the various events characterizing the epidemic (AIDS dis-ease, reporting, and death) are essential as a source of primary information and serve to construct various epidemiologically relevant measurements. This information allows us to establish retrospective cohorts that serve as a starting point to estimate, for example, distrib-ution of HIV incubation time, distribdistrib-ution of AIDS survival time, or distribution of reporting delay, necessary to correct the AIDS incidence at any specific moment. Making this correction means estimating the size of the HIV-infected cohorts, which are constituted based on the AIDS diagnosis and whose event of interest is the reporting date. With the lack of information concerning the reporting date that occurred
since 1997 in the SINAN Database, it was nec-essary to use data totalized by year of diagnosis and published in the Epidemiological Bulletins as an ancillary instrument to infer the cohorts’ behavior.
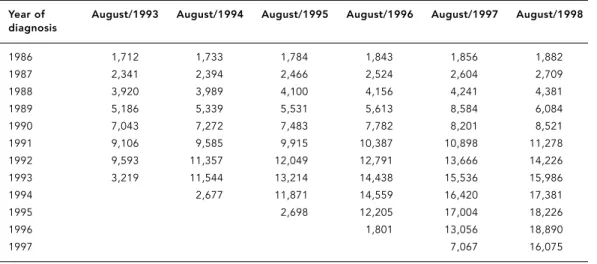
Table 1 describes the number of AIDS cases by year of diagnosis from 1986 to 1997 and published in the August Bulletins each year. These data demonstrate that the number of new reported cases increased from some two thousand in diagnostic year 1986 to 16 thou-sand in diagnostic year 1997. Note that since 1992 Brazil has used two different criteria to define an AIDS case. The so-called Rio de Ja-neiro/Caracas criterion is based on a scoring system for signs and symptoms, plus positive HIV serology. The second criterion is a modi-fied version of the definition proposed in 1988 by the Centers for Disease Control and Preven-tion (CDC) that included encephalopathy and the cachectic syndrome (CNDST/AIDS, 1994). This new criterion expands the range of dis-eases and may at least partially explain the in-crease in the number of cases. The data also il-lustrate the importance of delay correction. For example, the August 1994 Bulletin included some 11 thousand cases diagnosed in 1992 and 11.5 thousand diagnosed in 1993. By August 1998 these same figures had already increased to some 14 and 16 thousand cases, respective-ly, reflecting an epidemic with seven thousand cases more than published five years previous-ly, for these two diagnostic years alone. The im-plications for evaluating the impact of HIV
in-Table 1
AIDS cases according to year of diagnosis in the August 1993 to 1998 Bulletins.
Year of August/1993 August/1994 August/1995 August/1996 August/1997 August/1998
diagnosis
1986 1,712 1,733 1,784 1,843 1,856 1,882
1987 2,341 2,394 2,466 2,524 2,604 2,709
1988 3,920 3,989 4,100 4,156 4,241 4,381
1989 5,186 5,339 5,531 5,613 8,584 6,084
1990 7,043 7,272 7,483 7,782 8,201 8,521
1991 9,106 9,585 9,915 10,387 10,898 11,278
1992 9,593 11,357 12,049 12,791 13,666 14,226
1993 3,219 11,544 13,214 14,438 15,536 15,986
1994 2,677 11,871 14,559 16,420 17,381
1995 2,698 12,205 17,004 18,226
1996 1,801 13,056 18,890
fection, planning control measures, and esti-mating the epidemic’s magnitude are easy to perceive.
Presentation of the problem
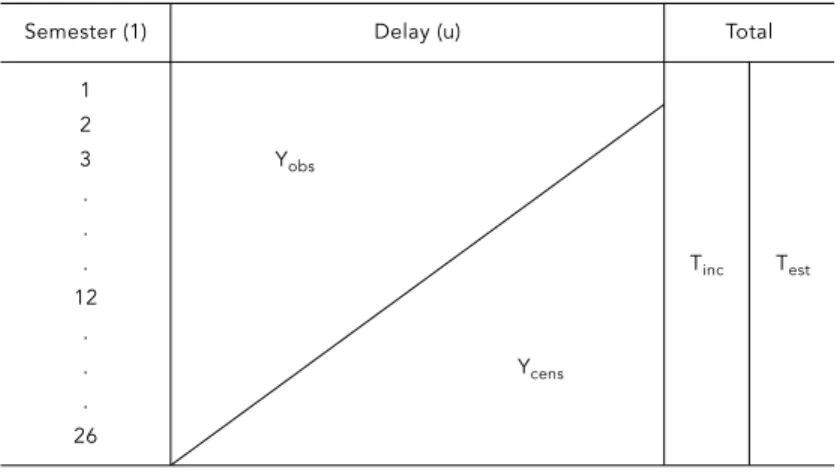
All AIDS cases diagnosed and already reported by December 1998 (Yobs) with their respective diagnosis and reporting dates constitute the complete database, necessary to conduct the delay correction. This database is not available due to the loss of reporting dates already re-ferred to. This database would allow one to form a contingency table, the dimensions of which would refer to the semester of diagnosis and the number of semesters in delay. This table is illustrated in Figure 1.
This table would have many empty cells (Ycens) due to cases still not reported because of the time lag since diagnosis (censure to the right). The objective of the reporting delay study was thus to estimate the AIDS cases al-ready diagnosed and still not reported in each year (Test), i.e., to estimate the empty cells in this table, revealing the magnitude of the AIDS epidemic based on the estimated marginals of the incomplete lines (Tinc). To conduct this es-timate, we simultaneously took into account the delay pattern and the incidence of diag-noses by semester. However, due to the miss of reporting dates beginning in June 1996, it was only possible to construct the table presented in Figure 2, where from the twenty-first semes-ter of observation onward (Ymiss) we lacked in-formation on the cases diagnosed by delay and thus where the reporting delay pattern was un-known, but where the number of cases report-ed and publishreport-ed in the Epidemiological Bul-letin gave us the total cases diagnosed per year of diagnosis (Tbul).
Methods
The methodological problem can be described as a statistical prediction based on censured and missing data. The magnitude of the AIDS epidemic in December 1998 was thus estimat-ed by data modeling and imputation in three phases:
• Phase 1: Using the data for diagnoses al-ready reported as of December 1995 and indi-cated in Part I of Figure 2 (Yobs), we sought a model that would estimate the unreported di-agnosed cases (Ycens), approaching them to the cases published in the February 1999 Bulletin with diagnosis prior to that date (Tbul).
• Phase 2: The model developed in the previ-ous phase was used to impute Part II of Figure 2 (Ymiss) and then to estimate the delay pattern from 1996 to 1998, excluding the estimates of censured cells (Ycens). This delay pattern was applied to the annual diagnoses already re-ported and published in the February 1999 Bulletin (Tbul). Thus, each cell Yijin the table was obtained by performing Yij= pij * Tj, where pij represents the proportion of diagnoses in year ireported with jsemesters of delay ob-tained by the model and Tjis the total diag-noses already reported.
• Phase 3: The same model was applied to the data generated in Phase 2, obtaining new para-meters, which were then used to estimate the AIDS cases already diagnosed and still not re-ported as of February 1999 (Test).
Suppositions for the model
The search for a model took into account the evaluations conducted in the estimates ob-tained by Barbosa & Struchiner (1998) when confronted with the reality obtained in the Epi-demiological Bulletins. The model was thus based on several premises:
• Models previously used in Brazil failed to capture the change in the epidemic’s behavior beginning in 1993 and thus underestimated the epidemic’s magnitude in recent years.
• Missing reporting dates prior to 1996 were presumed to be random.
• The supposition in previous corrections, i.e., that delay was negligible after four years, was untrue.
• Free distribution of combination antiretro-viral treatment altered reporting behavior.
Results
After adjusting various models proposed and studied by Lindsey (1996) and testing various transformations of the variables pertaining to delay and diagnosis time, two models were cho-sen. The first, a non-stationary model (Model 1) where, beginning in 1993, the delay interact-ed the reciprocal of diagnosis time cubinteract-ed with the logarithm of this same time:
λ(t,u) = αexp(β1t+ β2u)t β3u exp(β4u)
t3
Poisson distribution with parameter λ(t, u),
and thus a log-linear model was adjusted based on the GLM function of S-Plus (Statistical Sci-ence, 1993). However, there were indications that the case variance was much greater than that predicted by the Poisson model, and since it is known that this leads to underestimation of standard errors in parameters, a quasi-likeli-hood function was used with constant vari-ance, without specifying the data’s distribu-tional form (Demetrio & Hinde, 1998).
Selection of the second model (Model 2) was based on the parameters of the previous model and the attempt to obtain a more parsi-monious but also non-stationary model:
λ(t,u) = αexp(β1u) + β2log(t)u
In addition to the usual statistical criteria for choice of models based on goodness-of-fit measurements and residuals analysis, we also used the best approximation to the AIDS diag-noses published in the February 1999 Epidemi-ological Bulletin. Note that the fit in these models was performed using only the data re-ported as of June 1996. We applied the delay pattern found by the models to the annual di-agnoses already reported and published in the February 1999 Bulletin (Tbul) as explained above. Using these data, we fitted the previous models again and obtained other parameters that allowed us to construct two tables pertain-ing to the 155,689 cases reported as of Febru-ary 1999, completing the information lost from delays with that obtained through the two models described above.
Table 2 shows the results of the totalization (by year of diagnosis) obtained from the mod-els’ estimates, as well as the real observations published in the February 1999 Bulletin. Ac-cording to these estimates, by the end of 1998 Brazil had 36,000-50,000 AIDS cases diagnosed and still not reported, i.e., a total of some 190,000-200,000 cases already diagnosed rather than the 154,000 reported as of February 1999.
Discussion
Problems with the recording of AIDS reporting dates in Brazil have impeded delay correction with either the frequency or accuracy needed. Lack of correction hinders estimates of the number of HIV-infected individuals performed with methods using official AIDS reports. This study attempted to show that the lack of delay correction can also significantly distort the planning and evaluation of resource
alloca-Figure 1
Complete table needed to estimate delay pattern.
Semester (1) Delay (u) Total
1 2
3 Yobs
. .
. Tinc Test
12 .
. Ycens
. 26
t = 1 (first semester 1986) to t = 26 (second semester 1998). u = 1 (reported during same semester as diagnosis); u = 15 (reported 14 semesters later).
Yobs= number of cases diagnosed in each semester t and reported
with usemesters of delay.
Ycens= number of cases diagnosed in each semester t and whose
reporting delay will be greater than the observation time. Tinc= Total cases diagnosed each year and already reported.
Test= Total cases diagnosed each year including estimates of those
that will still be reported.
Figure 2
Table possible to obtain from lost dates.
Semester (1) Delay (u) Total
1
2 Yobs
3
I . Tinc
.
. Ycens Test
20 21 .
II . Ycens Tbul
. 26
t = 1 (first semester 1986) to t = 20 (second semester 1995). t = 21 (first semester 1996) to t = 26 (second semester 1998). u = 1 (reported during same semester as diagnosis) to u = 15 (reported 14 semesters later).
Yobs= number of cases diagnosed in each semester tand reported
with usemesters of dealy.
Ycens= number of cases diagnosed in each semester tand whose
reporting delay will be greater than the observation time. Ymiss= number of cases diagnosed beginning in 1996 for which
there are no reporting dates.
Tinc= Total cases diagnosed each year and already reported.
Tbul= Total cases diagnosed each year since 1996 and published
in the February 1999 Bulletin.
Test= Total cases diagnosed each year, including estimates of those
tion for hospital care. The results of this study should be viewed as a temporary approach to the problem of missing dates and estimation of the epidemic’s magnitude, since the definitive solution to this problem requires application of date imputation methods to the SINAN Data-base. Barnard & Meng (1999) applied the mul-tiple imputation methods developed by Gel-man et al. (1995) to various databases, one of which aimed to impute the dates of AIDS deaths. Despite the limitation of this study, which can-not be replicated to other situations, can-note that the estimates indicating a growing epidemic may merely be reflecting aspects of surveil-lance that alter the reporting pattern. Among such aspects are the decrease in under-report-ing, changes in official diagnostic criteria, or
changes in actual diagnostic criteria which may have been altered since 1996 to facilitate pa-tients’ access to anti-retroviral treatment.
AIDS case reporting is still very important in Brazil for those evaluating and monitoring the epidemic, but it is already clear that a com-bined prevalence of those living with a diagno-sis of HIV infection and those living with AIDS would provide a more realistic and useful esti-mate of necessary therapeutic resources. This highlights the need for official monitoring of HIV cases in Brazil, recently made official in the United States by the CDC (MMWR, 1999). Such monitoring will make more precise esti-mates of the effects of medication on incuba-tion and survival time, in addiincuba-tion to allowing for evaluation of preventive campaigns.
Table 2
AIDS cases diagnosed until 1998 and estimated by the two models and compared to published data.
Year of diagnosis February 1999 Bulletin Model 1 Model 2
Until 1986 1,876 1,876 1,876
1987 2,728 2,597 2,670
1988 4,421 4,367 4,372
1989 6,171 6,454 6,371
1990 8,654 8,794 8,654
1991 11,500 11,327 11,208
1992 14,508 13,999 14,023
1993 16,328 16,759 17,092
1994 17,778 19,563 20,406
1995 18,939 22,375 23,959
1996 20,200 25,160 27,747
1997 18, 971 27,890 31,764
1998 13,516 30,542 36,005
Total 155,689 191,704 206,149
Acknowledgments
References
BARBOSA, M. T. S. & STRUCHINER, C. J., 1997a. Esti-mativas do número de casos de AIDS: Compara-ção de métodos que corrigem o atraso da notifi-cação. In: A Epidemia da AIDS no Brasil (Minis-tério da Saúde, org.), pp. 15-26, Brasília: Ministé-rio da Saúde.
BARBOSA, M. T. S. & STRUCHINER, C. J., 1997b. A correção do atraso da notificação por região bra-sileira. Boletim Epidemiológico-AIDS, IX:4-8. BARBOSA, M. T. S. & STRUCHINER, C. J., 1998.
Esti-mativas do número de casos de AIDS no Brasil, corrigidos pelo atraso de notificação. Revista Bra-sileira de Epidemiologia, 3:234-239.
BARNARD, J. & MENG, X. L., 1999. Applications of multiple imputation in medical studies: From AIDS to NHANES. Statistics in Medical Research, 8:17-36.
BECKER, N. G. & KUI, J. S., 1997. Estimating a delay distribution from incomplete data, with applica-tion to reporting lags for AIDS cases. Statistics in Medicine,16:2339-2347.
BROOKMEYER, R. & DAMIANO, A., 1989. Statistical methods for short term projections of AIDS inci-dence. Statistics in Medicine,8:23-34.
BROOKMEYER, R. & GAIL, M. H., 1994 AIDS Epidemi-ology: A Quantitative Approach.New York: Oxford University Press.
BROOKMEYER, R. & LIAO, J., 1990. Statistical model-ing of the AIDS epidemic for forecastmodel-ing health care needs. Biometrics, 46:1151-1163.
CNDST/AIDS (Coordenação Nacional de DST e AIDS), 1994. Co-infecção TB/HIV/AIDS. Brasília: Ministé-rio da Saúde.
DEMÉTRIO, C. & HINDE, J., 1998. Overdispersion: Models and Estimation. Caxambu: Associação Brasileira de Estatística.
FERREIRA, V. M. B. & PORTELA, M. C., 1999. Avalia-ção de casos de AIDS no Município do Rio de Ja-neiro com base em dados do sistema de infor-mações hospitalares do Sistema Único de Saúde.
Cadernos de Saúde Pública, 15:317-323.
GEBHARDT, M. D.; NEUENSCHWANDER, B. E. & ZWAHLEN, M., 1998. Adjusting AIDS incidence for non-stationarity reporting delays: A necessity for country comparisons. European Journal of Epidemiology,14:595-603.
GELMAN, A.; CARLIN, J. B.; RUBIN, B. D. & STERN, H., 1995. Bayesian Data Analysis Texts in Statisti-cal Science.London: Chapman & Hall.
HARRIS, J. E., 1990. Reporting delays and the inci-dence of AIDS. Journal of the American Statistical Association, 8:915-924.
LAW, M. G. & KALDOR, J. M., 1997. A note on the grouping of surveillance data when adjusting for reporting delays. American Journal of Epidemiol-ogy, 146:592-595.
LEMOS, K. R. V., 1998. Mortalidade por AIDS no Esta-do Esta-do Rio de Janeiro e Avaliação Esta-do Sub-Registro de Casos de AIDS tendo como Indicador a Decla-ração de Óbito. Dissertação de Mestrado, Rio de Janeiro: Instituto de Medicina Social, Universi-dade do Estado do Rio de Janeiro.
LINDSEY, J. K.,1996. Fitting bivariate intensity func-tions, with an application to modelling delays in reporting acquired immune deficiency syndrome.
Journal of the Royal Statistical Society, 159, Part I:125-131.
MMWR, 1999. Guidelines for national Human Im-munodeficiency Virus case surveillance, includ-ing monitorinclud-ing for Human Immunodeficiency Virus infection and Acquired Immunodeficiency Syndrome. MMWR, 48:1-31
SELLERO, C. S.; FERNANDEZ, E. V.; MANTEIGA, W. G.; OTERO, X. L.; HERVADA, X.; FERNANDEZ, E. & TABOADA, X. A., 1996. Reporting delay: A review with a simulation study and application to Span-ish AIDS data. Statistics in Medicine, 15:305-321. STATISTICAL SCIENCES, 1993. S-Plus, Version 3.2.
Seattle: Statistical Sciences, MathSoft Inc. ZEGER, S. L.; SEE, L. C. & DIGGLE, P. J., 1989.
Statisti-cal methods for monitoring the AIDS epidemic.
Statistics in Medicine,8:3-21.
Submitted on 6 October 2000