1. Professional Master’s Degree – Responsible for the Statistical Department at HC/UNICAMP.
2. Associated Full Professor – Head of the Cardiac Surgery Department at HC/UNICAMP.
3. PhD – Assistant Physician of the Cardiac Surgery Department at FCM/UNICAMP.
4. PhD – Full Professor of the Cardiac Surgery Department at FCM/ UNICAMP.
5. PhD – Assistant Physician of the Cardiac Surgery Department at FCM/UNICAMP.
6. Graduate Student in Statistics at UFSCar – Graduate Student of the Statistical Department at UFSCar.
Guiomar Terezinha Carvalho ARANHA1, Reinaldo Wilson VIEIRA2, Pedro Paulo Martins de OLIVEIRA3, Orlando PETRUCCI JUNIOR4, Benedito Galvão BENZE5, Lindemberg da Mota SILVEIRA FILHO3, Karlos Alexandre de Souza VILARINHO3, Lívia Paschoalino de CAMPOS6
RBCCV 44205-1104
Identificação de um método estatístico como instrumento da qualidade: tempo da presença do doente
na sala de operação
Identification of a statistical method as a quality
tool: patient’s length of stay in the operating room
Abstract
Objective: To identify a statistical method that may express the patient length of stay in the operating room and build a “matrix of relationship” for optimizing this time, the real and exact time of the operation.
Methods: The analysis of survival and the Kaplan-Meier estimator allowed to calculate the survival curves for different times and the “matrix of relationship” with 10 hypothesis to help in choosing the new operation. The study consisted of a simple random sample of 71 patients, from elective operations for adults in Cardiac Surgery/Clinics Hospital/Unicamp, with confidence level of 95% in 2008.
Results: On average, the times of the operations over at a range of 140 minutes to 200 minutes and excess from 5 minutes to 90 minutes. In general, on average, one operation was daily performed within 520 minutes, for a time of 720 minutes.
Conclusion: 1) With the maximum available time of 720 minutes is not possible to perform surgery, unless using the “matrix of relationship”, whereas the maximum time available varies between 660 minutes and 690 minutes, considering the range of cleaning of the room. 2) The time of the patient in the operating room is a time that includes
the time of learning by the student in an university hospital school. 3) When optimizing the time, most patients will benefit, causing a decrease from the waiting list for new opeartions. 4) The “matrix of relationship” allows to view and express opinion on a better decision making in addition to decide upon several assumptions.
Descriptors: Cardiac surgical procedures. Survival analysis. Quality Control.
Resumo
Objetivo: Identificar um método estatístico que expresse o tempo da presença do doente na sala de operação e construir a “matriz de relação” de otimização deste tempo, o tempo exato e real da operação.
Métodos: A análise de sobrevivência e o estimador de Kaplan-Meier permitiram calcular as curvas de sobrevivência para os diferentes tempos e a “matriz de relação” com 10 hipóteses para auxiliar na escolha da nova operação. A amostra aleatória simples de 71 indivíduos, das operações eletivas de adultos da Cirurgia Cardíaca/Hospital de Clínicas/UNICAMP, no ano 2008, no nível de confiança de 95%.
This study was carried out at Clinics Hospital, State University of Campinas. Campinas, SP, Brazil.
Correspondence address:
Guiomar Terezinha Carvalho Aranha
Rua Ferreira Penteado, 874/ 22 - 2º andar - Centro - Campinas , SP, Brazil. ZIP Code: 13010-041.
E-mail: [email protected]/[email protected]
Article received on May 1st, 2009
INTRODUCTION
The constitutional principles of the Health Care System (SUS) together with the Brazilian nosological situation and technological evolution and increase of its costs, as a result of scientific progress, make the prioritization of health interventions a critical issue. Citing Fourez [1], “For many of our contemporaries, it seems clear that science and technology are connected”. According Bittar [2], citing Sloan and Valcona, “the more precise and rapid diagnosis -due to the development of complementary services - have brought, as a result, a decrease in length of stay. Also, one should not forget the technological development occurred with drugs, orthoses, prostheses and procedures that directly influence on the length of stay required for recovery of patients”.
Hospital processes constantly need to be improved. The search for tools that can measure the processes and activities, make possible the improvement of the quality of services provided. Combined with a high-technology, professionals who always are well prepared for the management of such services, are an important factor in the relationship of medical care with patients, as well as the time the procedures are performed is an essential variable to be measured - from the waiting list of the patient to be treated up to his effective treatment. As a result we can mention the effective and efficient use of resources, indicators measuring the quality and quantity of what is done in terms of programs and health services, such as structure, processes and outcomes; by avoiding waste, such as cancellation of surgeries, time in waiting list, among others that should be pursued by the manager, otherwise the Hospital not may survive. Such subjects are approached by Aranha [3], Bittar [4], Duarte and Ferreira [5], Perroca et al. [6] and Haddad et al. [7].
The aim of this study is to identify a statistical method that expresses the time of the presence of the patient in the Resultados: Os tempos das operações em média sobram em um intervalo de 140 a 200 minutos e excedem de 5 a 90 minutos. No geral, realizou-se em média diariamente uma operação dentro de 520 minutos, para um tempo disponível de 720 minutos.
Conclusão: 1) Com o tempo máximo disponível de 720 minutos não é possível realizar operação, a não ser utilizando da “matriz de relação”, sendo que o tempo máximo disponível varia entre 660 e 690 minutos, considerando-se intervalo de limpeza da sala. 2) O tempo do doente na sala
Chart 1. Heart surgery procedures Name
Mitral – bioprosthesis replacement Mitral – mechanical prosthesis replacement In-patient implant of valve prosthesis (valve repair) Aortic – bioprosthesis replacement
Aortic – mechanical prosthesis replacement On-pump CABG surgery
Valve replacement with CABG Interatrial communication closure
Enlargement of the right ventricular outflow tract and/or pulmonary branches
Correction of total anomalous drainage of the pulmonary veins Correction of double-outlet right ventricle
Aortic root repair using valvulated tube Descending aortic replacement Ascending aortic replacement Pericardiectomy
Surgical debridment Valve prosthesis implant
Codes: 1) Valvar – 2) Congenital heart diseases – 3) Ischemic heart disease – 4) Aortic aneurysm – 5) Other procedures: Pericardiectomy and Surgical debridement
Code 1 1 1 1 1 3 3 2 2 2 1 4 4 4 5 5 1
de operação tem nele incluso o tempo de aprendizado pelo aluno, em um hospital escola, universitário. 3) Ao otimizar o tempo, mais doentes serão beneficiados, acarretando diminuição da fila de espera para novas operações. 4) A “matriz” de relação permite visualizar, opinar e decidir mediante várias hipóteses, resultando em melhor tomada de decisão.
Descritores: Procedimentos cirúrgicos cardíacos. Análise de sobrevida. Gestão de qualidade.
operating room and build a relationship matrix of optimization of this time, the exact and real time of the operation.
METHODS
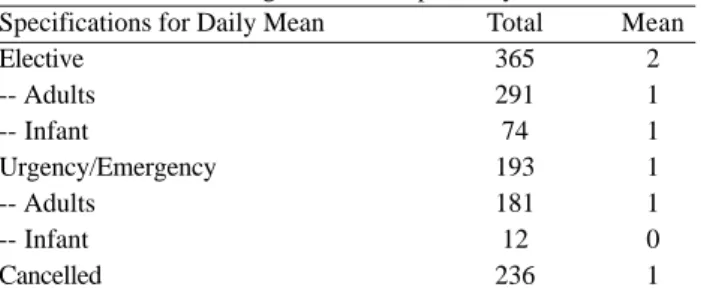
Table 1. Performed surgeries and hospital stay
Specifications for Daily Mean Elective
-- Adults -- Infant
Urgency/Emergency -- Adults
-- Infant Cancelled
Total 365 291 74 193 181 12 236
Mean 2 1 1 1 1 0 1
Source: Surgical Center/HC/UNICAMP
Note: Elective surgeries from adult patients were performed within 203 days and infant ones 72. Urgency/Emergency surgeries were performed within 181 days
After classifying the times of operating room and the types of operation, we identified the schedule of the operating room for heart surgery, which has an exclusive room, with two periods of 360 minutes, totaling 720 minutes available daily. Next, we used the method of applied survival analysis, according to Colosimo and Giolo [8], which seemed to be the most appropriate for this type of study. The records collected came from a random sample of 71 patients, whereas eight of aortic aneurysm, six of ischemic heart disease, six with congenital heart disease, two of other procedures (pericardiectomy and surgical debridement) and 49 valve disease patients, at a confidence level of 95% during the year 2008, noting that at the time of collection of this sample there was no aortic surgery. The data are only related to adult patients undergone heart surgeries at the mentioned period and were performed at the Clinics Hospital of UNICAMP, and the software used for analysis was the SAS. In survival analysis, the dependent variable is the time when the event occurs, or that is, when the surgery is performed. This time is counted from the time of entry into the operating room, which is the “time of entry into the operating room” until the discharge from the operating room, which is the “time of discharge from the operating room”. The dependent variable, time, is the “failure time”, that in this case, is the time when the surgery was not accomplished and it refers to the initial time, the measurement scale and the occurrence of the event. The aim of this statistical analysis is to identify factors that may influence the processing time. The time in which the event of interest occurs is specified by its “survival function” or “risk function”. The first is the probability that an observation does not fail until a specified time. The second is the probability that the failure occurs in a period of time. The procedure adopted is to find an estimate for the survival function and, from such function, to estimate these measures.
The most widely known technique for this purpose is the Kaplan-Meier nonparametric method, where: S (t) = number of observations that have not failed until a specified time/ total number of observations in the study. The estimator considers both time intervals as the number of distinct failures. To assess the accuracy of this estimator it can be built confidence intervals and hypothesis test for S (t). The survival curves for this study and further analysis were calculated for: T1 - Real Time of Surgery, T2 - Exact Time of Surgery and T3 - Time of the Presence of the Patient in the operating room. The data collected do not have any missing time, and there is therefore no variable without values.
RESULTS AND DISCUSSION
Surgeries and cardiac hospital stay are shown in the Table 1.
Regarding the cancellation of surgeries, there were many different reasons, such as administrative reasons or “extra-patient hospital factors”, 190 surgeries suspended; reasons related to patients, 46 surgeries suspended, totaling 236 surgeries suspended; and two reasons mainly due to “inadequate surgical time”, 92 suspended surgeries; and “lack of beds available”, 70 suspended surgeries, totaling 162 suspended surgeries due to the maximum time available for daily surgeries at the Surgical Center, which could be better controlled, reducing the waiting list.
Survival analysis for time (minutes) T1, T2 and T3, in general and in particular by type of surgery
T1 (end time of the surgery - time of anesthetic induction) - Real-Time of Surgery, T2 (end time of the surgery - time of (degermation + assepsy + placement of surgical fields)) -Exact Time of Surgery and T3 (time of discharge from the operation room time of entry into the operating room) -Time of the Presence of the Patient in the Operating Room, presented with their respective graphics.
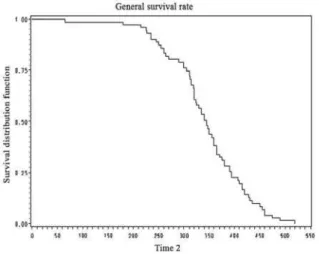
Survival analysis - times T1, T2 and T3 (General)
Fig. 1 - General survival rate – time 1: T1 - Real Time of Surgery (minutes)
Fig. 2 - General survival rate – time 2: T2 - Exact Time of Surgery (minutes)
Fig. 3 - General survival rate - time 3; T3 - Time of the Presence of the Patient in the Operating Room (minutes)
Fig. 4 - Type survival rate: Aortic aneurysm - time 3: T3 -Time of the Presence of the Patient in the Operating Room (minutes)
Survival analysis - time T1, T2 and T3 - by types of heart surgery
Aortic aneurysm
- Time (T1) - Real Time of Surgery (minutes). By the time of 350 minutes, in about 50% of surgeries their T1 times were not completed, and so until the time of 485 minutes on average all surgeries had their T1 times completed.
- Time (T2) - Exact time of Surgery (minutes). By the time of 320 minutes, in about 50% of surgeries their T2 times were not completed, and so until the time of 420 minutes on average, all surgeries had their T2 times completed.
- Time (T3) - Time of the Presence of the Patient in the Operating Room (minutes). By the time of 450 minutes, in
about 50% of surgeries their T3 times were not completed, and so until the time of 520 minutes on average, all surgeries had their T3 times completed (Fig.4).
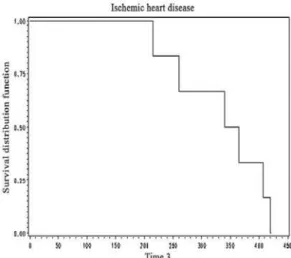
Ischemic heart disease
- Time (T1) - Real Time of Surgery (minutes). By the time of 275 minutes, in about 50% of surgeries their T1 times were not completed, and so until the time of 400 minutes on average, all surgeries had their T1 times completed.
Fig. 5 Type survival rate: Ischemic heart disease time 3: T3 -Time of the Presence of the Patient in the Operating Room (minutes)
Fig. 6 Type survival rate: Congenital heart disease time 3: T3 -Time of the Presence of the Patient in the Operating Room (minutes) - Time (T3) - Time of the Presence of the Patient in the
Operating Room (minutes). By the time of 340 minutes, in about 50% of surgeries their T3 times were not completed, so until the time of 420 minutes on average, all surgeries had their T3 times completed (Fig. 5).
Congenital heart disease
- Time (T1) - Real Time of Surgery (in minutes/hours). By the time of 245 minutes, in about 50% of surgeries their T1 times were not completed, and so until the time of 285 minutes on average, all surgeries had their T1 times completed.
- Time (T2) - Exact Time of the Surgery (in minutes). By the time of 222 minutes, in about 50% of surgeries their T2 times were not completed, and so until the time of 262 minutes on average, all surgeries had their T2 times completed.
- Time (T3) - Time of the Presence of the Patient in the Operating Room (in minutes). By the time of 270 minutes, in about 50% of surgeries their T1 times were not completed, and so until the time of 355 minutes on average, all surgeries had their T3 times completed (Fig. 6).
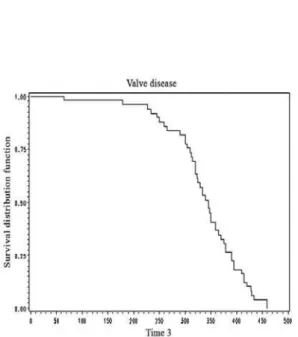
Valve diseases
- Time (T1) - Real Time of Surgery (minutes). By the time of 290 minutes, in about 51% of surgeries their T1 times were not completed, and so until the time of 408 minutes on average, all surgeries had their T1 times completed.
- Time (T2) - Exact Time of Surgery (minutes). By the
time of 265 minutes, in about 53% of surgeries their T2 times were not completed, and so until the time of 385 minutes on average, all surgeries had their T2 times completed.
- Time (T3) - Time of the Presence of the Patient in the Operating Room (minutes). By the time of 340 minutes, in about 51% of surgeries their T3 times were not completed, so until the time of 460 minutes on average, all surgeries had their T3 times completed (Fig. 7).
Other procedures: pericardiectomy and surgical debridement
- Time (T1) - Real Time of Surgery (minutes). By the time of 190 minutes, in about 50% of surgeries their T1 were not completed, and so until the time of 250 minutes on average, all surgeries had their T1 times completed.
- Time (T2) - Exact Time of Surgery (minutes). By the time of 167 minutes, in about 50% of surgeries their T2 times were not completed, and so until the time of 225 minutes on average, all surgeries had their T2 times completed.
- Time (T3) - Time of the Presence of the Patient in the Operating Room (minutes). By the time of 225 minutes, in about 50% of surgeries their T3 times were not completed, and so until the time of 310 minutes on average, all surgeries had their T3 times completed (Fig. 8).
Chart 2. Maximum time in the operating room (minutes) – T1: Real Time of Surgery – T2: Exact Time of Surgery – T3: Time of Presence of the Patient in the Operating Room
Maximum time (minutes)
Time in the operating room
T3 T2 T1
Available maximum times (TMax)
TMax (720 minutes)
T Max (660 minutes) (- 60 minutes - assepsy) TMax (690 minutes) (- 30 minutes - assepsy) TMax (720 minutes)-minimum for assepsy Tmax (720 minutes)-maximum for assepsy Difference = TMax (720)- T3 (H1 and H2) Difference = TMax (660)- T3 (H3 and H4) Difference = TMax (690)-T3 = (H5 and H6) Difference = TMax (720)-T3 TLMax type (H7 and H8) Diference = TMax (720)-T3 TLMin type (H9 and H10)
Time of assepsy of the operating room
Minimum assepsy time (TLMin) Maximum assepsy time (TLMax)
Time of assepsy according the literature (approximately)
Time of use of the Operating Room
-- Minimum time of use = T3 +TLMin -- Maximum time of use = T3 +TLMax
General
520 420 485
720 660 690 710 660 200 140 170 140 190
10 60 30
530 580
Aneurysm
520 420 485
720 660 690 695 665 200 140 170 145 175
25 55 30
545 575
Valvar
460 385 408
720 660 690 710 680 260 200 230 220 250
10 40 30
470 500
Ischemic heart disease
420 377 400
720 660 690 695 660 300 240 270 240 275
25 60 30
445 480
Congenital heart disease
355 262 285
720 660 690 710 710 365 305 335 355 355
10 10 30
365 365
Other procedures
310 225 250
720 660 690 670 670 410 350 380 360 360
50 50 30
360 360
Fig. 7 - Type survival rate: Valve disease - time 3: T3 -Time of the Presence of the Patient in the Operating Room (minutes)
Chart 3. Matrix of relationship of optimization of the patients stay time in the operating room
Surgeries x Remaining/Over time in relation to Available Times Types Times Analysis Survival (T3) Hypothesis H1 H2 H3 H4 H5 H6 H7 H8 H9 H10 General available time (minutes) 720 720 660 660 690 690 660 660 710 710 General 520 General 200 r (200): nr
200 r (200): nr
140 r (140):nr 140 r (140):nr 170 r (170):nr 170 r (170):nr 140 r (140):nr 140 r (140):nr 190 r (190):nr 190 r (190):nr
Remainig time (minutes)/over time (minutes) Aneurysm 520 Aneurysm 200 r (200):nr 200 r (200):nr 140 r (140):nr 140 r (140):nr 170 r (170):nr 170 r (170):nr 145 r (145):nr 145 r (140):nr 175 r (175):nr 175 r (175):nr Valvar (Val) 460 Valvar 260 r (260):nr 260 o (50):OP 200 r (200):nr 200 r (200):nr 230 r (230):nr 230 o (80):OP 220 r (220):nr 220 o (90): OP
250 r (250):nr 250 o (60):OP Congenital (Cong) 355 Congenital 365 r (10):Cong 365 r (55):OP o (55); Isq
305 r(305):nr o(50):Cong 305 o(5):OP 335 o(20):Cong 335 r(25):OP o(85):Isc 355 r(0):Cong 355 r(45):OP o(65):Isc 355 r(0):Cong 355 r(45):OP o(65):Isc Ischemic (Isc) 420 Ischemic 300 r(300):nr 300 o(55):Cong o(10): OP 240 r(240):nr 240 o(70):OP 270 r(270):nr 270 o(40):OP o(85):Cong 240 r(240):nr 240 o(70):OP 275 r(275):nr 275 o(35):OP o(80):Cong Other Procedures (OP) 310 OP 410 r(100):OP 410 o(50):Val o(10):Isc r(55):Cong 350 r(40):OP 350 o(5):Cong o(70): Isc 380 r(70):OP 380 r(25):Cong o(40):Isc o(80):Val 360 r(50):OP 360 r(5):Cong o(60):Isc 360 r(50):OP 360 r(5):Cong o(60):Isc
Note 1: General mean of remaining time from 140 minutes to 200 minutes – and mean of Over Time from 5 minutes to 90 minutes. Note 2: r: remaining time, o: over time and nr: no new surgery to be performed
and maximum times of assepsy according the type of surgery and the assepsy time described in the literature, according Nepote [9]. In Chart 3, the “relationship matrix” is a cross-analysis of informations obtained by the survival cross-analysis and contains the difference of maximum times with respect to T3, the 10 hypotheses aiding in re-operation, spare time and over time of the possible new surgeries, and, in general and in the average, the spare time is of 140 minutes to 200 minutes, and over time of 5 minutes to 90 minutes and no new surgery to be performed. For example, if it is used H1, Tmax difference (12)-T3 (=200) and considering the rule of H1:
Chart 4. Planning of the optimization of the heart surgery room with prediction of new surgeries
Types
Aneurysm Valvar
Ischemic heart disease Congenital heart disease Other procedures
Aneurysm
__ __ __ __ __
Valvar
__ __ __ __ H2/H6
Ischemic heart disease __
__ __ H2/H6/H8/H10 H2/H4/H6/H8/H10
Congenital heart disease __
__ H2/H6/H10 H1/H3/H5/H7/H9 H2/H4/H6/H8/H10
Other procedures __ H2/H6/H10 H2/H4/H6/H8/H10 H2/H4/H6/H8/H10 H1/H3/H5/H7/H9
Tipos
Assumptions for performing of new surgery of the same type or not, for each type of heart surgery:
H1: New Surgeries of the same type, with Tmax Difference = (720)-T3;
H2: New Surgeries of different types, with Tmax Difference = (720)-T3;
H3: New Surgeries of the same type, with Tmax Difference = (660)-T3;
H4: New Surgeries of different types, with Tmax Difference = (660)-T3;
H5: New Surgeries of the same type, with Tmax Difference = (690)-T3;
H6: New Surgeries of different types, with Tmax Difference = (690)-T3;
H7: New Surgeries of the same type, with Tmax Difference = (720)-T3 TLMax type;
H8: New Surgeries of different types, with Tmax Difference = (720)-T3 TLMax type;
H9: New Surgeries of the same type, with Tmax Difference = (720)-T3 TLMin type;
H10: New Surgeries of different types, Difference Tmax = (12)-T3 TLMin type (Chart 4).
Analyzing the possibilities for performing new surgeries with respect to the 10 hypotheses, we can mention: H10: seven possibilities, H2 and H6: eight possibilities, H8: five possibilities, H4: four possibilities: H1, H3, H5, H7, H9: two possibilities, depending on the end average time of surgery, type of surgery, with an interval of time plus 90 minutes to perform new surgeries, assepsy of the operating room between surgeries, and according to the hypothesis adopted, it may be an increase in quantity and better planning of surgeries, reduction of waiting list, cost of the operating room, and therefore social benefit. It is expected an increase in a daily surgery, except for aortic aneurysm, due to the time of this procedure is of 520 minutes on average.
Operating Room. In general, the mean time in minutes is as follows: for T1, Real Time of Surgery, 298 minutes; T2,
Exact Time of Surgery, 271 minutes; and T3, Time of the Presence of the Patient in the Operating Room, 342 minutes. Suspention of Surgeries: If there was no suspension of surgeries due to administrative reasons, 481 surgeries could be performed. In general, the monthly average of surgeries would probably be 40 surgeries or 10 surgeries weekly or two daily surgeries, except when it is aortic aneurysm surgery, which has a maximum time of 520 minutes, but mainly one should be considered the possibilities of relationship matrix for optimization of time of the patient in the operating room for decision making.
Duarte & Ferreira [5] identified as an important indicator of process, surgeries suspended due to extra-patient hospital factors, that has been used to reveal the degree of organization of the Surgical Center, as well as the surgery of various units of the hospital, because it involves the monitoring of various processes and subprocesses. The follow-up and correction of the main causes of hospital suspension of the surgery can lead to reductions in waste, increased quality and productivity, in agreement with this study, on which the suspension causes several “wastes”, an indicator that already was studied by Aranha and Vieira [10].
REFERENCES
1. Fourez G. A construção das ciências: introdução à filosofia e à ética das ciências. São Paulo:UNESP;1995. p.156-77.
2. Bittar OJNV. Produtividade em hospitais de acordo com
alguns indicadores hospitalares. Rev Saúde Pública. 1996;30(1):53-60.
3. Aranha GTC. Estudo de um dos indicadores do custo da qualidade: o desperdício. [Dissertação de Mestrado Profissional]. Campinas:Faculdade de Engenharia Mecânica/ UNICAMP;2001. 156p.
4. Bittar OJNV. Indicadores de qualidade e quantidade em saúde. Rev Adm Saúde. 2001;3(12):21-8.
5. Duarte IG, Ferreira DP. Uso de indicadores na gestão de um centro cirúrgico. Rev Adm Saúde. 2006;8(31):63-70.
6. Perroca MG, Jericó MC, Facundin SD. Cancelamento cirúrgico em um hospital escola: implicações sobre o gerenciamento de custos. Rev Latino-Am Enfermagem. 2007;15(5):1018-24.
7. Haddad N, Bittar OJNV, Pereira AAM, Silva MB, Amato VL, Farsky PS, et al. Conseqüências do prolongamento do tempo de espera em pacientes candidatos à cirurgia cardíaca. Arq Bras Cardiol. 2002;78(5):452-8.
8. Colosimo EA, Giolo SR. Análise de sobrevivência. 1ª ed. São Paulo:Projeto Fisher/ Ed Edgar Blücher;2006. p.369.
9. Nepote MHA. Associação entre os índices operacionais e a taxa de ocupação de um centro cirúrgico geral [Dissertação de Mestrado]. Campinas:Universidade Estadual de Campinas;2008. 75p.
10. Aranha GTC, Vieira RW. Estudo de um dos indicadores do custo de qualidade: o desperdício. Rev Adm Saúde. 2004;6(23):43-55.
CONCLUSION