1 INTRODUCTION
The deterioration and maintenance of existing structures are issues of increasing concern since massive costs are expected in a near future. This concern is particularly important in bridges reaching their design life time since their social and economic impact is huge. According to Costs (2002), the direct costs associated with bridge deterioration in the United States reach 8.3 billions of dollars annually, and it is expected that the indirect costs associated to users can be up to ten times higher.
One of the main reasons responsible for the dete-rioration is member corrosion and reinforcement corrosion in steel and reinforced concrete structures, respectively. In the last case structural repairing could be a harder task since the reinforcement is not easily accessible. Also in reinforced concrete (RC) structures the corrosion effect cannot be seen as simply as a reinforcement area reduction. In fact, corrosion mechanism leads to the development of several side effects (rust expansion, concrete crack-ing, bond strength decreascrack-ing, among others) re-sponsible for the bridge deterioration acceleration.
For this reason it is fundamental to correctly assess the reliability of an existing corroded RC structure in order to adequate a safety service level.
On the other hand, the structure reliability or the safety level decreasing due to damage occurrence is related to the robustness concept which has seen growing interest in the last decades as a result of the occurrence of tragic consequences (Eagar and Mus-so 2001, PearMus-son et al. 2003, NTSB 2008) due to ex-treme events such as terrorist attacks. However the robustness concept can also be very useful when ap-plied to deterioration scenarios allowing for instance for a reinforcement concrete structure to evaluate the safety susceptibility to corrosion.
Therefore this paper intends to be a contribution to the robustness assessment of reinforced con-crete structures subjected to corrosion.
2 BACKGROUND ON ROBUSTNESS
Robustness is an emergent concept related with structural damage tolerance. Despite being a desira-ble property the fact is that no consensus has been
A reliability-based measure of robustness for concrete structures
subjected to corrosion
E.S. Cavaco
Universidade Nova de Lisboa, Civil Engineering Department, Monte de Caparica, Portugal
L.A.C. Neves
Universidade Nova de Lisboa, Civil Engineering Department, Monte de Caparica, Portugal
J.R. Casas
Technical University of Catalonia, Civil Engineering Department, Barcelona Spain
reached about its definition and the framework to as-sess it. In fact there are also some robustness related concepts, such as vulnerability, redundancy and duc-tility, among others, that are frequently misunder-stood.
In the last two decades several authors appeared with different robustness approaches (Frangopol and Curley 1987, Lind 1995, Goshn and Moses 1998, Biondini and Restelli 2008, Baker et al. 2008, Starossek and Haberland 2008, Cavaco et al. 2010). Among the proposals, some are deterministic based and other are probabilistic based. Another point of interest is the fact that some authors support the idea that robustness is an intrinsic structural property de-pending on the structural ability to maintain an ade-quate performance level after damage occurrence. The works of Frangopol and Curley (1987), Lind (1995), Biondini and Restelli (2008), Starossek and Haberland (2008) and Cavaco et al. (2010) follow this perspective.
On the other hand, other authors (Goshn and Mo-ses 1998 and Baker et al. 2008) prefer to consider robustness as a property of the structure and its envi-ronment. In this case robustness is related with the magnitude of the damage trigger event and the con-sequences extent. At the same time this robustness perspective is much broader since to compute the consequences of structural failure it is necessary to have in consideration all the social and economic environment aspects. Therefore, in this case robust-ness supersedes the structural engineer domain.
In Figure 1 the different proposals for the robust-ness concept and the framework to assess it are pre-sented and organized accordingly to the perspective assumed by the respective author.
Deterministic Frangopol and Curley (1987)
Frangopol and Curley (1987) Biondini and Restelli (2008)
Lind (1995) Starossek and Haberland (2008)
Cavaco et al. (present paper Cavaco et al. (2010)
Robustness
Structural Property
Probabilistic
)
Structural and Environment Property Probabilistic
Goshn and Moses (1998) Baker et al. (2008)
Figure 1. Different perspectives for the robustness concept.
In this paper the proposal of Cavaco et al. (2010) was adopted. Accordingly, robustness can be de-fined as a measure of the degree of structural per-formance lost after damage occurrence. The struc-tural performance can assume many forms, and can be related to service limit states or to ultimate limit
states. Damage concept should also be considered with a broader sense, i.e., damage can vary from a simple degradation state to a more serious damage as a column or a beam failure. Errors during the de-sign or the construction stage can also be seen as types of damages.
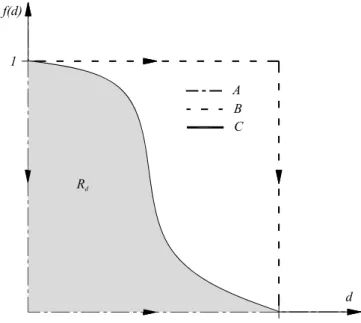
Associated to this definition the authors also pro-pose a framework to assess robustness obtained through equation (1), which gives the area above the curve defined by the normalized structural perfor-mance f subjected to a normalized damage d (Figure 2).
1
0 ( )
d d d
R f x dx
(1)where f is given by the ratio between the structural performances on the intact and damage states, and d
is given by the ratio between actual and maximum possible damage.
Figure 2. Robustness assessment. Normalized structural per-formance f as a function of the normalized damage d.
Robustness index Rd may vary from 0 to 1
respec-tively if a minimum damage level produces the en-tire loss of structural performance, curve A (Figure 2), or if the damage does not influence the structural performance, curve B. In Figure 2, curve C represent intermediate robustness approximately equal to 0.5.
This approach can be either deterministic or probabilistic by simply considering a deterministic or a probabilistic measure of the degree of the struc-tural performance lost. In this paper a probabilistic measure was adopted. Since the reliability index, , is one of the most used parameters to assess the safe-ty of existing structures, it was defined here as the structural performance indicator f used to assess ro-bustness:
11 P F( )
(2)
B A C
d 1
f(d)
1
where is the cumulative normal distribution func-tion and P(F) is the failure probability. In this case robustness indicator Rd results on equation (3):
1
0
( )
( 0) d
d d
d d
R x dx
(3)3 AN APPLICATION EXAMPLE 3.1 Structure description
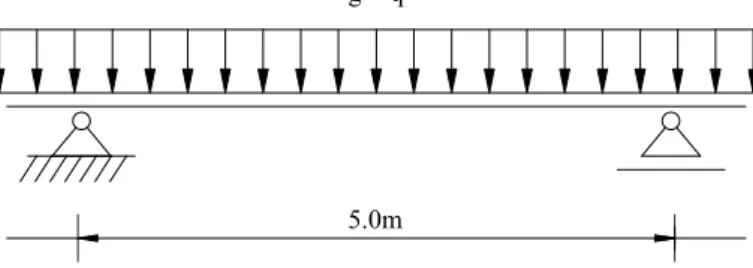
The case study considered in this paper consists on a simply supported reinforced concrete beam sub-jected to both permanent, g, and live, q, uniform loads (Figure 3) and with a 5.0m x 2.0m influence area (being 2 m, the width of the loaded area). The live load considered results from people concentra-tion in accordance to Faber and Vrouwenvelder (2000).
Figure 3. Simply supported RC beam under corrosion.
A simple 0.20m x 0.40m rectangular cross section (Figure 4) was designed in accordance with Euro-code prescriptions (CEN 2002) corresponding to the case of a pedestrian bridge. In order to assess ro-bustness, defined as explained previously, the dam-age variable considered was the corrosion level Xp of
the longitudinal reinforcement, measured in terms of weight percentage loss .
Figure 4. Cross section.
Transversal reinforcement was overdesigned and considered protected against corrosion in order to simplify the analysis.
As explained above, the reliability index, (equation (2)), was the performance indicator, f, considered to assess robustness.
3.2 Corrosion analysis methodology
To perform a structural analysis, having in con-sideration the reinforcement corrosion effects on RC structures, a methodology proposed by Sánchez et al. (2008) was adopted. The main concept behind this methodology is to perform the structural analy-sis in two steps separately. In the first step the corro-sion deteriorating effect is considered in the cross section. Then the corroded cross section properties are used to build a 2D longitudinal model of the de-teriorated structure in order to assess its reliability index. The competence of the proposed method was demonstrated comparing numerical with experi-mental results (Sánchez et al. (2008)).
3.2.1 Cross section Analysis
In the first step of the referred methodology a cross section analysis is performed in order to cap-ture the corrosion deteriorating effects. The most important effects are the expansion of corrosion products, the concrete deterioration and the concrete cracking and spalling. In order to consider these phenomena, corrosion was simulated as a steel bar expansion. For concrete an isotropic continuum damage model, ICDM, (Oliver et al. 1990) was adopted (Figure 5).
Figure 5. Isotropic Continuum damage model.
This type of constitutive relation coupled with the kinematics provided by the strong discontinuities approach, CSDA (Oliver et al. 2002), allows crack modeling on concrete. In fact, the degradation of concrete strength is the result of the initiation, growth and coalescence of micro cracks. According-ly to the ICDM this process may be modeled by in-troducing an internal damage variable, d, which can be a scalar quantity and may vary from 0, for un-damaged concrete, to 1, for full un-damaged concrete (Figure 5). When concrete loses all the strength,
d=1, the kinematics provided by the CSDA charac-terize crack occurrence as a material discontinuity that can be understood as jump on the displacement field.
5.0m g + q
E
u
=(1-d)E
A full detailed description of ICDM and CSDA can be found, respectively, in Oliver et al. (1990) and Oliver et al. (2002).
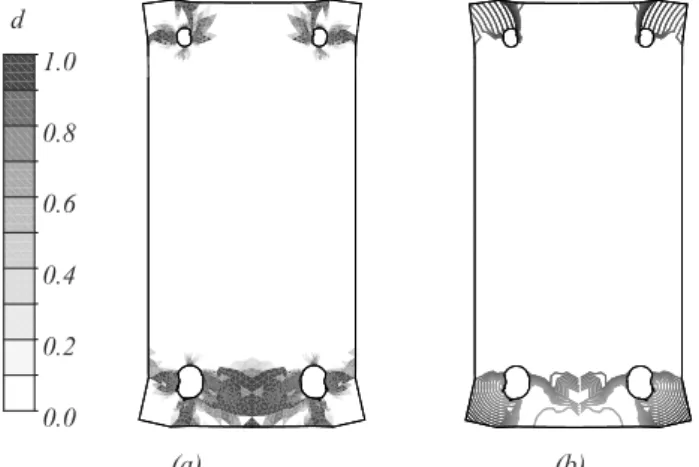
The results obtained during the cross section analysis are presented in Figure 6. During the corro-sion process a volumetric expancorro-sion of the steel bars occurs. This expansion produces concrete deteriora-tion as can be observed in Figure 6 (a). The darker areas correspond to the most damage parts of con-crete. Where damage variable d, reach values near the unity it means concrete lost almost all the strength and displacements will concentrate on these areas.
Figure 6. Cross section analysis results. (a) Concrete damage; (b) isodisplacement lines
In Figure 6 (b), isodisplacement lines are present-ed. It is possible to observe the direct relation be-tween Figures 6 (a) and (b). Cracks appear where isodisplacement lines tend to concentrate, i.e, in the same areas where concrete appear to be more deteri-orated.
In Figure 6 (b) it is possible to observe that at the beam’s top, small cracks appear producing concrete corner to detach. At the bottom, as reinforcement spacing is smaller and reinforcement radius is larger, a single crack appears connecting the two bars and leading to the delamination of the concrete cover.
The cross section analysis explained above was performed for corrosion levels Xp varying from 0%
to 100%.
3.2.2 Longitudinal analysis
The longitudinal analysis was realized in order to assess the load carrying capacity used to calculate the reliability index. The longitudinal model of the impaired structure was built accordingly to the re-sults obtained for the cross section during the first step of the analysis.
In order to achieve the compatibility between the cross section model and the 2D longitudinal model, it was necessary to project the concrete damage var-iable d from the first to the second model. Firstly, the cross section was divided into thin horizontal slices. After this, the average damage on concrete, for each slice, was calculated, considering the parts
of disconnected concrete with damage d equal to 1. This means that these parts of concrete are no longer working together with the rest of the cross section. Finally a horizontal projection of concrete average damage d of each slice between both models was conducted and the 2D longitudinal model of the cor-roded structure built.
In the 2D longitudinal model, reinforced concrete was modeled as a composite material (Figure 7), as proposed by Oliver et al. (2008), constituted by a matrix, representing concrete, with embedded fibers representing reinforcement. The ICDM, together with the CSDA and upgraded with the initial dam-age obtained from the cross section analysis, was used in order to model de deteriorated matrix behav-ior.
Figure 7. 2D Longitudinal model.
For the embedded fibers, the goal was to model both bond and reinforcement and its interaction since it plays a fundamental role on load carrying capacity deterioration. To consider the bond-slip ef-fect, the slipping-fiber model proposed by Oliver et al. (2008) was adopted. This model mainly consists on the use of two components, representing rein-forcement and its interface with concrete, in a serial system (Figure 8).
Figure 8. Slipping-fiber model.
The slipping-fiber total strain f
is given by the sum of the mechanical strain on the reinforcement, d, and the deformation due to sliding, i
: f d i
(4)
For the serial system the stresses are identical in both components:
f d i
(5)
Assuming, for each spring, an elastoplastic mod-el, the constitutive relation of the serial system re-sults also elastoplastic with the following character-istics:
1.0
0.8
0.6
0.4
0.2
0.0 d
(a) (b)
longitudinally reinforced concrete Transversely reinforced concrete concrete cover
support
d
d i
f i
( , )
1
1 1
f d i
y y i
f
d i min
E
E E
(6)
where Ed and yd are the steel Young’s modulus and
yield stress, respectively, Ei is the interface elastic modulus and yi is the interface bond limit stress.
Regard that when Ei→∞ and yd<yi, the serial
sys-tem replicates perfect adhesion between concrete and reinforcement. Since there are no consistent knowledge about bond behavior, in the present work it was assumed perfect adhesion for the uncorroded states, i.e., Ei→∞ and,yd=yi.
For the corroded states a perfect rigid-plastic model was considered, with Ei→∞ andyi <yd.
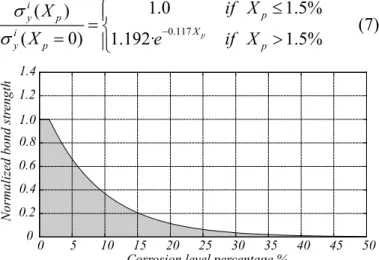
This means that it is not possible for reinforcement to yield because bond slips first. In order to charac-terize bond strength yd decreasing due to corrosion,
the M-pull model proposed by Bhargava et al. (2004) was adopted. This model, summarized in equation (7) and in Figure 9, gives the normalized bond strength yi(Xp)/yi(Xp=0) as a function of the
corrosion level Xp and is based on the available
ex-perimental data.
0.117
1.0 1.5%
( )
( 0) 1.192· p 1.5%
i
p y p
X i
y p p
if X X
X e if X
(7)
Figure 9. Bond strength deterioration as a function of the cor-rosion level.
Besides bond strength deterioration, reinforce-ment area reduction was also considered for the cor-roded states:
0 (1 )
eff p
A A X
(8)
where Aeffand A0 are respectively the effective and
initial reinforcement areas.
In Figure 10, an example of the results obtained with the 2D longitudinal model is presented. Since the transversal reinforcement was overdesigned and considered not affected by corrosion, the failure mechanism consist on a mid-span plastic hinge for-mation. In Figure 10, damage variable on concrete is shown, and it is possible to observe the formation of two large cracks near mid-span.
Figure 10. 2D longitudinal model results.
3.3 Random variables
Since a probabilistic index was chosen to be the structural performance indicator used to assess ro-bustness, it was necessary to characterize in a proba-bilistic form the random variables that have influ-ence in the reliability index assessment. Due to the high complexity involving the corrosion analysis methodology presented, it was necessary to choose only the most important parameters.
From the resistance viewpoint, concrete compres-sive strength and reinforcement yielding stress were characterized as random variables.
For concrete compressive strength it was assumed a lognormal distribution with a 38.5MPa mean and a 15% coefficient of variation.
For reinforcement the model proposed in the Probabilistic Model Code (Faber and Vrouwen-velder 2000) was adopted. Accordingly to this man-ual, for a good quality steel production, reinforce-ment strength can be considered normally distributed with mean yielding stress 1 given by:
1 Snom 2 1
(9)
where Snom is the minimum specified yield stress
limit, accordingly to the steel grade, and 1 is the
overall standard deviation that can be taken equal to 30MPa. In this work the S400 steel grade was con-sidered.
From the exposure perspective, the structure was considered subjected to self-weight, g, and live load,
q. Accordingly to Faber and Vrouwenvelder (2000), reinforced concrete self-weight was considered nor-mally distributed with a 25kN/m3 mean and 0.75kN/m3 standard deviation. The live load was considered as the result of people concentration. For this case, Faber and Vrouwenvelder (2000) recom-mend to consider null the sustained load and gamma distributed the intermittent load with 1.25kN/m2 mean and 2.5kN/m2 standard deviation.
In order to consider the uncertainties on both re-sistance and load models, Faber and Vrouwenvelder (2000) recommend accounting with two more ran-dom variables:
a resistance model variable R, lognormal
distrib-uted with 1.2 mean and 0.15 variation coefficient;
a load effect model variable E, lognormal
dis-tributed with 1.0 mean and 0.10 variation coeffi-cient.
0 5 10 15 20 25 30 35 40 45 50 0
0.2 0.4 0.6 0.8 1.0 1.2 1.4
Corrosion level percentage %
N
orma
lize
d
b
on
d
s
tr
en
g
th
1.0 0.5 0.0
The distribution parameters of the six random variables considered are presented in Table 1.
Table 1. Random variables distribution and parameters ____________________________________________ Random
Variable Dist. mean std. dev. ____________________________________________
fc logn 38.5MPa 5.8MPa
fy norm 460MPa 30MPa
g norm 25kN/m3 0.75kN/m3 q gamma 1.25kN/m2 2.5kN/m2
R logn 1.2 0.15
E logn 1.0 0.10
____________________________________________
3.4 Reliability analysis
The limit state function to consider is shown in equation (10)
G S R
(10)
The failure probability can be assessed if both fS and
fR which represent respectively the load effect S and
resistance R probability density functions, are known (Figure 11).
Figure 11. Load effect S and resistance R probability density functions.
In order to compute Pf, Monte Carlo simulation was
used with n=108 samples. Accordingly with this simulation method Pf can be obtained through the
equation (11) f f
n P
n
(11)
where nf is the number of trials where failure occurs,
i.e., S>R.
The generation of the load effect values was a simple task since S is a random variable with an ex-plicit function given by the follow expression:
inf
( ) E ( / )
S g q W kN m
(12)
The influence width, Winf in equation (12), was
con-sidered deterministic and equal to 2.0m.
On the other hand, it is not possible to have an explicit expression for the resistance R due to the complexity involving the presented corrosion analy-sis methodology. Consequently, it was necessary to achieve an adequate approximation for the resistance probability density function fR. Latin hypercube
sampling technique, accordingly to Olson et al. (2003), with 100 samples was used with the
objec-tive of reducing correlation between resistance vari-ables fc, fy and R.
The corrosion analysis methodology was per-formed for each sample element and for each corro-sion level Xp varying from 0% to 100%. For each Xp
value, a normal distribution was fitted to the re-sistance probability density function fR. The
maxi-mum likelihood parameters estimation technique was used.
To evaluate the distribution fitting performed, a one hundred dimension sample from the fitted re-sistance probability density function fR was
generat-ed. Both original and fitted samples were compared using a Kolmogorov-Smirnov hypothesis test (Mas-sey 1951). The null hypothesis was that both sam-ples are from the same continuous distribution. The alternative hypothesis was that they are from differ-ent continuous distributions. The result was negative if the test rejects the null hypothesis at the 5% sig-nificance level and positive otherwise. For every corrosion levels Xp, the null hypothesis was never
re-jected.
Figure 12. Fitting the resistance distribution for Xp=0%.
In Figure 12 the described resistance R fitting process performed for a 0% corrosion level is pre-sented. The resistance R, measured in terms of beam’s linear load carrying capacity, is normally fit-ted with mean R=40.3kN/m and standard deviation
R=3.6kN/m.
4 RESULTS
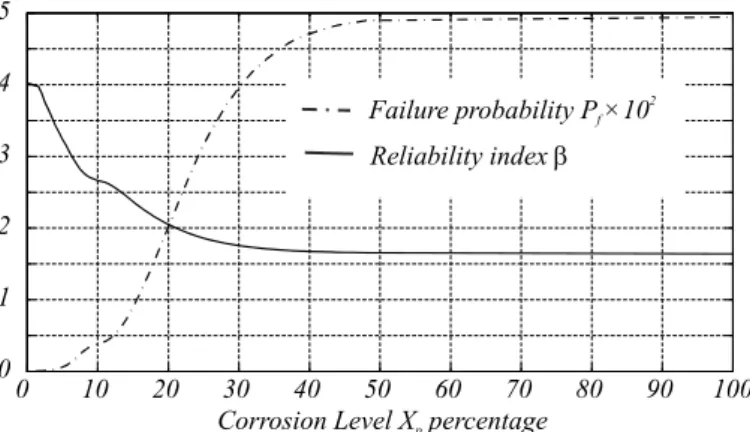
In Figure 13 it is possible to observe the failure probability evolution from the uncorroded to the full corroded state. For a corrosion level Xp<1.55% the
failure probability increases at a slow rate due spe-cially to reinforcement area reduction. Regard that in accordance to Figure 13, there is no bond strength deterioration for this corrosion level. For Xp>1.5%
the failure probability rapidly increases due to bond strength deterioration. For Xp>40% the failure
prob-ability curve slope tends to zero since reinforcement loses almost all the adhesion to concrete and the composite interaction between the two materials no longer exists. This means that from this stage for-fS
fR
x
20 30 40 50 60
0 0.02 0.04 0.06 0.08 0.10 0.12
Resistance R (kN/m)
P
ro
b
a
b
il
it
y
sample
fitted distribution
R=40.3kN/m
ward, the beam resistance is provided by the con-crete only.
Figure 13. Failure probability Pf and reliability index as
func-tion of the corrosion level Xp.
In Figure 13 the reliability index is also shown. As expected for Xp<1.5% the reliability index has a
very similar shape to bond strength deterioration curve, presented in Figure 9. Regard that the results shown in Figure 13 if combined with a model of prediction of corrosion depth with time, can be very useful in defining lifetime and safety of existing structures.
Robustness can be computed according to equa-tion (1). As referred previously, the structural per-formance indicator chosen was the reliability index and the damage considered is reinforcement corro-sion depth Xp. Normalizing this parameters and
computing the area bellow the normalized curve norm(
Xpnorm) the robustness indicator Rd
according-ly to equation (1) results in a value of 0.48 (Figure 14). This is an average percentage of the reliability index of the structure in the pristine state, consider-ing that the structure was subjected to generalized corrosion depths varying from 0% to 100%. If for instance a plain concrete structure would be consid-ered its reliability index wouldn’t decrease with cor-rosion since reinforcements does not exist. In this case robustness indicator Rd would be equal to one
reflecting a 100% corrosion damage tolerant struc-ture.
Figure 14. Robustness assessment
5 CONCLUSIONS
The robustness assessment framework presented in Cavaco et al. (2010) was used in this paper in or-der to characterize the behavior of a reinforced con-crete beam subjected to corrosion. The structural performance indicator selected was the reliability index since it is commonly used as a probabilistic safety measure. For damage quantification, corro-sion level Xp measured in terms of weight
percent-age was considered.
Deteriorating corrosion effects were considered through the use of an advance methodology consist-ing on a two steps analysis. On the first step the beam cross section was subjected to corrosion expo-sure in order to consider the follow effects: expan-sion of corroexpan-sion products; concrete deterioration; and concrete cracking and spalling. With the results obtained in the first step of the analysis a 2D longi-tudinal model of the deteriorated beam was built in order to perform a reliability analysis. Effects such as reinforcement area reduction and bond strength deterioration were also considered.
Due to the complexity involving the corrosion analysis methodology the number of random varia-bles considered was limited. It was also necessary to make an approximation to the resistance probability density function using the Kolmogorov-Smirnov hy-pothesis test with a population number of one hun-dred for each corrosion level using the latin hyper-cube sampling technique. The reliability analysis was performed using Monte Carlo simulation with a trial number n=108.
The results obtained give a precise evaluation of the failure probability and the reliability index with the corrosion level increase and can be very useful, if combined with a model of corrosion depth, in de-fining safety and lifetime of existing structures. Ro-bustness assessment revealed, an average ratio of 0.48 between the reliability index of the corroded and uncorroded beam, when subjected to generalized corrosion values varying from 0% to 100%. This is a measure of the beam “robustness” to corrosion risk.
ACKNOWLEDGMENTS
The authors would like to acknowledge COST Action TU-0601 and Fundação para Ciência e Tecnologia, scholarship SFRH/BD/45799/2008, for help supporting this research.
6 REFERENCES
Baker, J., Schubert, M., and Faber, M. (2008). On the assess-ment of robustness. Structural Safety, 30(3): 253–267. Bhargava, K., Ghosh, A., Mori,Y., and Ramanujam, S. (2007).
Corrosion-induced bond strength degradation in reinforced
0 10 20 30 40 50 60 70 80 90 100 0
1 2 3 4 5
Corrosion Level X percentagep
Reliability index Failure probability P ×10f
2
0.1 0.2 0.3 0.4 0.5 0.6 0.7 0.8 0.9 1 0
0.2 0.4 0.6 0.8 1.0
Normalized damage
N
orma
liz
ed
per
forma
nce
concrete analytical and empirical models. Nuclear Engi-neering and Design, 237(11): 1140–1157.
Biondini, F. and Restelli, S. (2008). Damage propagation and structural robustness. In Life-Cycle Civil Engineering: Pro-ceedings of the International Symposium on Life-Cycle Civ-il Engineering, IALCCE’08, Held in Varenna, Lake Como, Italy on June 11-14 2008, page 131. Taylor & Francis. Cavaco, E. S., et al. (2010). Robustness of corroded reinforced
concrete structures – a structural performance approach.
Structure and Infrastructure Engineering. DOI:
10.1080/15732479.2010.515597.
CEN, (2002). Eurocode 1: Actions on structures; Part 2: EN
1991-2 Traffic loads on bridges. Brussels
(Bel-gium):Comite European de Normalization 250.
Costs, C., (2002). Preventive Strategies in the United States. Technical report, FHWARD-01-156. Washington DC: Fed-eral Highway Administration.
Eagar, T. and Musso, C., (2001). Why did the World Trade Center collapse? Science, engineering, and speculation. JOM Journal of the Minerals, Metals and Materials Socie-ty, 53 (12), 8–11.
Faber, M. and Vrouwenvelder T., (2000). Probabilistic model code. Technical report, Joint Committee on Structural Safe-ty, 2000.
Frangopol, D. M. and Curley, J. P. (1987). Effects of damage and redundancy on structural reliability. Journal of Struc-tural Engineering, 113(7): 1533–1549.
Ghosn, M. and Moses, F. (1998). NCHRP Report 406:
Redun-dancy in Highway Bridge Superstructures. Transportation
Research Board, National Research Council, Washington, DC.
Lind, N. (1995). A measure of vulnerability and damage toler-ance. Reliability engineering & systems safety, 48(1):1–6. Massey Jr, F., (1951). The Kolmogorov-Smirnov test for
good-ness of fit. Journal of the American Statistical Association, 46 (253), 68–78.
NTSB (2008). Collapse of I-35W Highway Bridge. Highway
Accident Report NTSB/HAR-08/03. Technical report,
Na-tional Transportation Safety Board.
Oliver, J., Cervera, M., Oller, S., and Lubliner, J. (1990). Iso-tropic damage models and smeared crack analysis of con-crete. In Second International Conference on Computer Aided Analysis and Design of Concrete Structures, volume 2, pages 945–958.
Oliver, J., Huespe, A., Pulido, M., and Chaves, E. (2002). From continuum mechanics to fracture mechanics: the strong dis-continuity approach. Engineering Fracture Mechanics, 69(2): 113–136.
Oliver, J. ,Linero, D., Huespe, A., and Manzoli, O. (2008).Two-dimensional modeling of material failure in re-inforced concrete by means of a continuum strong disconti-nuity approach. Computer Methods in Applied Mechanics and Engineering, 197(5): 332– 348.
Olsson, A., Sandberg, G., and Dahlblom, O., (2003). On Latin hypercube sampling for structural reliability analysis. Struc-tural Safety, 25 (1), 47–68.
Pearson, C., et al., (2003). Lessons from the progressive col-lapse of the Ronan point apartment tower. In: Forensic En-gineering 2003: Proceedings of the third Forensic Engi-neering Congress, San Diego, California USA.
Sánchez, P., Huespe, A., Oliver, J., and Toro, S. (2008). Nu-merical modelling of the load carrying capacity degradation in concrete beams due to reinforcement corrosion. In 8th World Congress on Computational Mechanics (WCCM8), 5th European Congress on Computational Methods in Ap-plied Sciences and Engineering (ECCOMAS 2008).
Starossek, U. and Haberland, M., (2008). Approaches to measures of structural robustness. In: Proceedings of the Fourth International Conference on Bridge Maintenance,
Safety and Management, July 13-17 2008, Seoul,