*Correspondence: M. I. R. M. Santoro. Departmento de Farmácia. Faculdade de Ciências Farmacêuticas. Universidade de São Paulo. Av. Prof. Lineu Prestes, n.580, 05508-000 – São Paulo – SP, Brasil. E-mail: [email protected]
A
vol. 52, n. 3, jul./sep., 2016 http://dx.doi.org/10.1590/S1984-82502016000300016
Simultaneous determination of abamectin homologs H
2B
1aand H
2B
1bin gel formulation by high performance liquid
chromatography
Grazielle Prado Alexandre, María Segunda Aurora-Prado, Laura Victoria Español
Mariño, Anil Kumar Singh, Helen Dutra Leite, Erika Rosa Maria Kedor-Hackmann,
Maria Inês Rocha Miritello Santoro
*Department of Pharmacy, Faculty of Pharmaceutical Sciences, University of São Paulo, São Paulo, Brazil
Abamectin is a drug with antiparasitic properties used in several pharmaceutical formulations. The objective of this research was to develop and validate a high performance liquid chromatographic (HPLC)
method for quantiication of the two abamectin homologs (H2B1a and H2B1b) in gel formulation. This HPLC method was validated using a LichroCart® 100 RP-18 (125 x 4 mm, 5 µm) column. The mobile
phase contained of acetonitrile and water (95:5 v/v) with 1% acetic acid. The low rate was 1.0 mL min-1 and UV detection was performed at 245 nm. Mobile phase solutions were prepared containing a nominal concentration 185.2 µg mL-1 H
2B1a and 9.6 µg mL -1 H
2B1b.The method displayed good linearity in the concentration range of 148.1 – 222.3 µg mL-1 and 7.7 – 11.5 µg mL-1, for H
2B1a and H2B1b, respectively,
with a correlation coeicient of (r)> 0.99 for both compounds, calculated by the least mean squares method.
Detection limits (DLs) were 2.8 µg mL-1 and 1.2 µg mL-1 and quantitation limits (QLs) were 8.6 µg mL-1 and 3.8 µg mL-1, for H
2B1a and H2B1b, respectively. The method is simple, economical and eicient for the quantitative determination of abamectin H2B1a and H2B1b homologs in pharmaceutical preparations. Uniterms: Abamectin homologs/validation method/gel formulation. Abamectin homologs. High Perfomance Liquid Chromatography (HPLC).
INTRODUCTION
Avermectins are a group of fermentation products obtained from a strain of Streptomyces avermitilis and are 16-membered macrocyclic lactones, and comprise several derivatives including abamectin(Xie et al., 2011). Abamectin (Figure 1) is used in veterinary practice as an antiparasitic and in agriculture as an insecticide. Abamectin consists of a mixture of two homologous compounds: H2B1a (at least 80%) and avermectin H2B1b (no more than 20%)(Shoop, Mrozik, Fisher, 1995). Metabolic studies, have shown that abamectin H2B1b is generally metabolized more rapidly than the H2B1a homolog and therefore, H2B1a is the major residue found
in tissues and biological luids(Markus, Sherma, 1992).
Abamectin was suspected causing adverse efects in the
aquatic environment, even in low concentrations, as it presents high toxicity to aquatic organisms, such as
ish and microcrustaceans(Tisler, Erzen, 2006). Several
diferent methods have been reported in scientiic literature
for the analyses of abamectin, such as, high performance liquid chromatography (HPLC)(Kulik et al., 2011), liquid chromatography coupled to mass spectrometry (LC-MS)(Valenzuela et al., 2000; Pozo et al., 2003; Yoshii et al., 2004; Xiaolin et al., 2006; Thompson et al., 2009; Rübensam et al., 2011; Tao et al., 2012; Campillo
et al., 2013; Ismail et al., 2013), HPLC with luorescence
(Diserens, Henzelin,1999; Souza et al., 2003; Kolar et al.,
2004; Borges et al., 2008; Cerkvenik-Flajsa et al., 2010; Xie et al., 2011; Rahman et al., 2013), and UHPLC with
luorescence (Liu et al., 2001; Romero-González et al.,
H2B1a (at least 80%) and avermectin H2B1b (Shoop, Mrozik,
Fisher, 1995). It is very important to separate and quantify both simultaneously since each homolog in abamectin has a
speciic concentration. The proposed method was developed
and validated proposed to enable the separation and quantitative determination of the two abamectin homologs, in a short period of time; using a simple mobile phase in the
chromatographic runs. The principal justiication for this
research was that there were very few methods described in literature for simultaneous quantitative determination of abamectin homologs, H2B1a and H2B1b. The proposed
method presented a shorter analysis period compared to those described in literature, which is an advantage in quality control. It is a precise, and accurate method with can be used in routine analysis for quality control of gel formulation containing H2B1a and H2B1b.
MATERIAL AND METHODS
Chemicals and reagents
A mixture (98.7% purity) of abamectin H2B1a
(93.8%) and H2B1b (4.9%) was donated by a pharmaceutical company. The gel formulation was a commercially available preparation containing 1% abamectin/ 10 g. Placebo was prepared in the laboratory containing the following excipients: hydroxyethylcellulose (1.00 g), EDTA (0.10 g), methyl paraben (0.20 g) and propyl paraben (0.10 g), imidazolinidyl urea solution 50% (0.60 g) and distilled water q.s.p 100.00 g.
T h e c h r o m a t o g r a p h i c g r a d e m e t h a n o l a n d acetonitrile were purchased from J. T. Baker® (Philipsburg,
USA). Acetic acid was purchased from Vetec® (Rio de
Janeiro, Brazil). Ultrapure water was obtained by using
a Milli-Q® water purification system (Millipore® Co.,
Milford, MA, USA).
The mobile phase consisted of acetonitrile and water
(95:5 v/v) with 1% acetic acid. The low rate was 1.0 mL
min-1 and UV detection was made at 245 nm. Solutions
were prepared in the mobile phase containing 185.2 µg mL-1 H
2B1a and 9.6 µg mL-1 of H2B1b. Instrumentation
The proposed HPLC quantitative method was developed using the following equipment a solvent-delivery
system, an auto-injector itted with a 20 µL loop, an online degasiication system, a column thermostat oven and an
ultraviolet/visible (UV/VIS) with photodiode array detector. The output signal was monitored and integrated using Class-VP® 5.03 software (Shimadzu® Corporation, Kyoto, Japan).
The mobile phase was iltered through a 0.45 µm PTFE
Millipore® membrane (Millipore, Milford, USA). A Mettler
AL204 analytical balance was used to weigh all compounds.
Procedures
Method validation
The method was validated according to the United States Pharmacopeia, 37th ed.(USP, 2014) and International
Conference on Harmonization Guidelines (ICH, 2005).
Analytical curves
Analytical curves for abamectin were obtained using
ive diferent concentration levels, in each of the following
ranges: 148.1 - 222.3 µg mL-1 and 7.7 - 11.5 µg mL-1, for
H2B1a and H2B1b, respectively. Standard solutions were
diluted with mobile phase and determinations were made in triplicate.
System suitability
Standard solutions containing 185.2 µg mL-1 H 2B1a
and 9.6 µg mL-1 H
2B1b abamectin were prepared by dilution
in the mobile phase. System suitability was determined from ten replicate injections of each standard solution.
Precision
Precision was obtained by determining the repeatability and intermediate precision. Repeatability was tested by analyzing six replicates of sample a concentration of 185.2 µg mL-1 H
2B1a and 9.6 µg mL-1 H2B1b. Intermediate
precision was obtained by performing the analysis, in
triplicate on two diferent days using diferent analysts,
using sample solutions in a concentration of 185.2 µg mL-1 H
2B1a and 9.6 µg mL-1 H2B1b. Solutions were iltered
FIGURE 1 - Chemical structures the abamectin homologs (H2B1a
through a 0.45 µm Millipore® (PTFE) membrane before
injection into the HPLC system.
Accuracy
Accuracy was assessed by determining the agreement between measured analyte concentrations of
fortiied and unfortiied sample when a known amount of
standard was added to the sample.
A quantity of 25.0 mg of abamectin standard (H2B1a and H2B1b) was weighed and transferred to a 25 mL volumetric flask. After addition of 20 mL mobile phase, the solution was sonicated for 5 min. The volume was completed with the same solvent (solution A). Final concentration was 1000.0 µg mL-1. Aliquots of 0.8, 1.0 and
1.2 mL were transferred to 5 mL volumetric lasks. The
volumes were completed with mobile phase.
An amount equivalent to 25.0 mg of the placebo gel formulation was weighed and transferred to a 25 mL
volumetric lask. After addition of 20 mL of mobile phase,
the solution was sonicated for 5 min. The volume was completed with the same solvent (solution B). Aliquots
of 1.0 mL were transferred to 5 mL volumetric lasks. The
volumes were completed with mobile phase.
As described in RE 899 placebo solutions were
fortiied by transferring 1.0 mL of sample solution (solution B) to 5 mL volumetric lasks, followed by addition of 0.8,
1.0 and 1.2 mL of standard solution (solution A). The volumes were completed with ultrapure water. Solutions were filtered through a 0.45 µm Millipore® (PTFE)
membrane before injection into the HPLC system.
Stability test
Standard and sample solutions were prepared separately, as previously described, to obtain solutions containing 185.2 µg mL-1 of H
2B1a and 9.6 µg mL-1 of
H2B1b. These solutions were stored at 25°C and triplicate measurements were made during a period of 4 hours.
Robustness test
The UV detection wavelength and mobile phase
composition were deliberately modiied. Mobile phases
consisted of acetonitrile and water (96:4 v/v) with 1% acetic acid and acetonitrile and water (94:6 v/v) with 1% acetic acid. UV detection was performed at 243 and 247 nm. The standard and sample solutions containing 185.2 µg mL-1 H
2B1a and 9.6 µg mL -1 H
2B1b were prepared by
dilution in ultrapure water and injected in triplicate.
Stress testing
Stress testing was made as per Klick et al., 2005. Evaluation was performed in neutral hydrolysis, acid
hydrolysis, alkaline hydrolysis and chemical oxidations. Standardsolution was prepared by transferring 25.0 mg of abamectin to a 25 mL volumetric flask. Samplesolution was prepared by transferring 2500.0 mg of the gel formulation (equivalent to 25.0 mg of
abamectin) to a 25 mL volumetric lask. To the standard
and sample solutions, 20 mL of mobile phase were added and solutions sonicated for 5 min. Volume were completed with the same solvent. Aliquots of 1.0 mL of both solutions were transferred to 5 mL volumetric
lasks. Neutral hydrolysis was performed by adding 1.0
mL of water, chemical oxidations were performed by adding 1.0 mL of 3% H2O2 solution, acid hydrolysis was
performed by adding 1.0 mL of 1 mol L-1 HCl solution
and alkaline hydrolysis was performed by adding 1.0 mL of 1 mol L-1 NaOH solution. After cooling the volumes
were completed with mobile phase. The solutions were heated to 80 ºC for 2 hours. The proposed method was used to analyze sample solutions in a concentration of 185.2 µg mL-1 H
2B1a and 9.6 µg mL -1 H
2B1b. Mobile
phase was iltered through a 0.45 µm PTFE Millipore®
membrane (Millipore, Milford, USA).
RESULTS AND DISCUSSION
Ideal conditions for obtaining a good separation of abamectin homologs (H2B1a and H2B1b) were achieved
using a mobile phase consisting of acetonitrile and water (95:5 v/v) with 1% acetic acid. It was observed that pH
adjustment was not required because the inal pH of the
mobile phase (4.47) was favorable for use considering abamectin pka (Figure 2). Mean retention times (RT) for H2B1a and H2B1b were, 2.6 and 2.3 min, respectively. The
resulting chromatograms can be observed in Figure 4.
Linearity
From analytical data, the responses obtained
FIGURE 2 - Abamectin pkas observed in different pHs
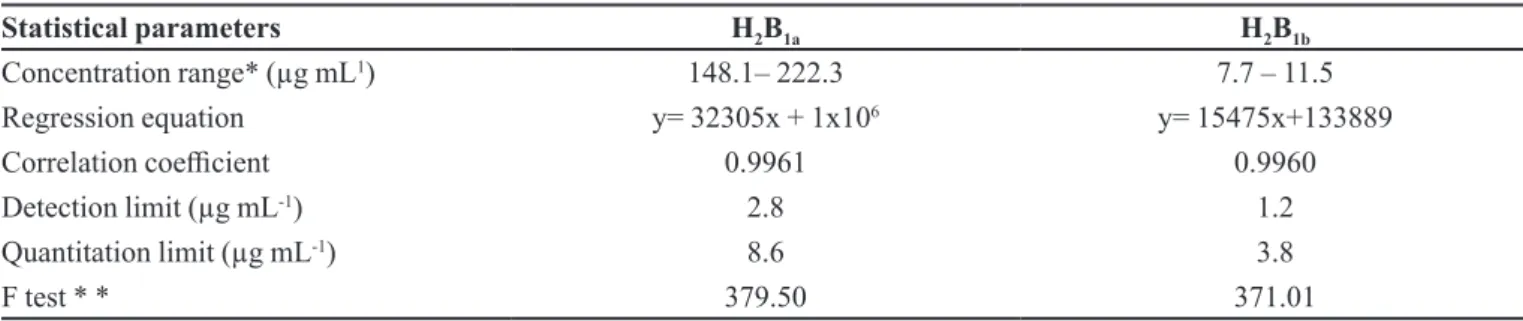
for the two homologs were linear in the concentration ranges from: 148.1– 222.3 µg mL-1 and 7.7 – 11.5 µg
mL-1, for H
2B1a and H2B1b, respectively. These ranges
were used based on ICH (ICH, 2005) which indicates a range from 80 to 120% of the test concentration for
the assay of a drug substance or a inished drug product. Correlation coeicients were 0.9961 for H2B1a and 0.9960
for H2B1b. The F Test was also performed which conirm the proportionality of linear regression, resulting from analysis of variance. The experimental value must be
greater than the default value for a conidence level of 95 % (Pimentel, Barros Neto, 1996). The value obtained
was 10 times larger than the standard value (6.39) (Table I).
As important as the F test is residual analysis (Figure 3), which demonstrates an optimal distribution of
the results (Pimentel, Barros Neto, 1995).
System suitability
Standard solutions were injected, and relative standard deviations (RSD) for each parameter were determined. In all cases, RSD values were less than 2%, which proves the reliability of the proposed analytical method (Table II).
Precision
Precision was obtained by determining repeatability and intermediate precision. The repeatability was conducted by analyzing six replicates of the sample at the concentration of 85.2 µg mL-1 H
2B1a and 9.6 µg
mL-1 H
2B1b. Relative standard deviation (RSD) was
determined. Intermediate precision was obtained by analyzing triplicates of the sample in the concentration of 185.2 µg mL-1 H
2B1a and 9.6 µg mL -1 H
2B1b. The RSD
was determined after triplicate analysis of samples on two
TABLE I - Linear regression data obtained in the analyses of abamectin homologs H2B1a and H2B1b using the proposed HPLC method
Statistical parameters H2B1a H2B1b
Concentration range* (µg mL1) 148.1– 222.3 7.7 – 11.5
Regression equation y= 32305x + 1x10⁶ y= 15475x+133889
Correlation coeicient 0.9961 0.9960
Detection limit (µg mL-1) 2.8 1.2
Quantitation limit (µg mL-1) 8.6 3.8
F test * * 379.50 371.01
* n= 5; * * value of 95%, 6.39.
FIGURE 3 - Residual analysis of abamectin (H2B1a and H2B1b).
TABLE II - System suitability test results using inal concentration
of the sample solution: 185.2 µg mL-1 H
2B1a and 9.6 µg mL-1 H2B1b
Parameters H2B1a* H2B1b*
Retention time 2.61± 0.38 2.28± 0.26
Area 6602238± 0.80 465191± 0.65
Peak height 854701± 0.84 24642± 0.68
Theoretical plates 4646± 0.48 4692± 0.51
Capacity factor 1.44± 0.45 1.13± 0.50
Assimetry 1.25± 0.00 1.33± 0.00
diferent days using two diferent analysts. The method
presented good results for precision (Table III).
Accuracy
Recovery was evaluated by adding known amounts of abamectin H2B1a and H2B1b standard solutions to the
abamectin gel sample. Recovery was evaluated at three
diferent concentration levels. Triplicate determinations
were performed at each concentration. Average recoveries of 98.62% ± 0.23 for H2B1a and 100.06% ± 0.95 for
H2B1b, at three different concentration levels were obtained, indicating good accuracy for the proposed chromatographic method (Table IV).
Specificity
The placebo solution was prepared and analyzed using the proposed HPLC method. Results were compared with those obtained in the analyses of standard and sample. The excipients did not interfere in the method.
The method was considered speciic for the simultaneous
determination of abamectin homologs H2B1a and H2B1b in gel formulation (Figure 4).
Detection limit (DL) and quantitation limit (QL)
The DL and QL were determined based on the standard deviation between response and slope of the curve. The theoretically obtained values for QL were cross-checked by performing analyses using the proposed HPLC method. DLs were 2.8 µg mL-1 and 1.2 µg mL-1,
and QLs were 8.6 µg mL-1 and 3.8 µg mL-1, for H
2B1a and
H2B1b, respectively (Table I).
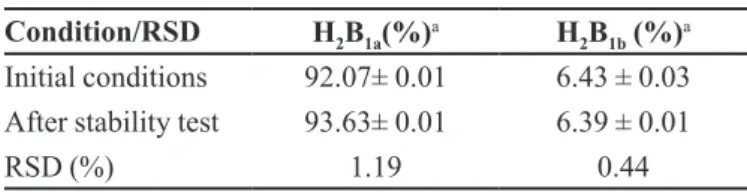
Stability of solutions
It is essential to evaluate the stability of standard and sample solutions to obtain reliable results. Standard and sample solutions were stored at 25 °C for 4 hours and after analyses the obtained results were compared with those
obtained using freshly prepared solutions. No diferences
were observed in the instrumental responses under the described conditions. The RSDs obtained in the stability test were 1.19% and 0.44%, respectively for H2B1a and H2B1b (Table V), which were similar to those obtained using freshly prepared solutions.
Robustness
Deliberate changes in analytical parameters, did not
lead to signiicant changes in the instrumental responses,
and RSDs values were less than 2% in all cases. When the
TABLE III - Precision analysisresults obtained for the proposed
HPLC method for determining abamectin homologs H2B1a and H2B1b in gel formulation
Precision H2B1a(%) H2B1b (%)
Repeatability a 92.29 ± 0.65 6.37 ± 0.06
RSD (%) 0.88 1.16
Intermediate precision b 92.07± 0.01 6.43 ± 0.03
93.52± 0.01 6.57 ± 0.08
Mean value 92.80 6.50
RSD (%) 1.10 1.52
a arithmetic mean value (n = 6); b arithmetic mean value (n = 2)
TABLE IV - Recovery results for abamectin H2B1a and H2B1b
homolog standard solutions added to sample and analyzed by the proposed HPLC method
Compound Added amount (µg mL-1)
Found amount (µg mL-1)
Recovery ( %)
H2B1a
150.62 187.53 225.13
148.15 ± 0.77 185.26 ± 0.01 222.27 ± 1.04
98.36 98.79 98.72
H2B1b
7.70 9.57 11.64
7.70 ± 0.07 9.67 ± 0.01 11.54 ± 0.01
100.00 101.04 99.14
FIGURE 4 - Chromatograms of placebo, standard, sample
and mobile phase solutions. Chromatographic conditions: concentrations: 185.2 µg mL-1 for H
wavelength was changed to 243 nm, the obtained RSDs were 0.86% and 0.99% and when changed to 247 nm, were 0.47% and 1.74% for H2B1a and H2B1b, respectively.
When mobile phase composition was changed to 96:4 v/v acetonitrile and water with 1% acetic acid, RSDs were 0.10% and 0.44% for H2B1a and H2B1b, respectively. When changed to 94:6 v/v acetonitrile and water with 1% acetic acid, RSDs were 0.62% and 0.88% for H2B1a and H2B1b, respectively. All results obtained in the robustness test were similar to those under initial conditions. Thus, the proposed method can be considered reliable and robust.
Stress testing
Stress testing studies are used to assess drug substance and drug product stability to provide information
on possible degradation pathways, and to demonstrate the stability-indicating capability of the analysis methods used. These studies are performed under more drastic conditions than those used for accelerated stability tests(Klick et al., 2005). Stress testing was conducted using neutral, acid and alkaline hydrolysis and chemical oxidation. After chemical oxidation and neutral hydrolysis, the results showed no significant changes in peak degradation,
however, a diferent retention time was observed for the
H2B1a standard substance. After both acid and alkaline hydrolysis, degradation was observed in both standard and sample substances (Figure 4).
T h e p r o p o s e d m e t h o d w a s a p p r o p r i a t e f o r determining of abamectin homologs, H2B1a and H2B1b
, in the presence of their degradation products, since
all compounds could be separated, as seen in the chromatograms. Thus, the proposed HPLC method can be used in quality control as a stability- indicating method.
CONCLUSION
There are few methods described in literature for simultaneous quantitative determinationof abamectin homologs H2B1a and H2B1b. Most methods described in literature just quantify total abamectin fraction.
The proposed HPLC method is simple, economic and
TABLE V - Results from the stability test for abamectin H2B1a
and H2B1b
Condition/RSD H2B1a(%)a H
2B1b (%)
a
Initial conditions 92.07± 0.01 6.43 ± 0.03
After stability test 93.63± 0.01 6.39 ± 0.01
RSD (%) 1.19 0.44
a n= 3
FIGURE 5 - Representative chromatograms standard reference homologs and sample solutions after stress testing. Concentration:
185.2 µg mL-1 H
eicient for the separation and quantitative determination
of the two homologsin gel formulation, and can thus be considered an important tool in quality control. The advantage of the proposed method over those described
in scientiic literature is the speed, leading to economy of
solvents. It is very important to quantify these homologs
as abamectin was identiied as probable cause of adverse efects in the aquatic environment, even when present in
low concentrations (Cerkvenik-Flajsa et al., 2010). The excipients did not interfere in the analyses proving that the method presents selectivity. The proposed HPLC method proved to be useful and reliable and can be used to indicate the stability of routine analyses in quality control laboratories.
REFERENCES
BORGES, J.H.; RAVELO-PÉREZ, L.M.; HERMÁNDEZ-SUÁREZ, E.M.; CARNERO, A.;
RODRIGUÉZ-DELGADO, M. A. Determination of abamectin residues in avocados by microwave-assisted extraction and HPLC with
luorescence detection. Chromatogr., v.67, p.69-75, 2008.
CAMPILO, N.; VIÑAS, P.; FEREZ-MELGAREJO, G.; HERMÁNDEZ–CORDOBA, M. Dispersive liquid–liquid
microextraction for the determination of macrocyclic lactones in milk by liquid chromatography with diode array detection and atmospheric pressure chemical ionization ion-trap tandem mass spectrometry. J. Chromatogr. A, v.1282, p.20-26, 2013.
CERKVENIK-FLAJSA, V.; MILCINSKIA, L.; SUSSINGERA, A.; HODOSCEKA, L.; DANAHERB, M.; ANTONÍC, J.
Trace analysis of endectocides in milk by high performance
liquid chromatography with luorescence detection. Anal. Chim. Acta, v.663, p.165-171, 2010.
CHEMICALIZE. Abamectin. 2016. Disponível em: <http:// http://www.chemicalize.org/structure/#!mol=abamectin&
source=fp>. Acesso em: 01 abr. 2016.
DISERENS, H.; HENZELIN, M. Determination of abamectin
residues in fruits and vegetables by high-performance liquid chromatography J. Chromatogr. A, v.833, p.13-18, 1999.
INTERNATIONAL CONFERENCE ON HARMONISATION.
ICH. Validation of Analytical Procedures: Text and methodology Q2(R1). Geneva: ICH, 2005. Available at: <http://www.ich.org/fileadmin/Public_Web_Site/ ICH_Products/Guidelines/Quality/Q2_R1/Step4/Q2_R1__
Guideline.pdf>. Accessed on: 16 Jul. 2015.
ISMAIL, R.; LEE, H.Y.; MAHYUDIN, N.A.; BAKAR, F.A. Linearity study on detection and quantiication limits for
the determination of avermectins using linear regression.
J. Food Drug Anal., v.22, p.407-412, 2014.
KLICK, S.; PIM, G.; MUIJSELAAR.; WATERVAL, J.;
EICHINGER, T.; KORN, C.; GERDING, G.K.; DEBETS, A.J.; GRIEND, C.S.; BELD, C.; SOMSEN, G.W.; JONG.;
C.J. Toward a generic approach for stress testing of drug substances and drug products. Pharm. Technol., v.29, p.48-66, 2005.
KOLAR, L.; KUZNER, J.; ERZEN, N.K. Determination of
abamectin and doramectin in sheep faeces using HPLC
with luorescence detection. Biomed. Chromatogr., v.18, p.117-124, 2004.
KULIK, A.; SZC OTKOWSKA, A.; BIALECKA, W.;
PODOLKA, M.; KWIATKOW-PUCHNIARZ, B.;
MAZUREK, A. Determination of active substances in binary mixture antiparasitc veterinary by HPLC. Acta Pol. Pharm., v.68, p.467-472, 2011.
LIU, H.; ZHANG, Y.; LIU, L.; LI, Q.; SHAO, J.; ZOU, Y. Fast
separation ultra-performance liquid chromatography for determination of pre-column derivative abamectin and ivermectin residues in vegetable. J. Fluoresc., v.21, p.825-829, 2011.
MARKUS, J.; SHERMA, J. Liquid chromatography luorescence
determination of ivermectin in animal tissue and plasma.J. AOACInt., v.75, p.757-767, 1992.
PIMENTEL, M.F.; BARROS NETO, B. Calibração: uma
revisão para químicos analíticos. Quím. Nova, v.19, n.3, p.268-277, 1996.
POZO, O.J.; J. MARIN, J. M.; SANCHO, J.V.; HERNÁNDEZ,
F. Determination of abamectin and azadirachtin residues in orange samples by liquid chromatography-electrospray tandem mass spectrometry J. Chromatogr. A, v.992, p.133-140, 2003.
RAHMAN, M.M.; NA, T.W.; EL-ATY.; PARK, J.H.; MAHMUD, M.N.U.; YANG, A.; PARK, K.H.; SHIM,
ROMERO-GONZÁLEZ, R.; AGUILERA-LUIZ, M.M.; PLAZA-BOLÃNOS, P.; FRENICH, AG.; VIDAL,
J.L.M. Food contaminant analysis at high resolution mass spectrometry: application for the determination of veterinary drugs in milk. J. Chromatogr. A, v.1218, p.9353-9365, 2011.
RÜBENSAM, G.; BARRETO, F.; HOOF, R.B.; KIST,
T.L.; PIZZOLATO, T.M. A liquid-liquid extraction procedure followed by a low temperature purification step for the analysis of macrocyclic lactones in milk by liquid chromatography-tandem mass spectrometry and
luorescence detection. Anal. Chim. Acta, v.705, p.24-29, 2011.
SOUZA, S.V.C.; SILVA, G.; DINIZ, M.H.G.M.; SANTOS,
E.V.; LIMA, J.A.; TEODORO, J.C. Determination of avermectins residues in bovine liver by high performance liquid chromatography. Ciênc. Tecnol. Alim., v.23, p.54-58, 2003.
SHOOP, W.L.; MROZIK, H.; FISHER, M.H. Structure and activity of avermectins and milbemycins in animal health.
Vet. Parasitol., v.59, p.139-156, 1995.
TAO, Y.; YU, G.; CHEN, D.; PAN, Y.; LIU, Z.; WEI, H.; PENG, D.; HUANG, L.; WANG, Y.; YUAN, Z. Determination of 17
macrolide antibiotics and avermectins residues in meat with accelerated solvent extraction by liquid chromatography– tandem mass spectrometry. J. Chromatogr. B, v. 897, p. 64-71, 2012.
THOMPSON, T.S.; NOOT, D.K.; FORREST, F.; HEEVER, J.P.V.D.; KENDALL, J.; KEENLISIDE, J. Large volume
injection for the direct analysis of ionophores and avermectins in surface water by liquid chromatography– electrospray ionization tandem mass spectrometry. Anal. Chim. Acta, v.633, p.127-135, 2009.
TISLER, T.; ERZEN, N.K. Abamectin in the aquatic
environment. Ecotoxicology, v.15, p.495-502, 2006.
UNITED STATES PHARMACOPEIA. USP. 37. ed. Rockville,
United States: Pharmacopeial Convention, 2014. p.1157-1162.
VALENZUELA, A.I.; REDONDO, M.J.; PICO, Y.; FONT,
G. Determination of abamectin in citrus fruits by liquid chromatography–electrospray ionization mass spectrometry.
J. Chromatogr. A, v.871, p.57-65, 2000.
XIAOLIN, H.; JIANG, H.; DING, S.; ZHAND, S.; LI, X.; SHEN, J. Multiresidue analysis of avermectins in cattle
liver by liquid chromatography/ tandem mass spectrometry.
J. AOAC Int., v.89, p.1110-1115, 2006.
XIE, X.; GONG, S.; WANG, X.; WU, Y.; ZHAO, L. Simpliied
RP-HPLC method for multi-residue analysis of abamectin, emamectin benzoateand ivermectin in rice. Food Addit. Contam., v.28, p.19-25, 2011.
YOSHII, K.; ISHIMITZU, S.; TONOGAI, Y.; ARAKAWA, K.;
MURATA, H.; MIKAMI, H. Simultaneous determination of emamectin, its metabolites, mibemectin, ivermectin and abamectin, in Japanese radish and tea by LC/MS. J. Health Sci., v.50, p.17-24, 2004.