*Correspondence: KLE University’s College of Pharmacy,.2nd Block, Rajaji-nagar, 560010 - Bangalore - Karnataka, India. E-mail: [email protected]
A
vol. 50, n. 4, oct./dec., 2014 http://dx.doi.org/10.1590/S1984-82502014000400015
Optimization and validation of an RP-HPLC method for the
estimation of 6-mercaptopurine in bulk and pharmaceutical
formulations
Vanita Somasekhar
*KLE University’s College of Pharmacy, Bangalore, Karnataka, India
A reverse phase HPLC method is described for the determination of 6-mercaptopurine in bulk and tablets. Chromatography was carried on a C18 column using a mixture of acetonitrile and 0.05 mol/L sodium
acetate buffer (10:90 v/v) as the mobile phase at a low rate of 1 mL/min-1 with detection at 324 nm.
The retention time of the drug was 3.25 min. The detector response was linear in the concentration of 0.01-5 μg/mL. The limit of detection and limit of quantiication were 17 and 52 ng/mL respectively. The method was validated by determining its sensitivity, linearity, accuracy and precision. The proposed method is simple, economical, fast, accurate and precise and hence can be applied for routine quality control of mercaptopurine in bulk and tablets.
Uniterms: 6-Mercaptopurine/determination. High perfomance liquid chromatography/reverse phase/ quantitative analysis. Pharmaceutical formulations/quality control
Descreve-se método de CLAE em fase reversa para a determinação de mercaptopurina a granel e em comprimidos. A cromatograia foi realizada em coluna C18, utilizando mistura de acetonitrila em tampão acetato de sódio 0,05 mol/L (10:90 v/v) como fase móvel, com luxo de 1 mL/min e detecção a 324 nm. O tempo de retenção do fármaco foi de 3,25 min. A resposta do detector foi linear na concentração de 0,01-5 μg/mL. O limite de detecção e o limite de quantiicação foram de 17e 52 ng/mL, respectivamente. O método foi validado pela determinação de sua sensibilidade, linearidade, acurácia e precisão. O método proposto é simples, econômico, rápido, acurado e preciso e, então, pode ser aplicado para controle de qualidade de rotina da mercaptopurina em batelada e em comprimidos.
Unitermos: Mercaptopurina/determinação. Cromatograia líquida de alta eiciência/fase reversa/análise quantitativa. Formulações farmacêuticas/controle de qualidade.
INTRODUCTION
6-Mercaptopurine (Figure 1) is an anti-cancer (“antineoplastic” or “cytotoxic”) chemotherapy drug. In Cancerous tumors, cell division is no longer controlled as it is in normal tissue. When “Normal” cells come into contact with like cells, they stop dividing. This mechanism is called contact inhibition. Cancerous cells do not have this ability. Chemotherapy kills cancer cells by halting cell division. Chemotherapy has been found to be most effective at killing cells that are rapidly dividing. But, since chemotherapy cannot distinguish between the cancerous
cells and the normal cells, both are affected. Hence side effects occur until the “normal” cells grow back and be healthy.
6 - M e r c a p t o p u r i n e b e l o n g s t o t h e c l a s s o f chemotherapy drugs called “antimetabolites”. When antimetabolites are incorporated into cellular metabolism
N
N N
H N SH
by cells, they are unable to divide. Antimetabolites attack cells at very speciic phases in the cycle. 6-Mercaptopurine is converted to 6-thioinosinic acid, which acts as an antimetabolite to inhibit synthesis of adenine and guanine and also to prevent conversion of purine bases into nucleotides. Some 6-mercaptopurine is also converted to thioguanine, which is incorporated into both DNA and RNA to generate defective nucleic acids. Thus the synthesis of nucleic acid and its functions are impaired in several ways and cell mitosis is inhibited. The purine antagonist 6-mercaptopurine (6-MP) has been used as a chemotherapy drug and is usually given orally. When higher doses are required, the drug may be given intravenously. Patients suffering from acute lymphocytic or myelocytic leukemia, lymphoblastic leukemia (especially in childhood cases) and acute myelogenous and myelomonocyticleukemias are often given 6-MP in combination with other chemotherapy drugs. In addition to its role in cancer treatment, 6-MP is used to treat patients suffering from a variety of inflammatory bowel diseases. The drug is also used to prevent rejection following organ transplants.
Since 6-MP is widely used in chemotherapy, it is important to develop and validate analytical methods for its determination in pharmaceutical dosage forms. Review of literature has revealed that all methods reported for the estimation of 6-MP are useful in estimating 6-MP in biological samples (Sorouraddin et al., 2011; Hawwa
et al., 2009; Umrethia et al., 2006; Oliveira et al., 2004; Su et al., 1999; Mawatari et al., 1998; Sahnoun et al., 1990; Erdmann,Chan, Canafax, 1988; Rudy et al., 1988; Migulla,Prumke, Huller, 1987). So far no systematic HPLC method has been reported for determination of 6-MP in pharmaceutical formulations. This paper reports a rapid and sensitive HPLC method with UV detection, useful for routine quality control of 6-MP in pharmaceutical formulations. The method was validated by parameters such as linearity, accuracy, precision and robustness.
MATERIAL AND METHODS
Apparatus
The HPLC used consisted of Hitachi chromatographic system equipped with a Hitachi pump L-7110, Rheodyne universal injector 7725 and Hitachi L-7400 UV-visible detector. The chromatographic studies were performed using Phenomenex® C
18, 5 μm, 250 mm x 4.6 mm i.d.
column, at ambient temperature. Peak area integration was performed using Winchrom software. A Shimadzu model 1700 double beam UV-visible spectrophotometer
with a pair of 10 mm matched quartz cells was employed for determination of absorption maximum.
Reagents and chemicals
HPLC grade acetonitrile and glacial acetic acid were obtained from Rankem (Mumbai, India) and sodium acetate (A.R. grade) was obtained from Sd Fine Chemicals, Mumbai, India. Pure sample of drug was obtained from Sigma Aldrich, India. Ultra-pure water obtained from Milli-Q academic system (Millipore Pvt. Ltd., Bangalore, India) was used to prepare all solutions for the method.
Chromatographic conditions
The process was carried out on C18 column (5 μm, 250 x 4.6 mm, i.d) using the mobile phase consisting of acetonitrile and 0.05 M sodium acetate buffer in the ratio 10:90 with pH adjusted to 6.8 using HPLC grade glacial acetic acid at a low rate of 1 mL/min. Wavelength was ixed at 324 nm. The mobile phase was iltered through 0.45 μm membrane ilter and degassed.
Preparation of solutions
Stock standard solution of the pure drug was prepared by dissolving 100 mg of 6-MP in 100 mL volumetric lask using 0.1 mol/L sodium hydroxide. Then the volume was made up to the mark with the same solvent to give a inal concentration of 1000 μg/mL. Nine standard solutions of 6-MP in the range of 0.01-5.0 μg/mL (0.01, 0.05, 0.1, 0.5, 1.0, 2.0, 3.0, 4.0, 5.0 μg/mL) were prepared by subsequent dilution with mobile phase.
Validation
Three series of standard solutions in the range of 0.01-5.0 μg/mL were prepared and analyzed as described above. Calibration curves were constructed using three series of standard 6-MP solutions in the range of 0.01-5.0 μg/mL. Peak area was recorded for all the peaks and a calibration graph was obtained by plotting peak area
versus concentration of 6-MP. To establish the accuracy and intra-day and inter-day precision of the method, six replicate solutions at three different concentrations (0.5, 1.0, 2.5 μg/mL) were assayed on single day and three separate days.
Assay method
of powder equivalent to100 mg of 6-MP was accurately weighed, transferred to a 100 mL volumetric lask, made up to volume with 0.1 mol/L sodium hydroxide and placed in an ultrasonic bath for 20 min. After iltration through a 0.45 μm membrane ilter, the solution was suitably diluted with mobile phase to obtain the required concentration.
20 μL of solution was injected into the HPLC system to obtain the chromatograms for the standard drug solution and the sample solution.
A steady baseline was recorded with the optimized chromatographic conditions. The standard solution of 6-MP was injected and the chromatogram recorded. The retention time of 6-MP was found to be 3.25 min. The sample solution prepared from the tablets was then injected and the amount of drug present was calculated from the calibration curve.
RESULTS AND DISCUSSION
Chromatographic conditions
Various compositions of mobile phase consisting of acetonitrile and sodium acetate (50:50 to 10:90) were used in the study and the composition of 10:90 was selected as it gave best elution, reasonable retention time and least tailing. A pH 6.8 was found to give the best elution, while increased tailing was observed at lower pH values. Flow rates between 0.5 and 1.5 were studied and a low rate of 1 ml/min was found to give a good separation time and peak shape.
The typical chromatogram obtained for 6-MP is presented in Figure 2.
Linearity
Calibration curves were constructed using three series of standard 6-MP solutions in the range of
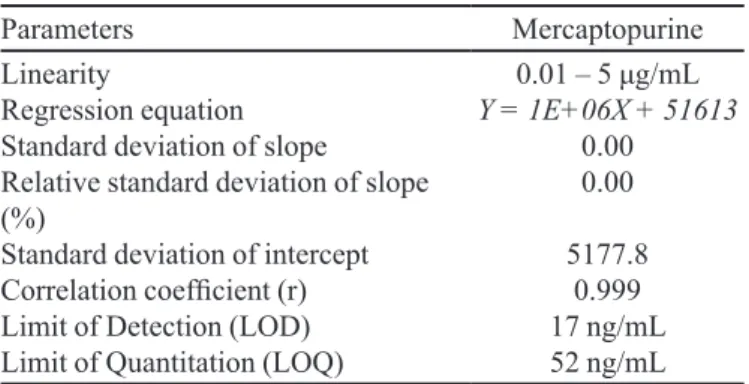
TABLE I - Statistical data of calibration curves of mercaptopurine
Parameters Mercaptopurine
Linearity
Regression equation Standard deviation of slope
Relative standard deviation of slope (%)
Standard deviation of intercept
Correlation coeficient (r)
Limit of Detection (LOD) Limit of Quantitation (LOQ)
0.01 – 5 μg/mL
Y = 1E+06X + 51613
0.00 0.00
5177.8
0.999
17 ng/mL
52 ng/mL
FIGURE 2 - Chromatogram of 6-MP.
0.01-5.0 μg/mL. The equation of linear regression and statistical data are presented in Table I. The linearity of the calibration curve was validated by the high value of the correlation coeficient (r=0.9997).
Limit of detection (LOD) and limit of quantification (LOQ)
The limit of detection and the limit of quantiication are deined as LOD=3.3 σ/s and LOQ=10 σ/s respectively, where σ denotes standard deviation of y-intercepts of regression lines and s denotes slope of the corresponding calibration curve (ICH 2005).
The limit of detection was determined as 17 ng/mL. The limit of quantification was determined as 52 ng/mL.
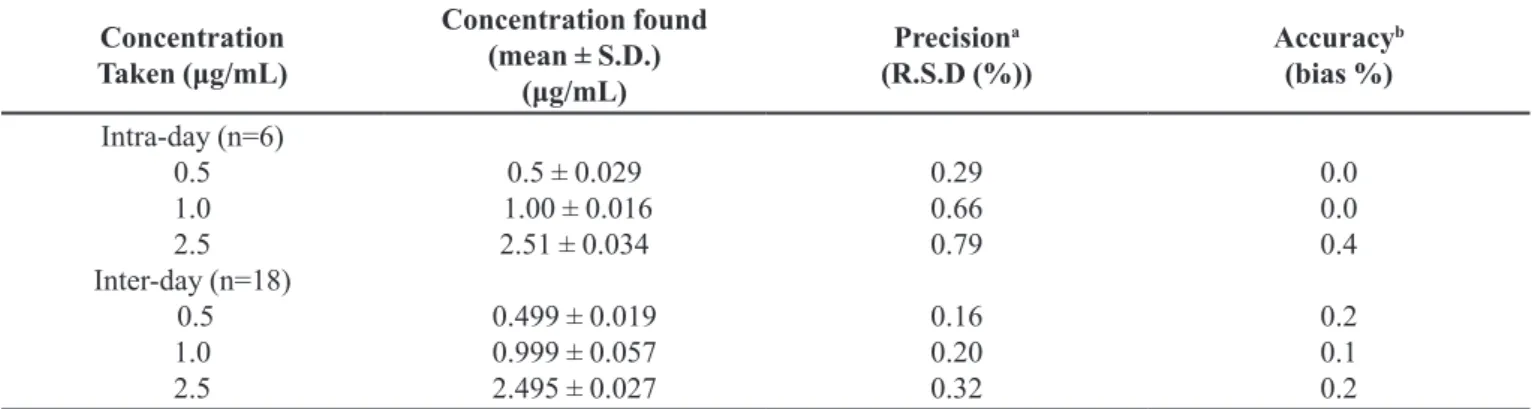
Precision
The assay was investigated with respect to system suitability test, method precision and intermediate precision. The system suitability test and method precision were carried out to monitor repeatability and reproducibility.
In order to measure repeatability of the system (system suitability test), ive consecutive injections were made and the results were evaluated by considering peak area values of 6-MP. The precision values with their R.S.D. are shown in Table II. The results in Table II indicate that the R.S.D.(%) is less than 2%.
Accuracy and recovery studies
The accuracy of a method is expressed as the closeness of agreement between the value found and the value that is accepted as a reference value. It is determined by calculating the percent difference (bias%) between the measured mean contents and the corresponding nominal contents(Braggio et al., 1996). Table II shows the results obtained for intra- and inter-day accuracy.
The accuracy of the proposed method was also tested by recovery experiments. Recovery experiments were performed by taking different sample concentrations and spiking with 6-MP at two different concentration levels (50% and 100% 6-MP). Six samples were prepared for each recovery level. Samples were treated as described in the procedure for sample preparations. The results obtained are shown in Table III, from which it is clear that both the recoveries and repeatabilities are excellent.
Robustness
Robustness relates to the capacity of the method to remain unaffected by small but deliberate variations introduced into the method parameters. Inluences of small changes in the mobile phase composition (±10%), pH (±0.5) and low rate (±10%) were studied to determine robustness
of the method. Peak areas and retention time changes were observed. It was found that Peak area values and retention time values varied by less than 2%. Despite the changes in retention time there was no problem for quantiication.
Specificity
The specificity test of the proposed method demonstrated that the excipients from marketed capsules did not interfere in the drug peak. Furthermore, well-resolved peak indicates the specificity of the method (Figure 2).
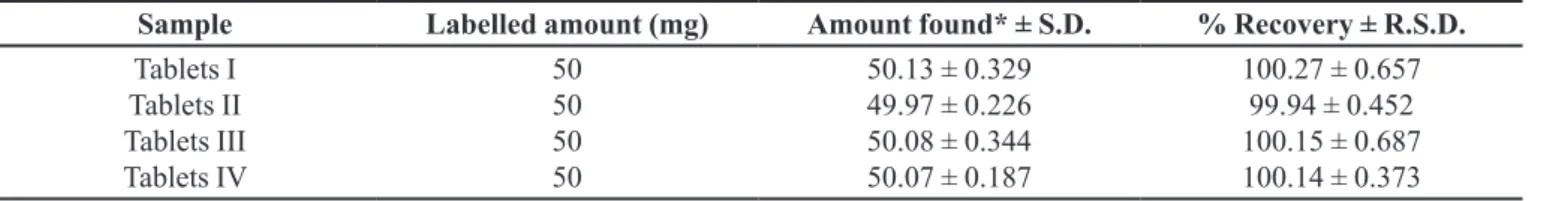
Analysis of pharmaceutical formulation
In order to evaluate the applicability and reliability of the proposed methodology, it was applied to the determination of 6-MP in tablets. Satisfactory results were obtained and were found to be in agreement with label claims (Table IV).
CONCLUSION
T h e p r o p o s e d h i g h - p e r f o r m a n c e l i q u i d chromatographic method has been evaluated for linearity, precision, accuracy, speciicity and proved to be
TABLE II - Precision and accuracy of method for determination of 6-MP (n=18; six sets for 3d)
Concentration
Taken (μg/mL)
Concentration found
(mean ± S.D.) (μg/mL)
Precisiona
(R.S.D (%)) Accuracy
b (bias %) Intra-day (n=6)
0.5 1.0 2.5
Inter-day (n=18)
0.5 1.0 2.5
0.5 ± 0.029 1.00 ± 0.016 2.51 ± 0.034
0.499 ± 0.019
0.999 ± 0.057 2.495 ± 0.027
0.29 0.66
0.79
0.16 0.20 0.32
0.0 0.0 0.4
0.2 0.1 0.2 a R.S.D.(%) : relative standard deviation; bbias(%) : [(found – taken)/taken] x 100
TABLE III- Recovery Data for the Proposed RP-HPLC method (n=6)
Pharmaceutical formulations Amount (μg/mL) % Recovery ±R.S.D.
Taken + Added Found* ± S.D.
Tablets I Tablets II Tablets III Tablets IV
0.5 + 0.25 0.5 + 0.5 1.0 + 0.5 1.0 + 1.0
0.751 ± 0.002
1.002 ± 0.006
1.500 ± 0.007
2.008 ± 0.008
100.13 ± 0.326
100.18 ± 0.617 100.00 ± 0.471 100.40 ± 0.417
TABLE IV - Analysis of 6-MP from pharmaceutical formulations by proposed method
Sample Labelled amount (mg) Amount found* ± S.D. % Recovery ± R.S.D.
Tablets I Tablets II Tablets III Tablets IV
50 50 50 50
50.13 ± 0.329
49.97 ± 0.226
50.08 ± 0.344
50.07 ± 0.187
100.27 ± 0.657
99.94 ± 0.452
100.15 ± 0.687 100.14 ± 0.373
*Average of six determinations
convenient and effective for the quality control of 6-MP in given application. The measured signal was shown to be precise, accurate, and linear over the concentration range tested (0.01-5.0 μg/mL) with a correlation coeficient better than 0.9997. Moreover, the lower solvent consumption leads to a cost effective and environmentally friendly chromatographic procedure. Thus, the proposed methodology is rapid, selective, requires a simple sample preparation procedure, and represents a good procedure of 6-MP determination in pharmaceutical dosage forms.
REFERENCES
BRAGGIO, S.; BARNABY, R.J.; GROSSI, P.; CUGOLA, M. A strategy for validation of bioanalytical methods. J. Pharm. Biomed. Anal., v.14, n.4, p.375-388, 1996.
ERDMANN, G.R.; CHAN, G.L.C.; CANAFAX, D.M. HPLC determination of 6-thiouric acid and 6-mercaptopurine in organ transplant patient serum. J. Liq. Chromatography Rel. Technol., v.11, n.4, p.971-981, 1988.
HAWWA, A.F.; MILLERSHIP, J.S.; COLLIER, P.S. MCELNAY, J.C. Development and validation of an HPLC method for the rapid and simultaneous determination of 6-mercaptopurine and four of its metabolites in plasma and red blood cells. J. Pharm. Biomed. Anal., v.49, n.2, p.401-409, 2009.
INTERNATIONAL CONFERENCE ON HARMONISATION O F T E C H N I C A L R E Q U I R E M E N T S F O R REGISTRATION OF PHARMACEUTICALS FOR HUMAN USE. ICH harmonised tripartite guideline: validation of analytical procedures: text and methodology Q2(R1). ICH. p.1-13, 2005.
MAWATARI, H.; KATO, Y.; NISHIMURA, S.; SAKURA, N.; UEDA, K. Reversed-phase high-performance liquid chromatographic assay method for quantitating 6-mercaptopurine and its methylated and non-methylated metabolites in a single sample. J. Chromatogr. B Biomed. Sci. Appl., v.716, n.1-2, p.392-396, 1998.
MIGULLA, H.; PRUMKE, H-J.; HULLER, H. Determination of 6-mercaptopurine in human plasma with HPLC.
Pharmazie, v.42, n.5, p.346-347, 1987.
OLIVEIRA, B.M.; ROMANHA, A.J.; VIANA, M.B.; ZANI, C.L. An improved HPLC method for the quantitation of 6-mercaptopurine and its metabolites in red blood cells.
Braz. J. Med. Biol. Res.,v.37, n.5, p.649-658, 2004.
RUDY, J.L.; ARGYLE, J.C.; WINICK, N.; VAN DREAL, P. HPLC analysis of 6-mercaptopurine and metabolites in
extracellular body luids. Ann. Clin. Biochem., v.25, n.5,
p.504-509, 1988.
S A H N O U N , Z . ; S E R R E - D E B E A U VA I S , F. ; L A N G , J.; FAUCON, G.; GAVEND, M. Determination of 6-mercaptopurine and its metabolites in plasma or serum by high performance liquid chromatography. Biomed. Chromatogr., v.4, n.4, p.144-147, 1990.
SOROURADDIN, M-H.; KHANI, M-Y.; AMINI, K.; NASERI, A.; ASGARI, D.; RASHIDI, M-R. Simultaneous determination of 6-mercaptopurine and its oxidative metabolites in synthetic solutions and human plasma using spectrophotometric multivariate calibration methods.
Bioimpacts, v.1, n.1, p.53-62, 2011.
SU, Y.; HON, Y.Y.; CHU, Y.; VAN DE POLL, M.E.; RELLING, M.V. Assay of 6-mercaptopurine and its metabolites in patient plasma by high-performance liquid chromatography with diode-array detection. J. Chromatogr. B Biomed. Sci. Appl., v.732, n.2, p.459-468, 1999.
UMRETHIA, M.L.; GHOSH, P.K.; MAJITHIYA, R.J.; MURTHY, R.S.R. New RP-HPLC method for the estimation of 6-mercaptopurine in rat plasma and various tissue homogenates. J. Liq. Chromatography Rel. Technol., v.29, n.1-4, p.55-67, 2006.