Article
J. Braz. Chem. Soc., Vol. 26, No. 4, 797-803, 2015. Printed in Brazil - ©2015 Sociedade Brasileira de Química 0103 - 5053 $6.00+0.00
A
*e-mail: [email protected]
Validation of a High Performance Liquid Chromatography Method for Aflatoxins
Determination in Corn Arepas
Marcela Martínez-Miranda,*,a Gonzalo Taborda-Ocampob and Milton Rosero-Moreanob
aDepartamento de Ingeniería and bDepartamento de Química,
Universidad de Caldas, Calle 65 No. 26-10, Manizales, Colombia
Aflatoxins are toxic metabolites produced by Aspergillus species in raw materials and foodstuffs from agricultural sources. Due to the fact that aflatoxins are potentially carcinogenetic, it is important to have reliable analytic methods that allow determining their levels in food matrices. The main aim of this investigation was to validate the method for aflatoxins determination by high performance liquid chromatography in corn arepas, which are widely consumed in the Colombian coffee region. The evaluated parameters were robustness, selectivity, linearity, sensitivity, repeatability, intermediate precision and recovery. The methodology was successfully validated with and optimal selectivity, linearity > 0.9998, limits of detection and quantification lower than 0.10 µg kg−1, relative standard deviation < 4.5% and recovery > 76.6%. Also, 144 corn
arepas samples were analyzed and aflatoxins were found in 9.72% of them, with levels between 0.95 and 11.56 µg kg−1.
Keywords: validation, liquid chromatography, food analysis, aflatoxins, corn arepas
Introduction
Aflatoxins (AF) are toxic secondary metabolites produced by Aspergillus flavus and Aspergillus parasiticus
in foods and feeds from agricultural sources.1 Up to date, approximately 20 aflatoxins have been identified, but the most frequent in foods like corn, peanut, nuts, rice, cereals and cotton cake are AFB1, AFB2, AFG1 and AFG2.2 This toxins have drawn a lot of attention due to their carcinogenetic potential,3 mainly AFB
1 classified in the IA group by the International Agency for Research on Cancer (IARC) as human carcinogen due to its hepatotoxicity.4 For this reason, regulations regarding aflatoxins maximum levels have been established in 100 countries, which demands the availability of reliable laboratory methods that allow to determine the contamination level by aflatoxins in food matrices of high consumption to ensure their quality and to control possible public health risks.
Given the broad array of contamination susceptible matrices, the possible concurrence of various mycotoxins and the wide concentrations range, it is necessary to validate the methods to determine the aflatoxins levels in foods. A large number of analytic techniques have been developed for mycotoxins analyses in foods,5 among them thin layer
chromatography (TLC),6 enzyme-linked immunosorbent assay (ELISA),7 gas chromatography (GC)8 and liquid chromatography (LC) with various detectors.9 Nevertheless, so far, high performance liquid chromatography (HPLC) coupled to a fluorescence detector, has been the most used technique due to its high sensitivity and low costs.10
The corn arepa is the most consumed maize product in Colombia, reaching 83.1% in the central-western region of the country.11 This food is one of the foodstuffs in Colombia with a high susceptibility to be contaminated with aflatoxins, because the mycotoxigenic mold may grow on maize from cultivation, storage or even when the corn arepas are being processed.12,13 Therefore, surveys concerning corn and their products intended for human consumption are necessary in determining the risk of aflatoxins for consumers. The purpose of this study was to validate the HPLC with fluorescence detector method for the determination of AFB1, AFB2, AFG1 and AFG2 in white corn arepas and to establish the aflatoxins levels in arepas commercialized in Manizales, Colombia.
Experimental
Standard reactants and solutions
Millipore 0.22 µm. Micotox® 2002 cartridges were used for the aflatoxins purification. The standard aflatoxins with a certified concentration of 250 ng mL−1 of AFB
1 and AFG1, and 75 ng mL−1 of AFB
2 and AFG2 in acetonitrile were acquired in Micotox Ltda® (Colombia). A 100 ng mL−1 working solution was made, from which a series of acetonitrile solutions were prepared at the following concentrations: 0.1, 1.0, 5.0, 10, 25, and 50 ng mL−1 for AFG1 and AFB1, and 0.03, 0.30, 1.52, 3.03, 7.58, and 15.15 ng mL−1 for AFG
2 and AFB2.
Samples
A total of 144 white corn arepas samples (500 g each) from 12 trademarks commercialized in stores and local supermarkets in Manizales, Colombia, were collected, which included six handcrafted trademarks and six industrial fabrication trademarks. From each trademark, six analytic units were analyzed in two different periods during 2013 to determine their AF contamination.
Extraction and purification
AF extraction was performed following the Colombian Technical Standards (Norma Técnica Colombiana NTC 1232),14 modified by Céspedes and Díaz15 and Díaz et. al.,16 as follows: a 500 g of ground analytical sample was triturated in a food processor, from which a subsample of 25 g (in the case of hygroscopic substrates such as arepas) was extracted with 100 mL of acetonitrile:milli-Q water (84:16, v/v) during 3 min using a blender at high speed. The blended mixture was filtered through Whatman No. 4 paper, and 5 mL of the filtrate was purified with a multifunctional cleanup column (Micotox® 2002). Finally, 200 µL of purified extract were transferred to an amber vial. This aliquot was treated with 700 µL of milli-Q water:trifluoroacetic acid:acetic acid (7:2:1, v/v/v), and the vial was heated in a steam water bath at 65 °C for 10 min and then, when the mixture returned to room temperature, 50 µL were injected into the loop of the HPLC pump for duplicate HPLC analysis.14-16
HPLC analysis
The chromatographic separation was carried out in Shimadzu LC-20 AT HPLC system connected to a RF-10AXL (Shimadzu, Kyoto, Japan) fluorescence detector.17 The four aflatoxins were separated in a RP18 Capital® (250 mm × 4.6 mm, 5 µm) HPLC column. The best chromatographic conditions were the following: 1 mL min−1 for the mobile phase’s flow, mobile
phase with a mixture of methanol:acetonitrile:milli-Q water (17.5:7.5:65 v/v/v) in isocratic elution, injection volume of 50 µL and column oven temperature of 50 °C. The fluorescence detection was made with excitation wavelength of 360 nm and emission of 440 nm. The four aflatoxins were separated in 20 min under the above mentioned conditions.14-16
Validation and quality assurance of the analytical method
The method employed was validated according to the International Union of Pure and Applied Chemistry (IUPAC)18 and EURACHEM19 validation guides. The parameters included were robustness, specificity, linearity, sensitivity, repeatability, intermediate precision and recovery.
For the robustness tests, three variables that could affect the method performance were selected and three experiments of each one were carried out. The variables were: mobile phase composition, column oven temperature and detector’s wavelength. A standard solution of 10 ng mL−1 of AFG
1 and AFB1, and 3.3 ng mL− 1 of AFG
2 and AFB2 was used and each series of experimental conditions was analyzed once. The selectivity was verified by means of an HPLC analysis of a blank sample and spiked sample with a 10 ng mL−1 solution of AFG
1 and AFB1, and 3.3 ng mL− 1
of AFG2 and AFB2. The linearity was determined by a triplicate analysis of standard aflatoxins solutions at six different concentrations and the blank during three consecutive days. The concentrations were; 0.1, 1.0, 5.0, 10, 25, 50 ng mL−1 for AFG
1 and AFB1 and 0.03, 0.30, 1.52, 3.03, 7.58, 15.15 ng mL−1 for AFG
2 and AFB2. The sensitivity was established by detection limit (LOD) and quantification limit (LOQ), which were calculated according to the following equation: LOD = 3.3sa/b and LOQ = 10sa/b, where sa is the standard deviation of the intercept and b is the slope of regression line, obtained from the calibration curve.20 The repeatability was done by the preparation of three different concentration’s solution made from the standard solution in the working interval of the method, each one was prepared by the same analyst and read six times in a short time period (1 day). The intermediate precision was done with the preparation of three different concentration’s solution in the working range from the standard solution, each one prepared by a different analyst and read six times in extended period of time (day 1, 10, 20 and 30).
and purification phase and the recovery percentage was calculated as follows:
Recovery (%) = ´ 100
spiked
χ χ
χ −
× (1)
where χ’is the concentration of the spiked sample, χ is the concentration of non-spiked sample and χspiked is the concentration added.19
Results and Discussion
Chromatographic conditions determination
With the aim of obtaining a high efficiency in the separation of the four aflatoxins, some chromatographic parameters were investigated, including the mobile phase composition, the detector’s wavelength and the column oven temperature. It was found that the variable that most could affect results was the mobile phase composition, because a minimal variation in acetonitrile or methanol concentration can significantly modify the retention times of each aflatoxin. It was concluded that the adequate mobile phase composition was acetonitrile:methanol:milli-Q water, (17.5:17.5:65 v/v/v); an emission and excitation wavelengths (λ) of 360 nm and 440 nm, respectively in the fluorescence detector and column oven temperature of
50 °C. Under the evaluated conditions, the four analyzed aflatoxins were well separated in less than 20 min, which is within the average of the majority of published methods21 and agrees with the reports of Wen et al.10 The elution order of the peaks were AFG1, AFB1, AFG2 and AFB2 and the average retention times were 5.414, 7.113, 10.697 and 15.666 min, respectively.
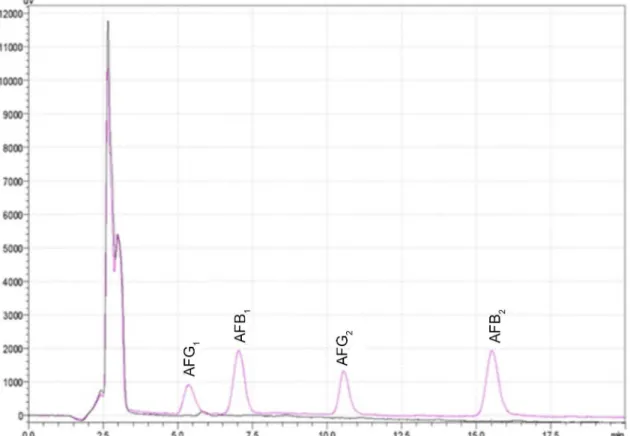
Selectivity
This parameter studies the capacity of the method to distinguish the analyte from any other interference present in the analyzed samples.22 In Figure 1, it is observed that the two compared chromatograms of a blank sample and another spiked with a standard solution, show no interfering peaks in the retentions times of the four aflatoxins, which demonstrates the selectivity of the method towards other compounds naturally present in corn arepas.
These results agree with those obtained by Muscarella et al.,23 who also did not find matrix effect interferences in samples of almonds, pistachios, corns and oats during the validation of an HPLC method for aflatoxins determination.23
Linearity
Linearity is the capacity of the method to obtain results directly proportional to the concentration or amount of
Figure 1. Chromatograms of blank sample (black line) and spiked sample (pink line) with 10 ng mL−1 of AFG
analyte in a defined range.22 Each aflatoxin was evaluated using standard solutions in concentrations of 0.1 to 50 ng mL−1 of AFG
1 and AFB1, and its third part of AFG2 and AFB2. The results of the three calibration curves showed R2 values of 0.9998 for each aflatoxin demonstrating this method’s linearity (Table 1). These results are in agreement with the report of Huang et al.,24 who also found R2 values higher than 0.999 for all aflatoxins.
Sensitivity
Sensitivity is the capacity of the method to discriminate small differences in the concentration of the analyte.22 The LOD and LOQ for each aflatoxin are shown in Table 1.
The LOD of AFB1 was 0.1 ng mL−
1, which allows to
quantify the contents of this aflatoxin in a arepa sample and to establish if it is according to international normativity where the maximum allowed content is 2 µg kg−1.25 These results demonstrate that the validated method is very sensible for detecting and quantifying aflatoxins and concur with those obtained by other authors who have even detected a concentration of AFB1 as low as 0.008 µg kg−1.24,26,27
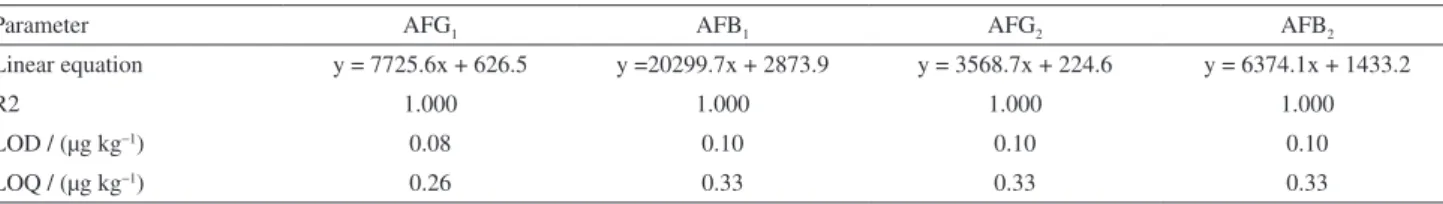
Due to lack of homoscedasticity in the residual measurements of y axis and the 95% confidence interval of intercept, all the values of linear regression in Table 1 are not including the cero, which was resolved making an “x” axis concentration weighted linear regression to improve their linear characteristics.18
As shown in Table 2, with this kind of linear regression, the LOD and LOQ were improved, and the other linear characteristics are better.
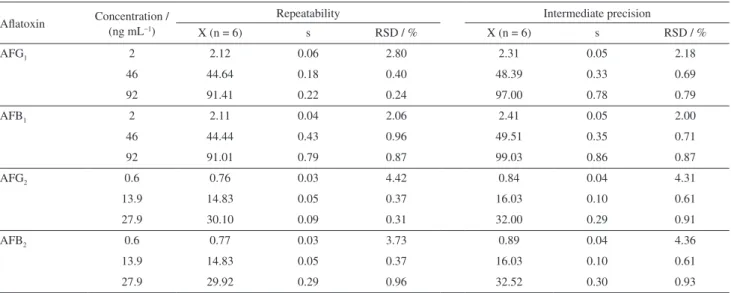
Precision
The precision results for the method under repeatability and intermediate precision are shown in Table 3 for each aflatoxin and tested concentrations.
These data were previously processed with a Shapiro-Wilk test in order to verify the normal distribution. Afterwards, an ANOVA one-way test was performed with the aim to proof the homogeneity of the concentration medium values in four different days. The RSD% results were among 0.2-4.4 for repeatability and 0.6-0.44% for intermediate precision. According to the regulation of the European Commission (EC) No. 401/2006,28 the recommended RSD% values for each concentration must be equal or lower that those derived from the Horwitz equation, which in turn is based on the analyte concentration, regardless of the matrix and analysis method used. In the case of the method validated in this study, where concentrations lower than 1 µg mL−1 were analyzed, a RSD ≤ 16% is recommended.29 All the precision results were lower than 4.4%, indicating a good precision. This values were below the reference values established by the Commission Decision 2002/657/CE30 and agree with the results achieved by Wen et al.,10 who obtained RSD% values in the range of 0.7-2.7 and 0.9-3.5% for repeatability and intermediate precision, respectively. On the other hand, Chan31 obtained RSD% far higher, between 9.06 and 10.13% in repeatability conditions, which suggests that the method validated here has a high precision.
Recovery
A recovery assay was done in corn arepas spiked with a solution of AFG1 and AFG2 at concentrations of 72.8 and 18.1 ng mL–1, respectively. Table 4 shows the percentage of recovery in corn arepas spiked with AFG1 and AFG2.
According to the regulation (EC) 401/2006 of the European Commission, the recommended value of recovery for concentrations of aflatoxins > 10 µg kg−1 must be of 80 to 110%, and for higher concentrations must be of 80 to 110%.28 The recovery obtained in this study for AFG
1 and
Table 1. Linearity, LOD and LOQ of AFG1, AFB1, AFG2 and AFB2
Parameter AFG1 AFB1 AFG2 AFB2
Linear equation y = 7850.4x − 1268.3 y =20695x − 3127.2 y = 3646.3x − 953.6 y = 6558.5x − 1366.7
R2 0.9999 0.9998 0.9998 0.9998
LOD / (µg kg−1) 0.40 0.45 0.47 0.53
LOQ / (µg kg−1) 1.34 1.49 1.55 1.76
Table 2. Linearity, LOD and LOQ of AFG1, AFB1, AFG2 and AFB2 with weighted linear equation
Parameter AFG1 AFB1 AFG2 AFB2
Linear equation y = 7725.6x + 626.5 y =20299.7x + 2873.9 y = 3568.7x + 224.6 y = 6374.1x + 1433.2
R2 1.000 1.000 1.000 1.000
LOD / (µg kg−1) 0.08 0.10 0.10 0.10
AFG2 was 76.6% and 78.2%, respectively, which is close to the 80% recommended. This value could be improved during sampling arepas corn aflatoxin using immunoaffinity columns. These results are similar to those reported by Huang,24 who obtained recoveries of 74.7% for AFG
1 and 80.8% for AFG2 from peanut.
Aflatoxins occurrence in the HPLC analyzed samples
Once the HPLC method was validated, the analysis of 144 samples of 12 different brands commercialized in Manizales, Colombia was made. Additionally, from the 144 samples analyzed with HPLC, 58 (40.27%) were randomly chosen to undergo a screening process previous to the chromatographic analysis with the ELISA technique and a concordance of 98.2% between the ELISA and HPLC results was achieved.
HPLC levels of aflatoxins in corn arepas samples analyzed with values above the LOD are shown in Table 5.
Aflatoxins were found, mainly AFG1, in 14 of the 144 analyzed samples (9.72%), at levels between 0.95 and 11.56 µg kg−1, from which seven (4.86%) showed values above the limits allowed by the national normative for total aflatoxins (4 µg kg−1).32 AFB
1 and AFB2 were not detected
in any of the samples analyzed. This results are below that those reported by Arcila and Martínez,12 who found that 27.8% of corn arepas samples analyzed by the method of TLC had trace amounts of total aflatoxins (< 3 µg kg−1) and only 1.8% had 10 µg kg−1 of AFB
1. In the same way, this prevalence is much better than that reported by a study made in Manizales in 1996,13 where the presence of total aflatoxins was detected in 100% of the arepas samples analyzed by ELISA method, the majority above the levels allowed by the international normative.
Table 3. Repeatability and intermediate precision of the HPLC method for the determination of AFG1, AFB1, AFG2 and AFB2
Aflatoxin Concentration / (ng mL−1)
Repeatability Intermediate precision
X (n = 6) s RSD / % X (n = 6) s RSD / %
AFG1 2 2.12 0.06 2.80 2.31 0.05 2.18
46 44.64 0.18 0.40 48.39 0.33 0.69
92 91.41 0.22 0.24 97.00 0.78 0.79
AFB1 2 2.11 0.04 2.06 2.41 0.05 2.00
46 44.44 0.43 0.96 49.51 0.35 0.71
92 91.01 0.79 0.87 99.03 0.86 0.87
AFG2 0.6 0.76 0.03 4.42 0.84 0.04 4.31
13.9 14.83 0.05 0.37 16.03 0.10 0.61
27.9 30.10 0.09 0.31 32.00 0.29 0.91
AFB2 0.6 0.77 0.03 3.73 0.89 0.04 4.36
13.9 14.83 0.05 0.37 16.03 0.10 0.61
27.9 29.92 0.29 0.96 32.52 0.30 0.93
X: mean concentration; n: number of replicates; s: standard deviation; RSD%: relative standard deviation.
Table 4. AFG1 and AFG2 percentage of recovery
Aflatoxin χ’ χ χspiked χ’ – χ R / %
AFG1 71.1 15.3 72.8 55.78 76.6
AFG2 208.4 18.1 243.2 190.26 78.2
χ’: concentration of the spiked sample; χ: concentration of non-spiked sample; χspiked is the concentration added. Concentrations in ng mL−1.
Table 5. Aflatoxins level (µg kg−1) in the corn arepas analyzed samples
Sample
ID Sampling Type of
sample AFG1 AFB1 AFG2 AFB2
212 1 HB 1.15 − − −
244 1 HB 1.82 − − −
251 1 HB 1.72 − − −
252 1 HB 2.50 − − −
253 1 HB 2.67 − 7.22 −
254 1 HB 1.90 − − −
256 1 HB 0.95 − 3.82 −
131 2 IB 6.05 − − −
132 2 IB 11.56 − − −
133 2 IB 9.15 − − −
134 2 IB 10.99 − − −
155 2 IB 5.42 − − −
156 2 IB 6.61 − − −
162 2 IB 8.80 − − −
On the other hand, the results of our study indicate that the occurrence of aflatoxins in corn arepas marketed in the city of Manizales (9.72%) is relatively low compared with those reported in other countries like Ecuador (26%),33 Venezuela (16.6%),33 Mexico (56%),34 and Peru (82%).35 Moreover, this incidence is much lower than the 29% overall incidence of AFB1 found in feed for poultry and pigs used in Colombia15 and differ from those reported by Diaz et. al.,16 who investigated aflatoxin contamination in selected Colombian food and obtained an incidence of 8.9% of AFB1, 1.2% of AFB2 and only 0.4% of AFG1 and AG2.
Although AFB1 has been reported as the most dangerous of the four aflatoxins studied, finding AFG1 in the analyzed samples is significant because it has recently been found that oral administration of AFG1 could induce chronic lung inflammation, which may provide a pro-tumor microenvironment to contribute to lung tumorigenesis.36 Also, studies have shown that AFG1 was the most frequently detected contaminating mycotoxin in the foodstuffs of the high incidence areas of esophageal cancer in north China.37
After applying a variance analysis (ANOVA) to the data, it was found that a statistical significant difference exists in the aflatoxins levels among the arepas brands analyzed (p = 0.0002). A higher frequency of aflatoxins was found in the handcrafted brands, which is explained because in the small industry there is no defined operations nor standardized processes since the reception of the raw material up to the washing of the corn and exists the need to implement control measures to avoid the fungus growth.14 Additionally, in the industrial process, additives or coadjuvants are added to the corn arepa to reduce the water activity, which acts directly as conservatives inhibiting the fungus growth.38
The finding of aflatoxins in the corn arepas samples shows the potential contamination with aflatoxigenic molds that begin in the corn grain and then could reduce during the storage, distribution, and processing of arepas.12 Given the carcinogenetic, mutagenic and genotoxic potential of aflatoxins, there are no insignificant quantities, because it is impossible to establish a toxicological reference value where the formation of tumors is not induced.11 According to numerous studies, the aflatoxins consumption, even at very low levels (i.e., 1 ng kg−1 p.c. day−1), contributes to liver cancer development.25,39-43 In Colombia, it has been estimated that the exposure to consumption of corn and corn products is of < 0.699 and < 0.198 µg kg−1 p.c. day−1, respectively, which indicates that the population might be at risk.11
Conclusions
The validated method for AFG1, AFB1, AFG2 and AFB2 determination in white corn arepas by HPLC presented
satisfactory values of robustness, selectivity, linearity, LOD and LOQ. In the same way, the acceptance criteria for validating the methodology were achieved, with a RSD% lower to 4.5% in the precision assays and a recovery above 76.6%. Thus, this method can potentially be applied for the determination of aflatoxins in other food matrices with little or no modification.
Aflatoxins were found in 9.72% of the analyzed samples at levels between 0.95 and 11.56 µg kg−1, from which seven (4.86%) had values above the limits allowed by the local normative for total aflatoxins.
It was found that the samples contained primarily AFG1, which is one of the most frequently detected mycotoxins in grains and foodstuffs and also has been linked to lung and esophageal cancer in north China.
The results obtained comprise the first report in the world about aflatoxins determination in corn arepas using the HPLC with a fluorescence detector method.
References
1. Soriano-del-Castillo, J. M.; Micotoxinas en Alimentos; 1ª ed., Ediciones Díaz de Santos: Madrid, 2007.
2. Urrego Novoa, J. R.; Díaz, G. J.; Rev. Fac. Med. Univ. Nac. Colomb. 2006, 54, 108.
3. http://www.ansci.cornell.edu/plants/toxicagents/aflatoxin/ aflatoxin.html accessed on February 28, 2014.
4. http://monographs.iarc.fr/ENG/Monographs/vol100F/ accessed on February 28, 2014.
5. Köppen, R.; Koch, M.; Siegel, D.; Merkel, S.; Maul, R.; Nehls, I.; Appl. Microbiol. Biotechnol. 2010, 86, 1595.
6. Stroka, J.; van Otterdijk, R.; Anklam, E.; J. Chromatogr., A 2000, 904, 251.
7. Ghali, R.; Hmaissia-khlifa, K.; Ghorbel, H.; Maaroufi, K.; Hedili, A.; Food Control 2008, 19, 921.
8. Trucksess, M. W.; Brumley, W. C.; Nesheim, S.; J. - Assoc. Off. Anal. Chem. 1984, 67, 973.
9. Liu, S.; Qiu, F.; Kong, W.; Wei, J.; Xiao, X.; Yang, M.; Food Control 2013, 29, 156.
10. Wen, J.; Kong, W.; Wang, J.; Yang, M.; J. Sep. Sci. 2013, 36, 3709.
11. Instituto Nacional de Salud; Evaluación de Riesgo de la Aflatoxina B1 (AFB1) en Arepa de Maíz en Colombia, 2013. 12. Arcila García, M. P.; Biosalud 2002, 1, 45.
13. Arango Mejía, M. C.; Biosalud: Revista de Ciencias Básicas 2002, 1, 45.
14. Instituto Colombiano de Normas Técnicas y Certificación; NTC 1232 Granos y Cereales. Método de Análisis de Aflatoxinas de
Ocurrencia Natural (B1, B2, G1 y G2). ICONTEC: Bogotá, 1996.
16. Díaz, G. J.; Perilla, N. S.; Rojas, Y.; Mycotoxin Res. 2001, 17, 15.
17. Manso, S.; Pezo, D.; Gómez-Lus, R.; Nerin, C.; Food Control 2014, 45, 101.
18. Thompson, M.; Stephen, L. R.; Wood, R.; Pure Appl. Chem. 2002, 74, 835.
19. https://www.eurachem.org/images/stories/Guides/pdf/MV_ guide_2nd_ed_EN.pdf accessed on February 2015.
20. Miller, J. C.; Miller, J. N.; Statistics for Analytical Chemistry, 3rd ed., Ellis Horwood PTR Prentice-Hall: New York, 1993.
21. Alvito, P. C.; Sizoo, E. A.; Almeida, C. M. M.; Egmond, H.; Food Anal. Method. 2010, 3, 22.
22. http://www.chem.agilent.com/Library/primers/Public/5990-5140EN.pdf accessed in February 2015.
23. Muscarella, M.; Iammarino, M.; Nardiello, D.; Lo Magro, S.; Palermo, C.; Palermo, D.; Centonze, D.; Food Addit. Contam. 2009, 26, 1402.
24. Huang, B.; Han, Z.; Cai, Z.; Wu, Y.; Ren, Y.; Anal. Chim. Acta 2010, 662, 62.
25. http://www.fao.org/docrep/007/y5499s/y5499s00.htm accessed in February 2015.
26. Fu, Z.; Huang, X.; Min, S.; J. Chromatogr., A 2008, 1209, 271. 27. Sook, H.; Kim, H. J.; Ok, H. E.; Hwang, J. B.; Chung, D.; Food
Chem. 2007, 102, 385.
28. http://eur-lex.europa.eu/LexUriServ/LexUriServ.do?uri=OJ:L :2006:070:0012:0034:EN:PDF accessed in February 2015. 29. http://www.bii.mx/documentos/horwitzCm10.pdf accessed in
February 2015.
30. http://cemu10.fmv.ulg.ac.be/OSTC/2002657EC.pdf accessed in March 2014.
31. Chan, D.; MacDonald, S. J.; Boughtflower, V.; Brereton, P. J.; J. Chromatogr., A 2004, 1059, 13.
32. Ministerio de Salud y Protección Social; Resolución No. 4506, Por la Cual se Establecen los Niveles Máximos de Contaminantes en los Alimentos Destinados al Consumo
Humano y se Dictan Otras Disposiciones, Bogotá, 2013. 33. Fernández, G.; Negrón, G.; Isea, G.; Sánchez, E.; Rev. Fac.
Agron. (LUZ) 2000, X, 63.
34. http://www.ejournal.unam.mx/bot/074-02/BOT74207.pdf accessed in January 2015.
35. Caballero, J.; Arbaiza, T.; Lucas, O.; Rev. Inv. Vet. Perú 2001, 12, 1.
36. Liu, C.; Shen, H.; Yi, L.; Shao, P.; Soulika, A.; Meng, X.; Xing, L.; Yan, X.; Zhang, X.; Toxicology Letters, in press, DOI:10.1016/j.toxlet.2014.11.002.
37. Zhang, X. H.; Xie, T. X.; Li, S .S.; Biomed. Environ. Sci. 1998, 1, 140.
38. ftp://ftp.fao.org/docrep/fao/005/y1390e/y1390e00.pdf accessed in February 2015.
39. Comisión Europea, Diario Oficial de la Unión Europea, Reglamento No. 165/2010, 2010.
40. Guengerich, F. P.; Johnson, W. W.; Ueng, Y. F.; Yamazaki, H.; Shimada, T.; Environ. Health Perspect. 1996, 104, 557. 41. Peers, F. G.; Linsell, C. A.; Br. J. Cancer 1973, 27, 473. 42. Jackson, P. E.; Groopman, J. D.; Best Pract. Res., Clin.
Gastroenterol. 1999, 13, 545.
43. http://ec.europa.eu/food/fs/ifsi/eupositions/cac/archives/ cac_item10a_es.html accessed in February 2015.
Submitted: September 30, 2014