Microcephaly in Pernambuco State, Brazil:
epidemiological characteristics and evaluation
of the diagnostic accuracy of cutoff points for
reporting suspected cases
Microcefalia no Estado de Pernambuco, Brasil:
características epidemiológicas e avaliação da
acurácia diagnóstica dos pontos de corte adotados
para notificação de caso
Microcefalia en el estado de Pernambuco, Brasil:
características epidemiológicas y evaluación de
la precisión diagnóstica de los puntos de corte
adoptados para la notificación de casos
Wayner Vieira de Souza 1 Thalia Velho Barreto de Araújo 2
Maria de Fátima P. Militão Albuquerque 1 Maria Cynthia Braga 1
Ricardo Arraes de Alencar Ximenes 2 Demócrito de Barros Miranda-Filho 3 Luciana Caroline Albuquerque Bezerra 4 George Santiago Dimech 4
Patrícia Ismael de Carvalho 4 Romildo Siqueira de Assunção 4 Roselene Hans Santos 4
Wanderson Kleber de Oliveira 5 Laura Cunha Rodrigues 6 Celina Maria Turchi Martelli 1
Abstract
The increase in the number of reported cases of microcephaly in Pernam-buco State, and Northeast Brazil, characterized an epidemic that led the Brazilian Ministry of Health to declare a national public health emer-gency. The Brazilian Ministry of Health initially defined suspected cases as newborns with gestational age (GA) ≥ 37 weeks and head circumference (HC) ≤ 33cm, but in December 2015 this cutoff was lowered to 32cm. The current study aimed to estimate the accuracy, sensitivity, and specificity of different cutoff points for HC, using ROC curves, with the Fenton and Intergrowth (2014) curves as the gold standard. The study described cases reported in Pernambuco from August 8 to November 28, 2015, according to sex and GA categories. The Fenton and Intergrowth methods provide HC growth curves according to GA and sex, and microcephaly is defined as a newborn with HC below the 3rd percentile in these distributions. Of the 684 reported cases, 599 were term or post-term neonates. For these, the analyses with ROC curves show that according to the Fenton criterion the cutoff point with the largest area under the ROC curve, with sensiti-vity greater than specificity, is 32cm for both sexes. Using the Intergrowth method and following the same criteria, the cutoff points are 32cm and 31.5cm for males and females, respectively. The cutoff point identified by the Fenton method (32cm) coincided with the Brazilian Ministry of Health recommendation. Adopting Intergrowth as the standard, the choice would be 32cm for males and 31.5cm for females. The study identified the need to conduct critical and on-going analyses to evaluate cutoff points, inclu-ding other characteristics for microcephaly case definition.
Microcephaly; Zika Virus Infection; Epidemiological Surveillance; Data Accuracy
Correspondence W. V. Souza
Departamento de Saúde Coletiva, Centro de Pesquisas Aggeu Magalhães, Fundação Oswaldo Cruz.
Av. Moraes Rêgo s/n, Recife, PE 50670-420, Brasil. [email protected]
1 Centro de Pesquisas Aggeu Magalhães, Fundação Oswaldo Cruz, Recife, Brasil.
2 Universidade Federal de
Pernambuco, Recife, Brasil.
3 Universidade de
Pernambuco, Recife, Brasil.
4 Secretaria Executiva
de Vigilância em Saúde, Secretaria Estadual de Saúde de Pernambuco, Recife, Brasil.
5 Secretaria de Vigilância em
Saúde, Ministério da Saúde, Brasília, Brasil.
6 London School of Hygiene
Introduction
The rapid rise in the number of suspected cases of microcephaly in live newborns starting in Au-gust 2015 in Pernambuco State, Northeast Brazil, called the attention of physicians in the public and private health care systems in that state 1.
Alerted to the problem, the Executive Sec-retariat for Health Surveillance (SEVS) of the Pernambuco State Health Secretariat (SES-PE) detected a change in the pattern of occurrence of this congenital anomaly, with an increase in the number of cases when compared to previous years, thus characterizing an epidemic 2.
The possible association between the in-crease in the number of microcephaly cases and outbreaks of Zika virus infection in Brazil since late 2014, especially in Northeast Brazil, became the object of investigation 3.
Other states of Northeast Brazil reported an increase in microcephaly cases, leading the Bra-zilian Ministry of Health to declare a national public health emergency on November11, 2015 4.
For reporting purposes, suspected micro-cephaly cases were initially defined as live new-borns with gestational age ≥ 37 weeks and head circumference (HC) ≤ 33cm 5. However, this
cutoff point, with high sensitivity but not fully backed by the existing scientific literature 6,7,
generated an excessive number of notifications. Thus, as of December 2015, the Brazilian Minis-try of Health established HC ≤ 32cm as the defini-tion of a suspected case of microcephaly 8.
To contribute to the discussion on the cutoff point for reporting suspected cases, the current study aimed to estimate the accuracy, sensitiv-ity, and specificity of different cutoff points using the Fenton method and the curve proposed by the Intergrowth project 7 as the gold standard.
The Intergrowth curve was included in the analy-ses because it was developed recently, based on measurements of children from countries with different ethnic and economic characteristics.
Material and methods
The study analyzed a total of 696 suspected mi-crocephaly cases reported to the SES-PE from August 2 to November 28, 2015 (epidemiological weeks 31 to 47).
The analyses excluded newborns with no re-corded information on head circumference and/ or gestational age and another two cases classi-fied as recording errors (HC = 35cm and 45cm), leaving two cases with HC = 33.5cm, identified in the sample as suspected cases of microcephaly, leaving a total of 684 suspected cases.
The study began with a description of report-ed cases by distributions according to sex and gestational age categories.
Gestational age (GA) categories were defined as follows: preterm neonates – GA up to 36 weeks and 6 days; term and post-term neonates – GA 37 weeks or more, in which term neonates were defined as GA up to 41 weeks and 6 days.
To classify suspected microcephaly cases as positive or negative, we first used the Fenton tables and then the Intergrowth method (2014), which provide distributions of growth curves for head circumference according to GA and sex; positive (confirmed) cases were defined as new-borns with HC below the 3rd percentile of these distributions. We also analyzed the time trend in suspected and confirmed cases according to epi-demiological week.
ROC (Receiver Operating Characteristic) curves were used to evaluate the cutoff points for HC. The gold standard was first the Fenton curves and then the Intergrowth tables.
The study also analyzed differences in the proportion of confirmed cases according to the Fenton curve, by sex.
The criterion for selecting the “ideal” cutoff point was maximization of the area under the ROC curve, respecting the need for greater sen-sitivity than specificity, given the nature of the object of investigation (screening). The analyses were performed separately according to sex and GA categories.
The Intergrowth method, at the beginning of the epidemic, only provided growth curves of HC for new borns with GA ≥ 33 weeks. For consis-tency, only neonates with GA ≥ 37 weeks were included in the analyses using this method.
Finally, the study verified the concordance between the classifications obtained by the two methods, using the kappa coefficient. The analy-ses were performed with Stata, version 12 (Stata-Corp LP, College Station, USA).
Results
Of the 684 reported cases, 599 were term/post-term neonates and 85 (12.4%) were preterm/post-term, a similar percentage to that of the general popu-lation according to the Brazilian Information System on Live Births (SINASC) for Pernambuco State in 2013. Seven preterm neonates had GA between 22 and 31 weeks. The majority of the re-ported cases were females (423 cases, or 62% of the total).
false-positives (61%). For the 599 neonates with GA ≥ 37 weeks, the positive rate according to the Fen-ton criterion was 41% (243 cases), while the Inter-growth method showed 188 positive cases (31%). The percentages of positive microcephaly cases did differ significantly according to sex: 41% for males and 38% for females (χ2(1 df ) =
0.44; p = 0.506).
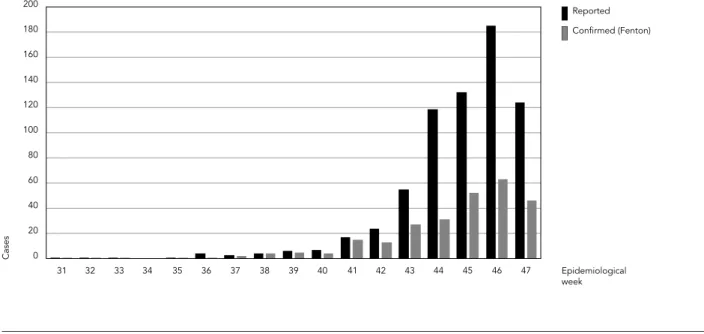
Notwithstanding the high number of false-positives, the 267 confirmed cases according to the Fenton criterion, reported over the course of 17 epidemiological weeks, represent a relative rate of 58 cases per 10,000 live births.
Figure 1 shows the distribution of suspected and confirmed cases according to the Fenton method, by epidemiological week.
Table 1 shows the sensitivity, specificity, and accuracy using ROC curves with the two meth-ods. According to the Fenton criterion, the cut-off point with the largest area under the ROC curve, and respecting the need for higher sensi-tivity than specificity, was 32cm for both sexes. However, for females this cutoff point showed a specificity of 70%, while for males it was approxi-mately 80%.
According to the Intergrowth method, the cutoff points using the same criteria are 32cm and 31.5cm for males and females, respectively.
Concordance between the methods for both sexes was 90.8% (kappa coefficient = 0.802; p < 0.001). Concordance was 90.3% for males (kappa = 0.792; p < 0.001) and 91.2% for females (kappa = 0.809; p < 0.001).
Table 2 shows the classification of newborns according to cutoff points for HC identified by the two methods in the analysis of accuracy ac-cording to GA categories. For newborns with GA ≥ 37 weeks, the Intergrowth method shows a false-positive rate of 11.4% (68 cases), compared to 15.7% by the Fenton method. Considering newborns of all gestational ages, there were a to-tal of 108 false-positives (15.8%) according to the Fenton method.
Finally, considering newborns with GA ≥ 37 weeks (599), a cutoff of 32cm would lead to 54% positives (324 cases), while cutoffs with higher specificity, like 31cm and 30.5cm, would lead to 29% and 20% positives, respectively.
Figure 1
Table 1
Accuracy, sensitivity, and specificity for definition of the cutoff point for head circumference (in centimeters) with the Fenton curve and Intergrowth method as the gold standard.
Fenton Intergrowth
Term/post-term newborns (both sexes) Cutoff Sensitivity
(%)
Specificity (%)
Accuracy (%)
Area under ROC curve (%)
Cutoff Sensitivity (%)
Specificity (%)
Accuracy (%)
Area under ROC curve (%)
≤ 33.5 100.0 0.0 40.6 50.0 ≤ 33.5 100.0 0.0 31.4 50.0
≤ 33.0 100.0 0.6 40.9 50.3 ≤ 33.0 100.0 0.5 31.7 50.2
≤ 32.5 97.1 62.1 76.3 79.6 ≤ 32.5 98.9 55.0 68.8 77.0
≤ 32.0 94.6 73.6 82.1 84.1 ≤ 32.0 98.9 66.4 76.6 82.7
≤ 31.5 74.1 96.6 87.5 85.3 ≤ 31.5 86.2 92.7 90.6 89.4
≤ 31.0 70.0 98.3 86.8 84.1 ≤ 31.0 84.6 95.9 92.3 90.2
≤ 30.5 49.4 100.0 79.5 74.7 ≤ 30.5 62.8 99.5 88.0 81.1
< 30.5 0.0 100.0 59.4 50.0 < 30.5 0.0 100.0 68.6 50.0
Term/post-term newborns (males) Cutoff Sensitivity
(%)
Specificity (%)
Accuracy (%)
Area under ROC curve (%)
Cutoff Sensitivity (%)
Specificity (%)
Accuracy (%)
Area under ROC curve (%)
≤ 33.5 100.0 0.0 41.5 50.0 ≤ 33.5 100.0 0.0 31.8 50.0
≤ 33.0 100.0 1.4 42.4 50.7 ≤ 33.0 100.0 1.2 32.6 50.6
≤ 32.5 92.9 72.5 80.9 82.7 ≤ 32.5 97.3 65.2 75.4 81.3
≤ 32.0 88.8 79.7 83.5 84.2 ≤ 32.0 97.3 73.9 81.4 85.6
≤ 31.5 62.2 97.8 83.0 80.0 ≤ 31.5 80.0 97.5 91.9 88.8
≤ 31.0 59.2 98.5 82.2 78.9 ≤ 31.0 77.3 98.8 91.9 88.0
≤ 30.5 42.9 100.0 76.3 71.4 ≤ 30.5 56.0 100.0 86.0 78.0
< 30.5 0.0 100.0 58.5 50.0 < 30.5 0.0 100.0 68.2 50.0
Term/post-term newborns (females) Cutoff Sensitivity
(%)
Specificity (%)
Accuracy (%)
Area under ROC curve (%)
Cutoff Sensitivity (%)
Specificity (%)
Accuracy (%)
Area under ROC curve (%)
≤ 33.0 100.0 0.0 42.4 50.0 ≤ 33.0 100.0 0.0 31.1 50.0
≤ 32.5 100.0 55.5 80.9 77.7 ≤ 32.5 100.0 48.4 64.5 74.2
≤ 32.0 98.6 69.7 83.5 84.2 ≤ 32.0 100.0 61.6 73.5 80.8
≤ 31.5 82.1 95.9 83.0 89.0 ≤ 31.5 90.3 89.6 89.8 89.9
≤ 31.0 77.2 98.2 82.2 87.7 ≤ 31.0 89.4 94.0 92.6 91.7
≤ 30.5 53.8 100.0 76.3 76.9 ≤ 30.5 67.3 99.2 89.3 83.2
< 30.5 0.0 100.0 58.5 50.0 < 30.5 0.0 100.0 68.9 50.0
Preterm newborns (both sexes) Cutoff Sensitivity
(%)
Specificity (%)
Accuracy (%)
Area under ROC curve (%)
≤ 33.0 100.0 0.0 28.2 50.0
≤ 32.0 100.0 31.1 50.6 65.6
≤ 31.0 100.0 62.3 72.9 81.1
≤ 30.0 100.0 77.0 83.5 88.5
≤ 28.0 79.2 93.4 89.4 86.3
≤ 26.0 33.3 96.7 78.8 65.0
< 26.0 0.0 100.0 71.8 50.0
Discussion
Using the Brazilian Ministry of Health criterion (HC ≤ 33cm), classification of the Fenton curves for the 684 newborns reported as suspected cases of microcephaly shows 417 false-positives (61%). Meanwhile, analysis of the ROC curves us-ing Fenton as the gold standard points to a cutoff point of 32cm for HC in both sexes, consistent with the new recommendation by the Ministry of Health 8.
Lowering the cutoff point for HC from 33cm to 32cm increased the accuracy of the case defini-tion for microcephaly, by sex and GA, according to the Fenton method. Among term/post-term neonates of both sexes, the number of false-posi-tives fell from 275 (45.9%) to 94 (15.7%).
Still, the adoption of a single cutoff point (32cm) for both sexes does not appear appropri-ate 9, since it results in a 10% drop in specificity
for female term and post-term neonates, produc-ing more false-positives in the latter group. This finding explains the large volume of reported suspected cases of microcephaly in females, de-spite the lack of a significant difference between the sexes in the proportion of positive cases.
Considering preterm neonates, a cutoff of 30cm produced 14 false-positives among the 85 suspected cases.
Since it shows higher specificity, the Inter-growth method pointed to HC = 31.5cm as the cutoff that produces the largest area under the ROC curve for males, compared to 31cm for fe-males. However, since screening requires greater sensitivity than specificity, the choice would be 32cm for males and 31.5cm for females. Impor-tantly, variation in HC measurements is possible in this epidemic, due to phenotypical charac-teristics such as excess scalp skin as a result of cerebral atrophy 10. The cutoff for HC in
new-borns should be sensitive enough to generate an excessive number of notifications. Adoption of the third percentile for the curves from the two methods as the classification criterion would mean reporting 3% of the term birth cohort as suspected cases of microcephaly 11. Meanwhile,
the recommendation of lower cutoff points, that is, more specific and which would include lower percentages of births for investigation, might ex-clude cases that would warrant investigation to identify possible abnormalities.
In conclusion, critical and on-going analysis is necessary to support surveillance of micro-cephaly cases in newborns in the context of the current epidemic. Other clinical and/or phe-notypical criteria should be explored, as well as findings from imaging tests, in order to establish a more accurate gold standard and improve the
Table 2
Classification of newborns according to cutoff points adopted for head circumference (in centimeters): Fenton method, according to gestational age categories and sex; Intergrowth method, according to sex.
Fenton Intergrowth
Term/Post-term (males)
Cutoff Positive Negative Total Cutoff Positive Negative Total
≤ 32 (+) 87 28 115 ≤ 32 (+) 73 42 115
> 32 (-) 11 110 121 > 32 (-) 2 119 121
Total 98 138 236 Total 75 161 236
Term/Post-term (females)
Cutoff Positive Negative Total Cutoff Positive Negative Total
≤ 32 (+) 143 66 209 ≤ 31.5 (+) 102 26 128
> 32 (-) 2 152 154 > 31.5 (-) 11 224 235
Total 145 218 363 Total 113 250 363
Preterm
Cutoff Positive Negative Total
≤ 30 (+) 24 14 38
> 30 (-) 0 47 47
reporting, investigation, and treatment of cases. These aspects are crucial for improving
knowl-edge of this new syndrome, probably associated with the Zika virus infection.
References
1. Sene A. Ministério da Saúde investiga aumento de casos de microcefalia em Pernambuco. Caderno Vida Urbana. Diário de Pernambuco 2015. ht-tp://www.diariodepernambuco.com.br/app/noti cia/vida-urbana/2015/11/04/interna_vidaurba na,608239/ministerio-da-saude-investiga-aumen to-de-casos-de-microcefalia-em-pernambuco. shtml (accessed on 04/Nov/2015).
2. Secretaria Executiva de Vigilância em Saúde, Se-cretaria Estadual de Saúde. Possível alteração do padrão de ocorrência de microcefalia em nascidos vivos no Estado de Pernambuco. Recife: Secretaria Estadual de Saúde; 2015. (Nota Técnica, 43/15). 3. Ministério da Saúde. Ministério da Saúde confirma
relação entre vírus Zika e microcefalia. http://por talsaude.saude.gov.br/index.php/o-ministerio/ principal/secretarias/svs/noticias-svs/21016-mi nisterio-da-saude-confirma-relacao-entre-virus-zika-e-microcefalia (accessed on 30/Nov/2015). 4. Secretaria de Vigilância em Saúde, Ministério da
Saúde. Procedimentos preliminares a serem ado-tados para a vigilância dos casos de microcefalia no Brasil. Brasília: Ministério da Saúde; 2015. (No-ta Informativa, 01/2015 – COES Microcefalias). 5. Secretaria Executiva de Vigilância em Saúde,
Se-cretaria Estadual de Saúde. Protocolo clínico e epi-demiológico para investigação de casos de micro-cefalia. Versão no 1. Recife: Secretaria Estadual de Saúde; 2015.
6. Fenton TR, Kim JH. A systematic review and meta-analysis to revise the Fenton growth chart for pre-term infants. BMC Pediatrics 2013; 13:59.
7. Villar J, Ismail LC, Victora CG, Ohuma EO, Bertino E, Altman DG, et al. International standards for newborn weight, length, and head circumference by gestational age and sex: the Newborn Cross-Sectional Study of the INTERGROWTH-21st Proj-ect. Lancet 2014; 384:857-68.
8. Secretaria Executiva de Vigilância em Saúde, Se-cretaria Estadual de Saúde. Protocolo clínico e epi-demiológico para investigação de casos de micro-cefalia. Versão no 2. Recife: Secretaria Estadual de Saúde; 2015.
9. Woods CG, Parker A. Investigating microcephaly. Arch Dis Child 2013; 98:707-13.
10. Schuler-Faccini L, Ribeiro EM, Feitosa IML, Horo-vitz DDG, Cavalcanti DP, Pessoa A, et al. Possible association between Zika virus infection and mi-crocephaly – Brazil, 2015. MMWR Morb Mortal Wkly Rep 2016; 65:59-62.
11. Victora CG, Schuler-Faccini L, Matijasevich A, Ribeiro E, Pessoa A, Barros FC. Microcephaly in Brazil: how to interpret reported numbers? Lancet 2016; 387:621-4.
Contributors
W. V. Souza, T. V. B. Araújo, and M. F. P. M. Albuquerque contributed to the conception, analysis, and writing of the article. M. C. Braga collaborated in the writing and revision. R. A. A. Ximenes participated in the concep-tion, analysis, and revison. D. B. Miranda Filho collabo-rated in the conception and revision. L. C. A. Bezerra, G. S. Dimech, P. I. Carvalho, R. S. Assunção, R. H. Santos, and W. K. Oliveira contributed to the discussion and re-vision. L. C. Rodrigues and C. M. T. Martelli participated in the conception, analysis, and revision.
Acknowledgments
Resumo
O aumento das notificações de casos de microcefalia em Pernambuco, Brasil, e no Nordeste caracterizou uma epidemia que levou o Ministério da Saúde a de-cretar emergência nacional de saúde pública. Inicial-mente, o Ministério da Saúde definiu como suspeitos recém-nascidos de 37 semanas ou mais de idade ges-tacional (IG) e com perímetro cefálico (PC) ≤ 33cm, tendo, em dezembro de 2015, reduzido essa medida para 32cm. Este estudo objetivou estimar a acurácia, a sensibilidade e a especificidade de diferentes pontos de corte para o PC, utilizando curvas ROC e, como pa-drões-ouro, as curvas de Fenton e de Intergrowth 2014. Foram descritos os casos notificados em Pernambuco entre 2 de agosto de 2015 e 28 de novembro de 2015, segundo sexo e categorias de IG. Os métodos de Fenton e de Intergrowth fornecem curvas de crescimento para o PC de acordo com IG e sexo, considerando positivos para microcefalia os recém-nascidos com PC abaixo do percentil 3 dessas distribuições. Dos 684 casos noti-ficados, 599 foram recém-nascidos a termo/pós-termo. Para esses, as análises com curvas ROC mostram, se-gundo Fenton, que o ponto de corte que apresentou maior área sob a curva ROC, com sensibilidade maior que especificidade, foi 32cm, para ambos os sexos. Pelo método de Intergrowth, os pontos de corte, respeitando os mesmos critérios, são 32cm e 31,5cm, para os sexos masculino e feminino respectivamente. O ponto de corte identificado, segundo Fenton (32cm), coincidiu com a recomendação do Ministério da Saúde. Ado-tando-se Intergrowth como padrão, a escolha seria de 32cm, para o sexo masculino, e de 31,5cm, para o se-xo feminino. Concluindo, aponta-se a necessidade de realizar análises críticas e continuadas para avaliar pontos de corte, incluindo outras características para a definição de caso.
Microcefalia; Infecção por Zika Vírus; Vigilância Epidemiológica; Confiabilidade dos Dados
Resumen
El aumento de las notificaciones de casos de microce-falia en Pernambuco, Brasil, y en el Nordeste caracte-rizó una epidemia que condujo al Ministerio de Salud a decretar una emergencia nacional de salud pública. En un primer momento, el Ministerio de Salud definió como casos sospechosos a recién nacidos de 37 sema-nas o más de edad gestacional (IG) y con perímetro ce-fálico (PC) ≤ 33cm, siendo, en diciembre de 2015, redu-cida esa medida a 32cm. Este estudio tuvo por objetivo estimar la precisión, sensibilidad y especificidad de di-ferentes puntos de corte para el PC, utilizando curvas ROC y, como patrones oro, las curvas de Fenton y de Intergrowth (2014). Se describieron los casos notifica-dos en Pernambuco entre 2/Agosto/2015 y 28/Noviem-bre/2015, según sexo y categorías de IG. Los métodos de Fenton y de Intergrowth proporcionan curvas de crecimiento para el PC, de acuerdo con IG y sexo, con-siderando positivos para microcefalia los recién naci-dos con un PC debajo del percentil 3 de estas distribu-ciones. De los 684 casos notificados, 599 fueron recién nacidos a término/pos-término. Para estos, los análisis con curvas ROC muestran, según Fenton, que el pun-to de corte que presentó una mayor área bajo la curva ROC, con sensibilidad mayor que especificidad, fue 32 cm, para ambos sexos. Por el método de Intergrowth los puntos de corte, respetando los mismos criterios, son 32cm y 31,5cm para los sexos masculino y feme-nino, respectivamente. El punto de corte identificado, según Fenton (32cm), coincidió con la recomendación del Ministerio de Salud. Adoptándose Intergrowth co-mo patrón, la elección sería 32cm para el sexo mascu-lino y 31,5cm para el sexo femenino. Como conclusión, se apunta la necesidad de realizar análisis críticos y continuados para evaluar puntos de corte, incluyendo otras características para definición de caso.
Microcefalia; Infección por el Virus Zika; Vigilancia Epidemiológica; Exactitud de los Datos