ABSTRACT: Improvement of quality-related traits of grains is a constant concern in white oat breeding programs, which challenges breeders to understand their dynamics. The performance of different genetic combinations must be thoroughly evaluated to make high nutritional quality cultivars available. This study aimed to estimate the heterosis on F1 and F2 generations, vigor loss, due to inbreeding, and correlation between the grain chemical components to understand the dynamics of these traits, considering two segregating oat progenies. The populations Alba-sul × UPF 15 (population 1) and IAC 7 × UFRGS 19 (population 2) were developed. Both popula-tions showed transgressive segregant individuals. The combination Albasul × UPF 15 provided significant heterosis for traits β-glucan total and soluble fiber contents, while the population obtained by crossing IAC 7 × UFRGS 19 generated significant gain by heterosis for total fiber, insoluble fibers and non-structural carbohydrate contents. Considering the F2 average for each population, one can observe that population 1 presents higher β-glucan and lipid contents than population 2. On the other hand, population 2 has higher protein content than population 1. In both populations, the non-structural carbohydrate content is strongly and negatively correlated whith protein, total and insoluble fibers. Correlations between total fibers and lipids and between total fibers and insoluble fibers were both positive and high in both populations.
Keywords: Avena sativa, functional food, artificial hybridization, correlation 1Federal University of Pelotas/FAEM − Plant Genomics and
Breeding Center, C.P. 354 − 96010-900 − Pelotas, RS − Brazil.
2Agricultural Research and Rural Extension of Santa Catarina, C.P. 591 − 89500-000 − Caçador, SC − Brazil.
3University of Passo Fundo/FAMV/Center for Food Research − Cereal Lab., C.P. 611 − 99001-970 − Passo Fundo, RS − Brazil.
*Corresponding author <[email protected]>
Edited by: Leonardo Oliveira Medici
Heterosis and genetic parameters for grain quality in oat segregating populations
Solange Ferreira da Silveira Silveira1, Maraisa Crestani Hawerroth2, Danyela de Cássia da Silva Oliveira1, Leomar Guilherme
Woyann1, Helaine Claire Ferreira de Almeida1, Viviane Kopp da Luz1, Liamara Thurow1, Raíssa Martins da Silva1, Luiz Carlos
Gutkoski3, Luciano Carlos da Maia1, Antonio Costa de Oliveira1*
Received September 10, 2015 Accepted November 19, 2015
Introduction
Oats (Avena sativa L.) is considered an important cereal crop in many regions worldwide.
Over 23.8 million metric tons of oat grains were produced worldwide in 2013 (FAO, 2015). Human con-sumption of oats is becoming a major trend due to its excellent nutritional profile (Ahmad et al., 2014; Butt et al., 2008). Oats has high protein quality, antioxidant components, high lipid contents (especially unsaturated fatty acid) and high fiber rates (Biel et al., 2014; Crest-ani et al., 2012; Daou and Zhang, 2012; Marshall et al., 2013; Rasane et al., 2013).
When oat grain is allocated to animal feeding, a high content of lipids, protein and carbohydrates, and lower fiber contents are required (Hizbai et al., 2012; Martinez et al., 2010). In contrast, for human consump-tion, grains with low lipid contents, rich in protein and fiber are preferred, especially β-glucans, which are re-lated to reduced levels of cholesterol and sugar in the blood, weight loss as well as cancer prevention (Bae et al., 2009; Daou and Zhang, 2012; Hooda et al., 2010; Lazaridou and Biliaderis, 2007; Peterson et al., 2005).
The analysis of oat cultivars released in Brazil from 1982 to 1996 indicated that oat breeding programs reached a linear genetic gain for the traits cycle, grain yield, grain weigth and hectoliter weigth (Barbosa Neto et al., 2000). From the 1970's to 2013, the Brazilian aver-age yield ranged from 940 to 2,290 kg ha−1 (FAO, 2015).
Nevertheless, oat breeders should also pay attention to the industrial and nutritional quality, due to an increas-ing demand for functional foods.
Artificial crosses allow recombination of different alleles, creating a wide range of recombinants (Pandini et al., 1997). Plant breeders must evaluate the perfor-mance of populations to predict the potential of differ-ent combinations. Crosses with variability and combina-tions that contain the most favorable alleles for target traits are desirable. In addition, the correlation analysis allows identifying traits that could be used for indirect selection (Falconer and Mackay, 1996).
This study aimed to estimate heterosis in F1 and F2 generations, vigor loss due to inbreeding and correla-tion among the grain chemical components in order to understand the dynamics of these traits, considering two segregating oat progenies.
Materials and Methods
Soil preparation followed the same procedures used by Hawerroth et al. (2013). The soil chemical features at the time of the experiment were: organic matter 2 %, water pH 5.5, SMP index 6.5, P 19.7 mg dm−3, K 80.0 mg dm−3, Al
0.1 cmolc dm−3, Ca 2.5 cmol c dm
−3 and Mg 0.8 cmol c dm
−3.
Based on these analyses, the fertilization corrections with macronutrients (NPK) were performed to supply the de-mands for a grain yield ca. 2.0 t ha−1.
At the end of the reproductive cycle, grains from each plant from the F2 populations and from each row of parents and F1 generations were harvested, treshed and stored individually in a cold chamber at 12 °C for the chemical analyses. The following traits corresponding to the chemical composition of white oat grains were evalu-ated: protein content (PROT), lipid (LIP), total fibers (TF), soluble fibers (SF), insoluble fibers (IF), β-glucans (BGLU) and non-structural carbohydrate (NSC). These traits were chosen according to different grain end-use requirements.
For the chemical quality analyses, the near-infrared reflectance spectrophotometry (NIRS) was used. According to the technique requirements, samples were manually de-hulled until 7 g of crushed material was obtained for each plant of the segregating populations. Grains were crushed and sieved in an electric mill with a 0.5-mm mesh. The flour was analyzed in an NIRS instrument in Passo Fundo, Rio Grande do Sul State, Brazil.
Calibration curves were applied using the software ISI (Infrasoft International of NIR Systems, version 4.0, 1996) by performing the analyses on 100 white oat sam-ples, according to the recommended methods (AOAC, 1997; AACC, 2010). The value of protein content was obtained by multiplying the correction factor 5.83 for N content identified in the sample. Non-structural carbohy-drate was determined by difference. NIRS readings were performed as triplets and the results expressed as g 100 g−1
on a dry basis.
The obtained results were analyzed by a distribution frequency and univariate statistical methods of position and dispersion measures: average, minimal and maximum, coeficient of variation (CV), skewness (S) and kurtosis (K). The reference values adopted for the skewness coeficient were: S = 0, normal distribution; S < 0, asymetric distribu-tion to the left; S > 0, asymetric distribudistribu-tion to the right. Regarding kurtosis, the reference values were: K = 0, nor-mal distribution (mesocurtic); K > 0, thinner than nornor-mal distribution (leptokurtic); K < 0, flatter than normal distri-bution (platykurtic) (O'Rourke et al., 2005).
Heterosis, heterosis significance and vigor loss were calculated, as reported before (Crestani et al., 2012). In ad-dition, a Pearson Correlation (Steel and Torrie, 1960) was performed to estimate the association of traits.
The analyses were performed using the software SAS (Statistical Analysis System,version 9.3, 1999).
Results and Discussion
The largest contrast observed between parents was for the β-glucan content (Table 1). However, the
coeffi-cient of variation was considered high for both populations (23.98 and 26.61, for populations 1 and 2, respectively). Population 1 (Albasul × UPF 15) presented a significant F1 heterosis gain (19 %), vigor loss due to inbreeding (10 %) in the F2.Individuals with β-glucan were observed with val-ues ranging from 2.47 to 9.11 g 100 g−1. There are reports
on oat β-glucan values ranging from 2.85 to 8 g 100 g−1
(Crestani et al., 2012; Redaelli et al., 2013; Skendi et al., 2003).
Although parental β-glucan averages were higher in population 2 (IAC 7 × UFRGS 19), F1 and F2 averages were lower than those obtained for population 1. The average performance of F1 was higher (19 %) and lower (-11 %) than the parental averages for populations 1 and 2, respec-tively. Considering vigor loss due to inbreeding depression in F2, a higher loss (17 %) was observed for population 2 than for population 1 (10 %) suggesting the presence of non-additive interactions. According to previous reports, the β-glucan content in oat grains appears to be controlled by genes with predominant additive effects (Cervantes-Martinez et al.,2001). In barley, a diploid species, it was suggested that only the gene HvCslF6 has high influence on the synthesis of β-glucans in the grains (Taketa et al., 2012). One of the parents of population 2, IAC 7 has a supe-rior industrial quality, with high β-glucan content (Crestani et al., 2012). The progeny originating from the cross be-tween IAC 7 and UFRGS 19 showed individuals with aver-age performance inferior to IAC 7 regarding the β-glucan content. Lack of complementarity was therefore observed between IAC 7 and UFRGS 19 for genes contributing to higher fiber content. There is possibility of episthatic inter-actions for this trait, as well as the specific gene combina-tion in IAC 7, promotes high accumulacombina-tion of BGLU.
In population 2, transgressive segregants were also observed for BGLU, with minimum and maximum val-ues equal to 1.85 and 9.18 g 100 g−1, respectively. Positive
transgressive segregant individuals are desired by breed-ers aiming to obtain higher β-glucan contents, given their health benefits (Daou and Zhang, 2012; Hooda et al., 2010; Whitehead et al., 2014).
One experiment that evaluated 658 European oat genotypes reported the presence of individuals with the maximum of 6.77 g 100 g−1 of BGLU content (Redaelli et
al., 2013). Other studies on cultivars in the United States reported the BGLU content to around 5 g 100 g−1 (Doehlert
et al., 2013; Peterson et al., 2005). In genotypes in Brazil, in-dividuals from both populations with even higher contents were observed (Table 1).
According to skewness coefficients shown on Table 1, both populations presented positive values (0.35 and 0.48). A graphical frequency distribution of populations 1 and 2 shows population 2 has higher probability to obtain individuals with a performance below the average (Figures 1A-B). A leptokurtic distribution (kurtosis = 0.38) for the
The total fiber content ranges between 9.6 and 14.6 g 100 g−1, dependending on the genotype, environmental
conditions, and the evaluation method adopted (Gutkoski and Trombetta, 1999; Manthey et al., 1999; Silva and Ci-occa, 2005). Compared to these contents, the TF contents observed in the present work for parents and progenies are relatively low (Table 1). The gain obtained by hetero-sis was significant in both populations and both generated transgressive segregant individuals, however, in population 2, the individual with the highest TF content was obtained (11.10 g 100 g−1)(Table 1). Positive segregant individuals
represent potential elite genotypes for the development of high fiber containing cultivars. Diets with a high fiber content are a current trend in medical treatments, given the overwhelming incidence of obesity, diabetes and heart diseases (Sikora et al., 2013).
Even when low contrast parents were adopted, indi-viduals with TF content higher than that of the best parent were obtained. This indicates the possibility to recover trans-gressive segregants from crosses involving parents with sim-ilar phenotype, probably because of complementary genes. Population 2 displayed a highly positive skewness distribution (1.10) (Table 1), indicating that most individuals had a performance lower than the average of the popula-tion. The kurtosis coefficient (2.82) (Table 1) characterized a leptokurtic distribution and, consequently, a low phenotypic variability for the trait in F2 generation (Figures 1C-D).
Insoluble fibers are composed by lignin, unsoluble pectins, cellulose and hemicellulose and integrate the total fiber portion (Butt et al., 2008).
In both populations, the average IF content was 5.9 g 100 g−1 (Table 1). Previously, the IF content was observed at
levels between 4.9 and 9.2 g 100 g−1 (Doehlert et al., 2013;
Gutkoski and Trombetta, 1999; Manthey et al., 1999; Silva and Ciocca, 2005). Only population 2 showed significant heterotic gain for the IF content (Table 1), which
originat-ed positive segregating individuals with higher IF content than parents did (8.02 g 100 g−1). However, a larger number
of individuals with performance below the parental aver-age were also obtained (Figures 1E-F).
Soluble fibers comprise soluble pectins, gums, mucilage and some hemicellulose type molecules, and integrate the total fiber portion (Butt et al., 2008). In population 1, heterosis gains as well as vigor loss due to inbreeding were observed (Table 1). In general, either for populations or for their parents, SF contents around 3.5 g 100 g−1 were observed. Other studies have found
similar (Crestani et al., 2012; Silva and Ciocca, 2005) or higher (5.33 g 100 g−1) values (Gutkoski and Trombetta,
1999). For many years, oat-breeding programs have fo-cused on higher yields, resulting in increases in grain weight and size, reflecting on a higher non-structural carbohydrate accumulation.
Both studied populations presented positive skew-ness and platykurtic distribution (Figures 1G-H), indica-tive of a higher dispersion for the SF content.
The PROT content in oats is higher than in other ce-reals. It presents high digestibility and a balanced amino acid composition (Biel et al., 2014; Doehlert et al., 2013; Hawerroth et al., 2013; Klose and Arendt, 2012). For the PROT content, an absence in heterosis gain in both popu-lations was observed (Table 1), which can be an indicative of low combining ability between the parents, possibly due to the presence of similar loci that expresses reduced average performance for the trait, even after genetic re-combination. An absence of hybrid vigor in F1 does not mean that the populations had to be discarded, since dis-tinct phenotypic classes can occurr in F2.
The average PROT content in population 1 was 17.2 g 100 g−1, similar to the average PROT content
re-ported by Hawerroth et al. (2013) for Brazilian cultivars (18.71 g 100 g−1) and also by Doehlert et al. (2013) that
an-Table 1 − Results from the descriptive statistical analysis of oat grain chemical components (g 100 g−1) for both F
2 segregant populations,
parental and F1 average contents, heterosis (HF1) and vigor loss due to inbreeding (LV).
Population Character G1 G2 F1 HF1 Average (F2) LV σ (F2) MiV (F2) MaV (F2) CV (F2) S K
% % %
POP1 BGLU 5.81 4.07 5.93 19.90* 5.31 10.42 1.27 2.47 9.11 23.98 0.35 -0.13
PROT 17.19 19.09 18.70 3.08 18.62 0.41 1.07 15.97 21.68 5.75 0.33 0.38
Albasul LIP 8.14 7.94 9.17 13.96 7.59 17.18 0.85 5.43 9.85 11.22 0.14 -0.22
× TF 9.49 9.47 10.00 5.82* 9.33 6.70 0.35 8.59 10.23 3.76 0.37 -0.18
UPF 15 IF 6.13 5.83 6.15 2.91 5.92 3.78 0.48 4.87 7.09 8.09 0.30 -0.43
SF 3.36 3.67 3.86 9.81* 3.44 10.82 0.17 3.12 3.82 5.03 -0.10 -0.92
NSC 65.16 63.53 65.28 1.21 62.5 4.25 1.59 57.86 66.97 2.55 -0.28 0.28
POP2 BGLU 7.60 5.54 5.80 -11.73* 4.81 17.03 1.30 1.85 9.18 26.61 0.48 0.38
PROT 20.16 18.91 19.66 0.61 20.10 -2.26 1.56 15.83 24.95 7.75 0.60 0.93
IAC 7 LIP 7.64 7.93 7.75 -0.48 6.46 16.61 0.68 4.66 8.35 0.68 -0.13 0.23
× TF 9.88 9.23 10.27 7.47* 9.37 8.76 0.40 8.62 11.10 4.30 1.10 2.82
UFRGS 19 IF 6.29 5.83 6.60 8.81* 5.91 10.39 0.52 4.97 8.02 8.86 0.94 1.98
SF 3.72 3.43 3.68 3.04 3.53 4.14 0.20 3.07 3.90 5.66 -0.32 -0.87
NSC 62.44 64.52 66.00 3.97* 62.08 5.94 2.02 54.39 66.27 3.26 -0.61 0.79
alyzed popular oat cultivars (18.11 g 100 g−1) from North
America. In a previous study on oat cultivars and lines from breeding programs in the United States, Canada and the Netherlands, an average equal to 16.5 g 100 g−1 (Peterson et
al., 2005) was found. A lower PROT content (13.7 g 100 g−1)
was observed for genotypes in Poland (Biel et al., 2014). Population 2 presented higher PROT content aver-age (20.10 g 100 g−1) than population 1 in F
2, and no vigor
loss was observed for this trait. This population showed positive transgressive segregant individuals, displaying high PROT content. They are good candidates to generate elite lines for animal feeding and human consumption.
Earlier reports from our group (Crestani et al., 2012) have shown that IAC 7 had a great potential to generate progenies with high protein content. In our work, IAC 7 has high PROT and BGLU contents, and combined with genotype UFRGS 19, it has the ability to originate equally rich individuals regarding the PROT content, however, with low BGLU content.
The frequency distribution for populations 1 and 2 is shown in Figures 2A-B. In both cases, a leptokurtic distribution was observed with a large concentration of individuals similar to the average.
For the LIP content, the F1 generation of population 1 presented higher content than its parents did, however, a significant heterosis value was not observed (Table 1). Both populations presented vigor loss due to inbreeding, resulting in an F2 generation with LIP content lower than that of the parental average, suggesting the presence of non-additive allelic interactions. The LIP content is a poly-genic trait and high oil content is under a partial control of allelic dominance (Frey and Hammond, 1975). Moreover, the presence of pleiotropic effects in LIP synthesis was sug-gested (Hizbai et al., 2012). At the same time, QTLs (Quan-titative Trait Loci) have been detected for the LIP content in oats (Tanhuanpää et al., 2010; Tanhuanpää et al., 2012).
The average LIP content for populations 1 and 2 were equal to 7.59 and 6.46 g 100 g−1, respectively.
Con-tents between 6 and 9.4 g 100 g−1 have been reported
previously (Crestani et al., 2012; Doehlert et al., 2013; Peterson et al., 2005).
Both parental combinations generated transgres-sive segregant individuals with either higher or lower grain LIP content. Oat grains with high LIP content are desirable in animal feed, due to the high caloric content (Hizbai et al., 2012; Martinez et al., 2010). On the other
hand, a low LIP content is desirable for human con-sumption (Peterson et al., 2005). The data distribution for this trait on both populations is shown. Skewness and kurtosis were similar to zero, suggesting normal data distribution (Figures 2C-D).
F2 generations with higher LIP and lower PROT contents (Population 1), high PROT and low LIP con-tents (Population 2) were observed. In fact, QTLs affect-ing simultaneously PROT and LIP contents have been described in oats (Tanhuanpää et al., 2012).
Considering the NSC content, there was significant heterosis only for population 2, followed by a reduced vigor loss (Table 1). For both populations, the average of F2 genera-tion was lower than that of the parents showing poor perfor-mance. Considering the performance showed by population 2, a lower NSC content was observed, which was previously observed in IAC 7 progenies (Crestani et al., 2012).
The NSC content in populations 1 and 2 were 65.16 and 62.44 g 100 g−1, respectively. This value was a
bit lower than the average (67.56 g 100 g−1) found in
pre-vious reports for oat cultivars in Brazil (Hawerroth et al., 2013). For genotypes in Poland, the average NSC content was equal to 13.7 g 100 g−1 (Biel et al., 2014).
Transgressive segregants with NSC higher than the average plus a standard deviation were obtained in both populations. These genotypes can be promising not only because they represent a higher accumulation of energy in the caryopsis, but also because they normaly have high-er grain size. Both populations showed negative kurtosis distributions, increasing the possibility of selecting indi-viduals with above average NSC content (Figures 2E-F).
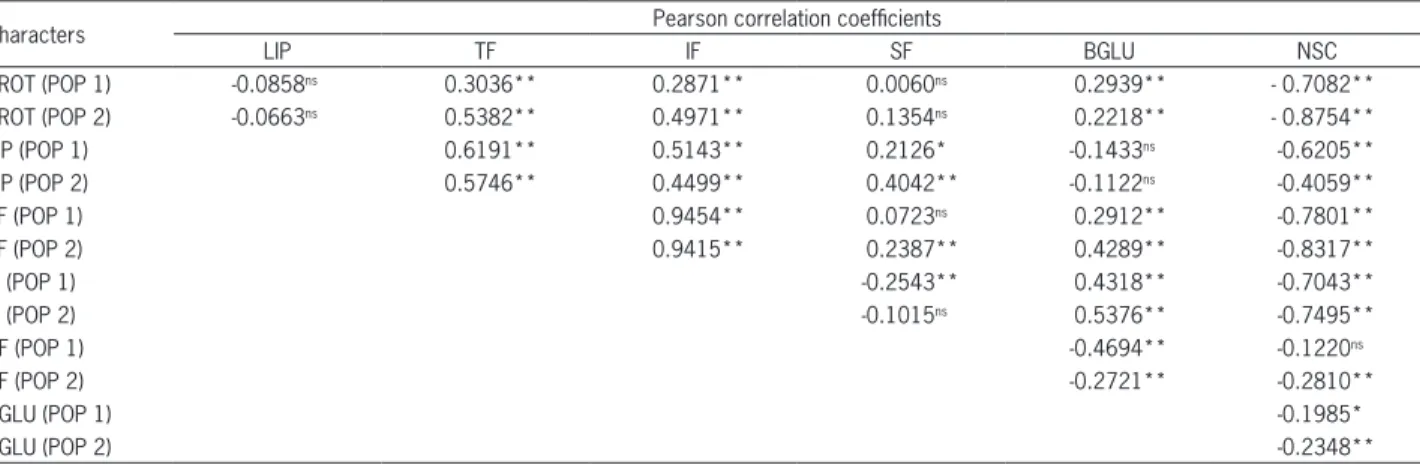
Correlation values are meaningful depending on their sign (positive or negative) and magnitude, and esti-mated values below -0.50 and above 0.50 are usually ac-cepted (Lopes et al., 2002). Many significant correlations were found, however, within the interval 0.50 and -0.50 (Table 2). This could be a reflection of the large number of individuals measured, resulting in a greater number of freedom degrees used by the t test. With a few excep-tions, the significance and magnitude of the correlations remained similar between the two populations.
The NSC content presented negative correlations with all other traits for both populations. Negative and high magnitude (below -0.50) correlations were observed between contents of NSC and those of PROT, TF and IF. These negative correlations have been previously reported (Biel et al., 2014; Crestani et al., 2012; Peterson et al., 2005). In addition, the amylose content, a starch component, pre-sented negative correlation with the PROT content (Hang et al., 2007). NSC was also negatively correlated with LIP, but only for population 1 with high magnitude (-0.62).
Negative correlations between the NSC content and the other chemical components suggest that the in-crease in the starch content is not accompanied by an increase in contents of PROT, IF and TF. TFs are com-posed of IF and SF. TF contents were positively correlat-ed (above 0.50) with the IF content in both populations, however, with SF only in population 1. A positive cor-relation between LIP and TF was also observed (above 0.50). Although no biological explanation was found for this correlation, some pleiotropic or linkage effect may be the cause for these associations.
PROT and BGLU were significant and positively correlated, although with low magnitude. In barley, the
β-glucan content remained positively correlated with the protein content throughout selection (Hang et al., 2007). For both populations, there were no significant associations between PROT and LIP, PROT and SF, or LIP and BGLU traits. The lack of association between PROT and LIP could be a result of interference of the NSC content, masking potential associations. These populations have been improved to form RILs (Recom-binant Inbred Lines) and associations will be tested within pools of large and small grains to isolate NSC effects.
Understanding the dynamics of traits related to grain chemical composition in oats is essential for genetic gains related to grain chemical components. The associations between LIP, PROT and fiber con-tents display a complexity that is dependent not only on the grain chemical composition of superior geno-types, but also on their ability of transmitting their properties to the progeny, as observed for the culti-var IAC 7.
The reported populations have different perfor-mances for the evaluated traits, however, both present transgressive segregant individuals for these traits. The combination Albasul × UPF 15 generated heterosis for contents of BGLU, TF and SF, while the population ob-tained from the cross IAC 7 × UFRGS 19 generated heterosis for contents of TF, IF and NSC. Considering the average of F2 generation for each population, we observed that population 1 presented higher BGLU and LIP contents than population 2 did. On the other hand, the PROT content was higher in population 2 than in population 1. In both populations, the NSC content is strongly and negatively correlated (below -0.50) whith PROT, TF and IF. The correlations were positive and high (above 0.50) between TF and LIP, and between TF and IF, for both populations.
Acknowledgments
The authors are thankful to the Brazilian National Council for Scientific and Technological Development (CNPq), Coordination for the Improvement of Higher Level Personnel (CAPES) and Rio Grande do Sul State Research Assistance Foundation (FAPERGS) for grants and fellowship support.
References
Ahmad, W.S.; Rouf, S.T.; Bindu, B.; Ahmad, N.G.; Amir, G.; Khalid, M.; Pradyuman, K. 2014. Oats as a functional food: a review. Universal Journal of Pharmacy 3: 14-20.
American Association of Cereal Chemists [AACC]. 2010. Approved Methods of Analysis. 11ed. AACC, Saint Paul, MN, USA. Association of Official Analytical Chemists - International [AOAC]. 1997.
Official Methods of Analysis. 16ed. AOAC, Washington, DC, USA. Bae, I.Y.; Lee, S.; Kim, S.M.; Lee, H.G. 2009. Effect of partially
hydrolyzed oat β-glucan on the weight gain and lipid profile of mice. Food Hydrocolloids 23: 2016-2021.
Barbosa Neto, J.F.; Matiello, R.R.; Carvalho, F.I.F.; Oliveira, J.M.S.; Pegoraro, D.G.; Schneider, F.; Sordi, M.E.B.; Vacaro, E. 2000. Genetic progress in oat breeding in southern Brazil. Pesquisa Agropecuária Brasileira 35: 1605-1612 (in Portuguese, with abstract in English). Biel, W.; Jacyno, E.; Kawęcka, M. 2014. Chemical composition of
hulled, dehulled and naked oat grains. South African Journal of Animal Science 44: 189-197.
Butt, M.S.; Tahir-Nadeem, M.; Khan, M.K.I.; Shabir, R.; Butt, M.S.A. 2008. Oat: unique among the cereals. European Journal of Nutrition 47: 68-79.
Cervantes-Martinez, C.T.; Frey, K.J.; White, P.J.; Wesenberg, D.M.; Holland, J.B. 2001. Selection for greater β-glucan content in oat grain. Crop Science 41: 1085-1091.
Crestani, M.; Silveira, S.S.F.; Tessmann, E.W.; Mezzalira, I.; Luche, H.S.; Silva, J.A.G.; Gutkoski, L.C.; Carvalho, F.I.F.; Costa de Oliveira, A. 2012. Combining ability for grain chemistry quality traits in a white oat diallelic cross. Euphytica 184: 139-156.
Table 2 − Values of Pearson correlation coefficients betwen protein (PROT), lipid (LIP), total fiber (TF), insoluble fiber (IF), soluble fiber (SF),
β-glucan (BGLU) and non-structural carbohydrate (NSC), measured in two segregant population F2 - POP1 (Albasul × UPF 15) and POP2 (IAC 7 × UFRGS 19).
Characters Pearson correlation coefficients
LIP TF IF SF BGLU NSC
PROT (POP 1) -0.0858ns 0.3036** 0.2871** 0.0060ns 0.2939** - 0.7082**
PROT (POP 2) -0.0663ns 0.5382** 0.4971** 0.1354ns 0.2218** - 0.8754**
LIP (POP 1) 0.6191** 0.5143** 0.2126* -0.1433ns -0.6205**
LIP (POP 2) 0.5746** 0.4499** 0.4042** -0.1122ns -0.4059**
TF (POP 1) 0.9454** 0.0723ns 0.2912** -0.7801**
TF (POP 2) 0.9415** 0.2387** 0.4289** -0.8317**
IF (POP 1) -0.2543** 0.4318** -0.7043**
IF (POP 2) -0.1015ns 0.5376** -0.7495**
SF (POP 1) -0.4694** -0.1220ns
SF (POP 2) -0.2721** -0.2810**
BGLU (POP 1) -0.1985*
BGLU (POP 2) -0.2348**
Daou, C.; Zhang, H. 2012. Oat beta-glucan: its role in health promotion and prevention of diseases. Comprehensive Reviews in Food Science and Food Safety 11: 355-365.
Doehlert, D.C.; Simsek, S.; Thavarajah, D.; Thavarajah, P.; Ohm, J. 2013. Detailed composition analyses of diverse oat genotype kernels grown in different environments in North Dakota. Cereal Chemistry 90: 572-578.
Falconer, D.S.; Mackay, T.F.C. 1996. Introduction to Quantitative Genetics. 4ed. Longman, Edinburgh, UK.
Food and Agriculture Organization [FAO]. 2015. FAOSTAT: data prodution/crops. Available at: http: //faostat.fao.org/site/339/ default.aspx [Accessed Out 18, 2015]
Frey, K.J.; Hammond, E.G. 1975. Genetics, characteristics, and utilization of oil in caryopses of oat species. Journal of the American Oil Chemists’ Society 52: 358-362.
Gutkoski, L.C.; Trombetta, C. 1999. Evaluation of dietary fiber and beta-glucan levels in oat (Avena sativa L.) cultivars. Ciência e Tecnologia de Alimentos. Available at: http://www.scielo.br/ scielo.php?script=sci_arttext&pid=S0101-20611999000300016 [Accessed Dec 12, 2014] (in Portuguese, with abstract in English).
Hang, A.; Obert, D.; Gironella, A.I.N.; Burton, C.S. 2007. Barley amylose and β-glucan: their relationships to protein, agronomic traits, and environmental factors. Crop Science 47: 1754-1760. Hawerroth, M.C.; Carvalho, F.I.F.; Oliveira, A.C.; Silva; J.A.G.;
Gutkoski, L.C.; Sartori, J.F.; Woyann, L.G.; Barbieri, R.L.; Hawerroth, F.J. 2013. Adaptability and stability of white oat cultivars in relation to chemical composition of the caryopsis. Pesquisa Agropecuária Brasileira 48: 42-50.
Hizbai, B.T.; Gardner, K.M.; Wight, C.P.; Dhanda, R.K.; Molnar, S.J.; Johnson, D.; Frégeau-reid, J.; Yan, W.; Rossnagel, B.G.; Holland, J.B.; Tinker, N.A. 2012. Quantitative trait loci affecting oil content, oil composition, and other agronomically important traits in oat. The Plant Genome Journal 5: 164-175. Hooda, S.; Matte, J.J.; Vasanthan, T.; Zijlstra, R.T. 2010. Dietary oat
β-glucan reduces peak net glucose flux and insulin production and modulates plasma incretin in portal-vein catheterized grower pigs. The Journal of Nutrition 140: 1564-1569.
Klose, C.; Arendt, E.K. 2012. Proteins in oats: their synthesis and changes during germination; a review. Critical Reviews in Food Science and Nutrition 52: 629-639.
Lazaridou, A.; Biliaderis, C.G. 2007. Molecular aspects of cereal
β-glucan functionality: physical properties, technological applications and physiological effects. Journal of Cereal Science 46: 101-118.
Lopes, A.C.A.; Vello, N.A.; Pandini, F.; Rocha, M.M.; Tsutsumi, C.Y. 2002. Variability and correlations among traits in soybean crosses. Scientia Agricola 59: 341-348 (in Portuguese, with abstract in English).
Manthey, F.A.; Hareland, G.A.; Huseby, D.J. 1999. Soluble and insoluble dietary fiber content and composition in oat. Cereal Chemistry 76: 417-420.
Marshall, A.; Cowan, S.; Edwards, S.; Griffiths, I.; Howarth, C.; Langdon, T.; White, E. 2013. Crops that feed the world 9. Oats: a cereal crop for human and livestock feed with industrial applications. Food Security 5: 13-33.
Martinez, M.F.; Arelovich, H.M.; Wehrhahne, L.N. 2010. Grain yield, nutrient content and lipid profile of oat genotypes grown in a semiarid environment. Field and Crop Research 116: 92-100. O'Rourke, N.; Hatcher, L.; Stepanski, E.J. 2005. A step-by-step
approach to using SAS for univariate & multivariate statistics. SAS Institute, Cary, NC, USA.
Pandini, F.; Carvalho, F.I.F.; Barbosa Neto, J.F. 1997. Plant height reduction in populations of triticale (X. triticosecale Wittmack) by induced mutations and artificial crosses. Brazilian Journal of Genetics. Available at: http://dx.doi.org/10.1590/S0100-84551997000300020 [Accessed Dec 15, 2014]
Peterson, D.M.; Wesenberg, D.M.; Burrup, D.E.; Erickson, C.A. 2005. Relationships among agronomic traits and grain composition in oat genotypes grown in different environments. Crop Science 45: 1249-1255.
Rasane, P.; Jha, A.; Sabikhi, L.; Kumar, A.; Unnikrishnan, V.S. 2013. Nutritional advantages of oats and opportunities for its processing as value added foods: a review. Journal of Food Science and Technology 52: 662-675.
Redaelli, R.; Del Frate, V.; Bellato, S.; Terracciano, G.; Ciccoritti, R.; Germeier, C.U.; De Stefanis, E.; Sgrulletta, D. 2013. Genetic and environmental variability in total and soluble b-glucan in European oat genotypes. Journal of Cereal Science 57: 193-199. Sikora, P.; Tosh, S.M.; Brummer, Y.; Olsson, O. 2013. Identification
of high β-glucan oat lines and localization and chemical characterization of their seed kernel β-glucans. Food Chemistry 137: 83-91.
Silva, L.P.; Ciocca, M.L.S. 2005. Total, insoluble and soluble dietary fiber values measured by enzymatic-gravimetric method in cereal grains. Journal of Food Composition and Analysis 18: 113-120.
Skendi, A.; Biliaderis, C.G.; Lazaridou, A.; Izydorczyk, M.S. 2003. Structure and rheological properties of water soluble β-glucans from oat cultivars of Avena sativa and Avena bysantina. Journal of Cereal Science 38: 15-31.
Steel, R.G.D.; Torrie, J.H. 1960. Principles and Procedures of Statistics. McGraw-Hill, New York, NY, USA.
Taketa, S.; You, T.; Tonooka, T.; Tsumuraya, Y.; Inagaki, Y.; Haruyama, N.; Larroque, O.; Jobling, A.S. 2012. Functional characterization of barley betaglucanless mutants demonstrates a unique role for CslF6 in (1, 3; 1, 4)- β-D-glucan biosynthesis. Journal of Experimental Botany 63: 381-392.
Tanhuanpää, P.; Manninen, O.; Kiviharju, E. 2010. QTLs for important breeding characteristics in the doubled haploid oat progeny. Genome 53: 482-493.
Tanhuanpää, P.; Manninen, O.; Beattie, A.; Eckstein, P.; Scoles, G.; Rossnagel, B.; Kiviharju, E. 2012. An updated doubled haploid oat linkage map and QTL mapping of agronomic and grain quality traits from Canadian field trials. Genome 55: 289-301.