Characterization of ß-trypsin at acid pH
by differential scanning calorimetry
1Instituto de Estudos Avançados em Medicina Veterinária,
Universidade de Uberaba, Uberaba, MG, Brasil
Departamentos de 2Bioquímica e Imunologia, and 3Fisiologia e Biofísica,
Instituto de Ciências Biológicas, Universidade Federal de Minas Gerais, Belo Horizonte, MG, Brasil
4Departamento de Ciências Fisiológicas, Centro de Ciências Biológicas,
Universidade Federal de Santa Catarina, Florianópolis, SC, Brasil E.R. Bittar1,2,
F.R. Caldeira2,
A.M.C. Santos2,
A.R. Günther4,
E. Rogana3 and
M.M. Santoro2
Abstract
Trypsin is a serino-protease with a polypeptide chain of 223 amino acid residues and contains six disulfide bridges. It is a globular protein with a predominance of antiparallel ß-sheet and helix in its secondary structure and has two domains with similar structures. We assessed the stability of ß-trypsin in the acid pH range using microcalorimetric (differential scanning calorimetry) techniques. Protein concentrations varied in the range of 0.05 to 2.30 mg/ml.Buffer solutions of 50.0 mM ß-alanine and 20.0 mM CaCl2 at different pH values (from 2.0 to 4.2)
and concentrations of sorbitol (1.0 and 2.0 M), urea (0.5 M) or guanidinium hydrochloride (0.5 and 1.0 M) were used. The data suggest that we are studying the same conformational transition of the protein in all experimental situations using pH, sorbitol, urea and guanidinium hydrochloride as perturbing agents. The observedvan’t Hoff ratios (∆Hcal/∆HvH) of 1.0 to 0.5 in the pH range of 3.2 to 4.2
suggest protein aggregation. In contrast, ∆Hcal/∆HvH ratios equal to
one in the pH range of 2.0 to 3.2 suggest that the protein unfolds as a monomer. At pH 3.00, ß-trypsin unfolded with Tm = 54ºC and ∆H =
101.8 kcal/mol, and the change in heat capacity between the native and unfolded forms of the protein (∆Cp) was estimated to be 2.50 ± 0.07 kcal mol-1 K-1. The stability of ß-trypsin calculated at 298 K was ∆G
D
= 5.7 kcal/mol at pH 3.00 and ∆GD = 15.2 kcal/mol at pH 7.00, values
in the range expected for a small globular protein. Correspondence
M.M. Santoro
Departamento de Bioquímica e Imunologia, ICB, UFMG Caixa Postal 486
30161-970 Belo Horizonte, MG Brasil
E-mail: [email protected]
Received July 19, 2002 Accepted September 2, 2003
Key words
•ß-Trypsin
•Thermal denaturation
•Differential scanning calorimetry
Introduction
The biological activity of proteins depends on the struc-ture and three-dimensional conformation of their polypep-tide chains. These conformations are the result of the thermodynamically driven folding of the linear amino acid sequence, allowing proteins to change from a nonfunc-tional and unordered structure to a well-defined, compact and active form.
three-dimensional structure proteins. Thermodynamic analysis is simplified if one can describe the denaturation process as a simple transition between two macroscopic states (native and denatured). In contrast, for large proteins, an increase in temperature induces unfolding of isolated domains, an event that cannot be regarded as a simple two-state process (2).
The success of thermodynamic analysis of protein fold-ing and unfoldfold-ing is directly dependent on the method of determination of the thermodynamic parameters and the characteristics of the protein analyzed. Differential scan-ning calorimetry (DSC) is an experimental tool capable of determining the calorimetric parameters ∆GD, ∆HD, ∆SD and ∆CpD associated with a given conformational change of the protein induced by temperature variation. A special type of microcalorimeter with adequate technical charac-teristics for data acquisition from aqueous protein solutions of relatively low concentration is necessary for DSC. The DSC apparatus integrates hardware and software which allow data acquisition, analysis, and deconvolution (3).
In this context, ß-trypsin is a very interesting model for the microcalorimetric study of a serine protease since it exhibits 223 amino acid residues that are presented in two similar domains (4), its three-dimensional structure is known, it possesses high reversibility for the type of denaturation utilized (thermal), and shows great stability in its native form. Trypsin stability has been investigated using solvent denaturation (5,6) and calorimetry (7), but these authors did not adequately explore different experimental condi-tions.Thus, the objective of the present investigation was to study the thermodynamic characteristics of the revers-ible thermal denaturation of ß-trypsin under several solvent conditions and in the presence of different protein concen-trations in the acid range (pH 2.0 to 4.5) using DSC. This is part of an ongoing research project that ultimately aims to compare the stability of ß-trypsin with its zymogen under similar experimental conditions and to describe the activa-tion process of a typical serine protease from a thermody-namic point of view.
Material and Methods
Purification of ß-trypsin. Trypsin was purified by the
chromatographic procedure described by Schroeder and Shaw (8) and Higaki and Light (9). For purification, 250 mg of commercial bovine trypsin (Sigma, St. Louis, MO, USA) was dissolved on an ice bath in 5.0 ml Tris-HCl buffer
(100.0 mM Tris-HCl, 20.0 mM calcium chloride, 100.0 mM sodium chloride and 1.0 mM benzamidine), pH 7.10. The solution was applied to a SE-Sephadex C-50 column (2.0 x 110.0 cm; 345.0 cm3 volume) and was eluted with the same buffer (isocratic) at a constant flow of 7.0 ml/h. The fractions were collected using an automatic collector (Phar-macia-LKB Frac-100, New York, NY, USA), read at 280.0 nm in a spectrophotometer (Shimadzu UV 160-A, Kyoto, Japan) and submitted to electrophoresis to determine their purity (peaks). The amidase activity of each fraction pool was determined as described below.
Electrophoresis. The purified fractions were submitted
to electrophoresis by the method of Laemmli (10). The following standard markers (Sigma) were added to all electrophoretic runs: 116-kDa ß-galactosidase, 97.4-kDa rabbit muscle ß-phosphorylase, 66-kDa bovine albumin, 45-kDa swine heart fumarase, and 29-kDa carbonic anhy-drase. The gels were stained with silver by the method of Tunon and Johansson (11) and with Coomassie blue by the method of Hames and Rickwood (12).
Amidase activity was determined by the method of Antonini and Ascenzi (13) using DL-BAPNA as substrate. After SE-Sephadex C-50 chromatography and determina-tion of amidase activity, selected fracdetermina-tions were submitted to dialysis for 8 h at 4ºC using membranes of 6000-8000 Da exclusion limit, against 1.0 mM HCl, pH 3.00. The dialyzed samples were lyophilized and stored at -20ºC.
Active site titration. The active site of the enzyme
samples was titrated with small modifications (14). In this method, ß-trypsin catalyzes the hydrolysis of 4-nitrophen-yl-4-guanidinebenzoate. The first catalytic step is several-fold faster than the second step, permitting the spectropho-tometric detection of the acyl-enzyme at 410 nm. A refer-ence cuvette with Veronal buffer and a sample cuvette with the same buffer plus trypsin were used. The values of 40,000 and 16,595 M-1cm-1 were adopted as the molar extinction coefficient (ε) for ß-trypsin (read at 280.0 nm) and 4-nitrophenol at pH 8.30 (read at 410.0 nm), respec-tively. The equation used for calculation was
(Eq. 1)
where f = enzyme dilution factor.
Thermal denaturation of ß-trypsin in acid media. The
microcalorimetric study of ß-trypsin denaturation at pH 2.00 to 4.20 was performed by the methods of Privalov and Potekhin (2) and Freire et al. (15) using the MicroCal [Active site]% = ∆A280/40.000 x 100%
Ultrasensitive VP-DSC apparatus and standard software for data acquisition and analysis. For analysis in acid media the ß-trypsin samples, resuspended in ß-alanine buffers at pH 2.00, 2.25, 2.50, 2.75, 3.00, 3.25 and 3.50 (50.0 mM ß-alanine and 20.0 mM CaCl2), 4.00 and 4.20 (50.0 mM sodium acetate and 20.0 mM CaCl2) and determined spec-trophotometrically at 280.0 nm to be approximately 1.0 mg/ml, were degassed for 30 min and then loaded onto the DSC MicroCal apparatus. Runs were performed with a scan rate of 60ºC/h. The changes in enthalpy (∆H) did not depend on the scan rate used in the range of 30º to 90ºC per hour. The data obtained were subtracted from a baseline of water against water or buffer against buffer (ß-alanine at the corresponding pH values) before normalization of the protein concentration.
Microcalorimetry of ß-trypsin at pH 3.00 in the
pres-ence of a protein denaturant or stabilizer. The
microcalo-rimetric runs of ß-trypsin with a destabilizing or stabilizing agent were carried out by the method described above. Guanidinium hydrochloride was used as a denaturing agent at 0.25, 0.50 and 0.75 M in ß-alanine buffer, pH 3.00 (50.0 mM ß-alanine, 20.0 mM CaCl2) (16), and sorbitol was used as a stabilizing agent at 0.5, 1.0, 1.5 and 2.0 M in ß-alanine buffer, pH 3.00 (50.0 mM ß-alanine, 20.0 mM CaCl2) (16).
Results and Discussion
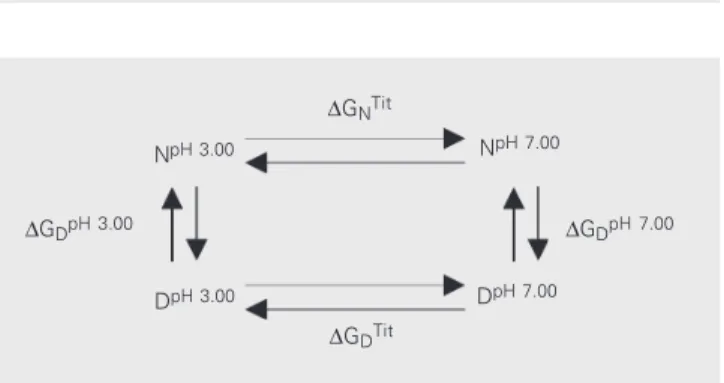
It is not possible to directly assess the stability of ß-trypsin at neutral pH due to the autolysis of this proteolytic enzyme. The alternative is to assess stability within the acid pH range (pH 2.00 to 4.50) and to calculate the stability of the enzyme in the neutral range according to the thermody-namic cycle described below (Figure 1).
The analysis of experimental DSC data (Cp x tempera-ture) allows the evaluation of two types of enthalpy varia-tion (2): i) calorimetric enthalpy (∆Hcal), which represents the area under the denaturation curve, minus the contribu-tion of the variacontribu-tion of heat capacity (∆Cp) between the native and denatured forms of the protein. This is a model-independent parameter and the units are cal/mol of protein (monomer), but can also be expressed as cal/mol dimer, if necessary. ii) van’t Hoff enthalpy (∆HvH), which reflects the shape of the denaturation curve and describes the dependence of the equilibrium constant (KD) as a function of temperature. It is a model-dependent parameter ex-pressed as cal/mol of cooperative units, responsible for the observed conformational transitions.
An important experimental parameter is the ∆Hcal/∆HvH ratio, which represents the ratio
(Eq. 2)
For a monomer, a two-state transition is described by a
∆Hcal/∆HvH value = 1.0, i.e., the monomer is the coopera-tive unit responsible for the observed conformational tran-sition. In the case of a dimer, the ratio is ∆Hcal/∆HvH = 0.5, i.e., we have 0.5 mol of cooperative units per mol of monomer. For a monomer with two domains of similar size, when uncoupled, a ∆Hcal/∆HvH ratio = 2.0 should be ex-pected, i.e., 2 mol of cooperative units per monomer would be detected, assuming that the domains make similar con-tributions to the overall ∆Hcal value (2).
At pH 3.00 the reversibility of the thermal denaturation of ß-trypsin was 90% or higher. For this protein the dena-turation process was evaluated as a two-state transition, as can be seen in Figure 2 which shows a quite symmetrical transition curve. At this pH, the denaturation process was assumed to be a two-state transition because the ∆Hcal/
∆HvH ratio was very close to one.
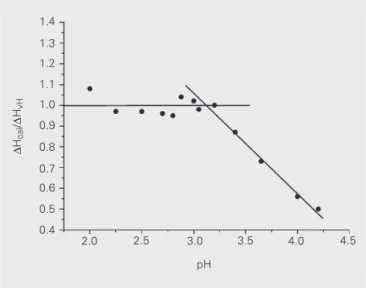
ß-Trypsin at pH values ranging from 2.00 to 3.00 exhib-ited a ∆Hcal/∆HvH ratio always close to one (Figure 3), indicating that the enzyme is a monomer and that the domains are coupled under these conditions. These results agree with those reported by Brumano et al. (5), who showed that the thermal denaturation of ß-trypsin at pH 2.80 was a two-state transition with a ∆Hcal/∆HvH value close to one.
Figure 1. Thermodynamic cycle for ß-trypsin, where: ∆GDpH 3.00 =
meas-ured stability of the protein at pH 3.00; ∆GDpH 7.00 = calculated stability of
the protein at pH 7.00; ∆GDTit = free energy change of titration of the
denatured species from pH 3.00 to 7.00; ∆GNTit = free energy change of
titration of the native species from pH 3.00 to 7.00. ∆GDpH 3.00
∆GNTit
NpH 7.00
∆GDpH 7.00
DpH 7.00
∆GDTit
DpH 3.00
Cal Cal mol of cooperative units
mol of protein (monomer)
mol of cooperative units
mol of protein (monomer) =
to 4.0 pH range, observed that the ∆Hcal/∆HvH ratio was always approximately one.
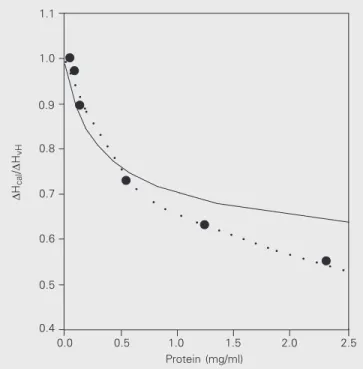
In an attempt to clarify this point, the ∆Hcal/∆HvH ratio was determined at constant pH 3.70 (50.0 mM ß-alanine and 20.0 mM CaCl2). At this pH the ∆Hcal/∆HvH ratio was about 0.75, i.e., between the extreme values 1.0 (100% of proteins are monomers) and 0.5 (100% of proteins are dimers). Figure 4 shows the results obtained at the protein concentration range of 0.05-2.30 mg/ml. While the protein concentration varied, the protein aggregated under these conditions, since the ratio tended to reach lower values with high protein concentrations, while it tended to reach 1.0 when the protein concentration tended to be zero.
Assuming that under these conditions the protein shows an equilibrium of 2 monomers ⇔ dimer, the dimerization constant can be calculated using the following equation
[Dimer] (1 - f)
KD = = (Eq. 3)
[Monomer]2 f2 * [P]
where [P] is the total protein concentration and f is the fraction of the total protein as a monomer. Solving this equation for f leads to a quadratic equation that can be solved by retaining only the positive f value, whereas the other possible solution involves a negative f value that has no physical meaning. For the observed ∆Hcal/∆HvH ratio, we can assume that
(∆Hcal/∆HvH)obs= f * (∆Hcal/∆HvH)monomer+ (1 - f)* (∆Hcal/∆HvH)dimer
(Eq. 4)
Recall that (∆Hcal/∆HvH)monomer = 1.0 and (∆Hcal/∆HvH)dimer = 0.5.
By combining this equation with the f value obtained previously, we obtain the following equation for (∆Hcal/
∆HvH)obs as a function of total protein concentration.
(∆Hcal/∆HvH)obs = 0.5 - (1/4*KD*[P]) + (1 + 4*KD*[P]1/2/(4*KD*[P]))
(Eq. 5)
Simulations showed that the limiting value of this equa-tion was 0.5 when the protein concentraequa-tion tended to reach high values, and 1.0 when the protein concentration tended to be zero.
When this equation was fitted to the (∆Hcal/∆HvH)obs values (Figure 4) it did fit reasonably well protein concen-trations lower than 1.0 mg/ml, but did not fitthe experimen-tal data observed at higher protein concentrations. We
∆
Hcal
/
∆
HvH
1.4
1.3
1.2
1.1
1.0
0.9
0.8
0.7
0.6
0.5
0.4
2.0 2.5 3.0 3.5 4.0 4.5
pH
Cp (kcal/mol/deg)
15
10
5
0
20 30 40 50 60 70 80
Temperature (ºC)
Figure 2. Acid denaturation curve of ß-trypsin. The proteins were 1.0 mg/
ml in 50.0 mM ß-alanine and 20.0 mM CaCl2 buffer, pH 3.00. Data were
obtained by differential scanning calorimetry. The solid line shows data processed after subtraction of the baseline and normalization of protein concentration. The dashed line indicates the fitting of the data to the mathematical model of a two-state transition.
Figure 3. ∆Hcal/∆HvH values for ß-trypsin in the acid pH range. Buffers:
50.0 mM ß-alanine with 20.0 mM CaCl2, except at pH 4.00 and 4.20
where 50.0 mM acetate with 20.0 mM CaCl2 buffers were used.
ß-Trypsin concentration was 1.0 mg/ml.
believe that this departure suggests the presence of higher aggregate states (trimers, tetramers, etc.) that cannot be accounted for by this equation.
For a two-state transition, at the transition temperature (Tm), ∆G(Tm) = 0 cal/mol (KD = 1.0). Thus,
∆H(Tm)
∆G(Tm) = ∆H(Tm) - Tm x∆S(Tm) = 0 ∴ ∆S(Tm) =
Tm
(Eq. 6)
The dependence of ∆H(Tm) on Tm allows the evaluation of ∆Cp, which is the variation of the heat capacity between the native and denatured forms of the protein. Hence:
d∆H
∆Cp = (Eq. 7)
dT
Integrating between the limits (assuming constant ∆Cp in the temperature range studied):
T T
∫d∆H= ∆Cp ∫ dT (Eq. 8)
Tm Tm
∴∆H(T) = ∆H(Tm)+ ∆Cp (T - Tm) (Eq. 9)
Analogously, it can be demonstrated that
∆S(T)= ∆S(Tm)+ ∆Cp 1n (T/ Tm) (Eq. 10)
Once ∆H(Tm), Tm and ∆Cp are known, the protein stability ∆G(T) in the temperature range of interest can be calculated according to the following equation (18):
∆G(T)= ∆H(Tm)(1 - T/Tm) - ∆Cp[(Tm- T) + T * ln (T/Tm)]
(Eq. 11)
At pH 3.00, ß-trypsin denaturation presented a Tm of 54ºC and a ∆H of 101.8 kcal/mol. The variation in heat capacity between the native and denatured forms of the protein (∆Cp) was estimated to be 2.50 ± 0.07 kcal mol-1 K-1 for the ß-trypsin monomer. The values used for this evaluation presented ∆Hcal/∆HvH ratios close to one. In some runs, sorbitol was used as the protein stabilizer and guanidinium hydrochloride or urea as a destabilizer (Figure 5). These compounds are known to affect the stability of proteins (16) by changing the relative stabilities of the native and unfolded forms of the protein. The observation
Figure 4. ∆Hcal/∆HvH values for ß-trypsin at pH 3.70 as a function of
protein concentration. The buffer was 50.0 mM ß-alanine and 20.0 mM
CaCl2, pH 3.70. Dotted line = fourth degree polynomial fitted to the data
to guide the eyes. Solid line = equation 5 fitted to the data to show the predicted values due to a putative dimerization process. Protein concen-tration was 0.05 to 2.3 mg/ml.
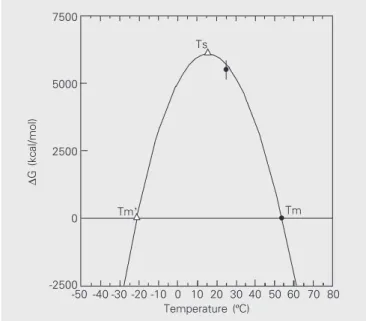
of a straight line fitting well all the data suggests that we are studying the same conformational transition of the protein in all experimental situations using pH, sorbitol, urea and guanidinium hydrochloride as perturbing agents. The sta-bility curve calculated for ß-trypsin at pH 3.00 is shown in Figure 6.
The ∆G value of ß-trypsin denaturation calculated from the DSC at pH 3.00 and extrapolated to 298 K was 5.7 kcal/ mol, as can be observed in Figure 6. The result for ß-trypsin was similar to that obtained by Günther (19) by solvent (urea) denaturation at the same pH and temperature (6.10 ± 1.03 kcal/mol).
It is known that protein folding is a thermodynamically directed process depending on the primary protein struc-ture and can producestable intermediates with structures sufficiently similar to the native form of the protein (molten globule) (20,21). In the case of small proteins the denatur-ation process is quite simple, with a transition between two states, i.e., native and denatured. For large proteins and with some domains the denaturation process can present some intermediate states between the native and the dena-tured forms (21). Based on the ∆Hcal/∆HvH values observed
○ ○
○ ○
○ ○
∆
Hcal
/
∆
HvH
1.1
1.0
0.9
0.8
0.7
0.6
0.5
0.4
○ ○
○ ○
○ ○ ○
○ ○
○
○
○
○
○
○
○
○
○ ○
○
○
○
○
○ ○
0.0 0.5 1.0 1.5 2.0 2.5
in the 2.00 to 3.00 pH range, the process of thermal denaturation of ß-trypsin occurs as a transition between two states. Although ß-trypsin has two similar domains, the enzyme denatures as a cooperative unit in the denaturation process. This behavior was already shown in studies using DSC for observation of the denaturation of ß-trypsin at pH 2.80. This was attributed to the close similarity and strong interaction between the two domains (5). As the pH in-creased from 3.20 to 4.20, ß-trypsin tended to aggregate, as suggested by a ∆Hcal/∆HvH ratio tending to 0.5. This dimer-ization was the consequence of deprotonation of some carboxylgroups causing an interaction on the surface of molecules. Dimerization can be reversed by dilution of the protein solution (17).
Martins et al. (6) determined the thermodynamic values of the denaturation of ß-trypsin at pH 3.00, with better adjustment for a three-state transition, using solvent dena-turation with urea. Ruan et al. (22) showed the presence of the intermediate molten globule in the denaturation of trypsin under pressure. Thus, the results of the cited reports are consistent with the existence of one or more intermedi-ates in the denaturation of ß-trypsin. However, Ruan et al. used pressure denaturation and did not purify the sample of bovine trypsin, and other trypsin isoforms were present, while Martins et al. (6) used solvent denaturation with urea. Bulaj and Otlewski (23) worked with commercial trypsin, trypsinogen and ß-trypsin and concluded that the process of denaturation of these proteins fitted a two-state transition, although they described a kinetically complex denaturation process.
Finally, it is worthwhile to calculate the stability of ß-trypsin at neutral pH. From the thermodynamic cycle (Fig-ure 1) we obtain
…… ∆GNTit+∆GDpH 7.00=∆GDTit+∆GDpH 3.00 (Eq. 12)
∴ ∆GDpH 7.00=(∆GDTit-∆GNTit) +∆GDpH 3.00= (∆∆GTit) +∆GDpH 3.00
(Eq. 13)
The titration of the native form of this protein from pH 3.00 to 7.00 is affected by any change in the state of the protein, including the aggregation that occurs around pH 4.5, so that the thermodynamical cycle shown in Figure 1 is still valid, and it is known that this enzyme is monomeric at neutral pH. In the present study, the ∆GDpH 3.00 = 5.71 ± 0.06 kcal/ mol was assessed at pH 3.00 and at 25ºC. The ∆∆GTit term was found to be 9.51 ± 0.06 kcal/mol (24) when the native
Figure 5. ∆Hcal versus Tm (ºC) at different pH values, concentrations of
sorbitol at pH 3.00, of guanidinium hydrochloride at pH 3.00, of urea at pH 3.00, and different buffers. Protein concentration was 1.0 mg/ml except when the influence of protein concentration was tested. NaCl (0.2 M) was used in one experiment at pH 3.00. In all experiments the buffer was 0.1 M ß-alanine except when glycine or acetate was used.
The slope was ∆Cp = 2.50 ± 0.07 kcal mol-1 K-1. Run conditions: 1) 1.00
M guanidinium hydrochloride, pH 3.00; 2) 0.70 M guanidinium hydrochlo-ride, pH 3.00; 3) 0.50 M guanidinium hydrochlohydrochlo-ride, pH 3.00; 4) 0.50 M urea, pH 3.00; 5) pH 2.70; 6) pH 2.80; 7) pH 2.85; 8) pH 2.90; 9) 0.20 M NaCl, pH 3.00; 10) ß-alanine, pH 3.00; 11) pH 3.20; 12) glycine, pH 3.00; 13) 0.1 mg/ml protein, pH 3.70; 14) acetate buffer, pH 3.00; 15) 1.0 M
sorbitol, pH 3.20; 16) 2.0 M sorbitol, pH 3.14. In all experiments, ∆Hcal
was equal to∆HvH.
Figure 6. Stability curve of ß-trypsin: ∆GD as a function of temperature
(ºC), at pH 3.00, where Tm is the heat denaturation temperature, Tm’ is
the theoretical cold denaturation temperature and Ts is the temperature of maximum stability of the protein under these experimental
condi-tions. The value at 25ºC, 6.10 ± 1.03 kcal/mol, was obtained by solvent
denaturation with urea as denaturant (21); the data were analyzed as a two-state transition.
∆
H
(kcal/mol)
150
140
110
100
90
80
70
60
40 45 50 55 60 65
130
120
70
Tm (ºC)
1
2 3
45
710
6 8 9
1112 13
14 15 16
7500
5000
2500
0
-2500
-50 -40 -30 -20 -10 0 10 20 30 40 50 60 70 80
Temperature (ºC)
Tm’ Tm
Ts
∆
G
and unfolded forms of the protein were independently titrated from pH 3.00 to 7.00 at 25ºC. Based on these values, the calculated stability of ß-trypsin at pH 7.00 was 15.22 ± 0.07 kcal/mol, a value that is typical for small globular proteins at neutral pH. It is important to realize that we cannot obtain this value directly at pH 7.00 due to autolysis of the protein.
We have come a long way from the work of Anson and Mirsky (25), the first description of the effect of tempera-ture on the equilibrium between the native and denatempera-tured forms of a preparation of trypsin. Their data were obtained
only at pH 2.0 using a quite different technique. Our work is an extensive thermodynamic study of ß-trypsin denatur-ation at acid pH that significantly extends our knowledge of the thermodynamical behavior of this important protein. It would be instructive to compare the stability of ß-trypsin with its zymogen under similar experimental conditions (at pH 7.00 and 25ºC) and describe the activation process of a typical serine protease from a thermodynamic point of view. This is the subject of an ongoing research project in our laboratory.
References
1. Jackson WM & Brandts JF (1970). Thermodynamics of protein denaturation. A calorimetric study of the reversible denaturation of chymotrypsinogen and conclusions regarding the accuracy of the two-state approximation. Biochemistry, 9: 2294-2301.
2. Privalov PL & Potekhin SA (1986). Scanning microcalorimetry in studying temperature-induced changes in proteins. Methods in En-zymology, 131: 4-51.
3. Brandts JF, Hu QC, Lin LN & Mas MT (1989). A simple model for proteins with interacting domains. Applications to scanning calorim-etry data. Biochemistry, 28: 8588-8596.
4. Lesk AM & Fordham WD (1996). Conservation and variability in the structures of serine proteinases of the chymotrypsin family. Journal of Molecular Biology, 258: 501-537.
5. Brumano MHN, Rogana E & Swaisgood HE (2000). Thermodynam-ics of unfolding of ß-trypsin at pH 2.8. Archives of Biochemistry and Biophysics, 382: 57-62.
6. Martins NF, Ferreira E, Torres KCL & Santoro MM (2003). The denaturation of α, ß and ψ bovine trypsin at pH 3.0: Evidence of intermediates. Protein and Peptide Letters, 10: 73-81.
7. Tishchenko VM & Gorodkov BG (1979). Calorimetric study of heat denaturation of beta-trypsin. Biofizika, 24: 334-335.
8. Schroeder DD & Shaw E (1968). Chromatography of trypsin and its derivatives. Characterization of a new active form of bovine trypsin. Journal of Biological Chemistry, 243: 2943-2949.
9. Higaki JN & Light A (1986). Independent refolding of domains in the pancreatic serine proteinases. Journal of Biological Chemistry, 261: 10606-10609.
10. Laemmli UK (1970). Cleavage of structural proteins during the as-sembly of the head of bacteriophage T4. Nature, 227: 680-686. 11. Tunon P & Johansson KE (1984). Yet another improved silver
stain-ing method for detection of proteins in polyacrylamide gels. Journal of Biochemical and Biophysical Methods, 9: 171-179.
12. Hames BD & Rickwood D (1990). Analysis of Gels Following Elec-trophoresis - A Practical Approach. Gel EleElec-trophoresis of Proteins. 2nd edn. Oxford University Press, Oxford, UK, 53-54.
13. Antonini E & Ascenzi P (1981). The mechanism of trypsin catalysis at low pH. Proposal for a structural model. Journal of Biological Chemistry, 256: 12449-12455.
14. Dias CLF (1986). Estudo cinético da autólise de tripsina beta bovina: efeito de íons cálcio e de temperatura. Doctoral thesis,
Departa-mento de Bioquímica e Imunologia, Instituto de Ciências Biológi-cas, UFMG, Belo Horizonte, MG, Brazil.
15. Freire E, Murphy KP, Sanchez-Ruiz JM, Galisteo ML & Privalov PL (1992). The molecular basis of cooperativity in protein folding. Ther-modynamic dissection of interdomain interactions in phosphoglyc-erate kinase. Biochemistry, 31: 250-256.
16. Timasheff SN (1992). A physicochemical basis for the selection of osmolytes by nature. In: Somero GN, Osmond CB & Bolis CL
(Editors), Water in Life. Springer-Verlag, Berlin, Heidelberg, New
York, 70-87.
17. Hans-Jürgen H (1986). Thermodynamic parameter for protein-pro-tein and proprotein-pro-tein ligand interaction in differential scanning microcalo-rimetry. Methods in Enzymology, 130: 59-78.
18. Pace CN, Shirley BA & Thomson JA (1989). Measuring the
confor-mational stability of a protein. In: Creighton TE (Editor), Protein
Structure, A Practical Approach. 1st edn. IRL Press, New York, 311-322.
19. Günther AR (1998). Variações de energia livre covalente e não covalente na hidrólise catalisada do 4-nitrofenil-4-guanidinobenzoato pela ß-tripsina. Doctoral thesis, Departamento de Bioquímica e Imunologia, Instituto de Ciências Biológicas, UFMG, Belo Hori-zonte, MG, Brazil.
20. Anfinsen CB (1973). Principles that govern the folding of protein. Advances in Protein Chemistry, 29: 205-300.
21. Privalov PL (1992). Physical Basis of the Stability of the Folded
Conformations of Proteins. 1stedn. Copyright by W.H. Freeman
and Company, San Francisco, CA, USA, 83-126.
22. Ruan K, Lange R, Bec N & Balny C (1997). A stable partly denatured state of trypsin induced by high hydrostatic pressure. Biochemical and Biophysical Research Communications, 239: 150-154. 23. Bulaj G & Otlewski J (1995). Ligand-induced changes in the
confor-mational stability of bovine trypsinogen and their implications for protein function. Journal of Molecular Biology, 247: 701-716. 24. Günther AR, Santoro MM & Rogana E (1997). pH titration of native
and unfolded ß-trypsin: evaluation of ∆∆Gºtitration and the carboxyl
pK values. Brazilian Journal of Medical and Biological Research, 30: 1281-1286.