Flavianate , an am ino acid pre cipitant,
is a co m pe titive inhibito r o f trypsin
at pH 3 .0
Departamento de Bioquímica e Imunologia, Instituto de Ciências Biológicas, Universidade Federal de Minas Gerais, Belo Horizonte, MG, Brasil
J.M. Schneedorf, M.M. Santoro and M. Mares-Guia
Abstract
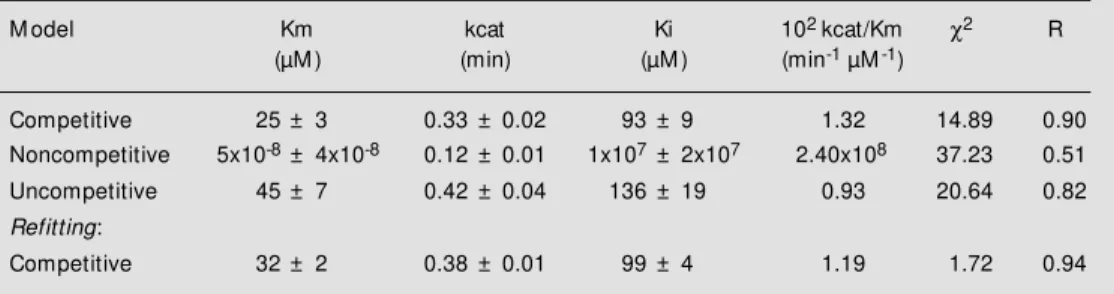
Textile dyes bind to proteins leading to selective co-precipitation of a complex involving one protein molecule and more than one dye molecule of opposite charge in acid solutions, in a process of revers-ible denaturation that can be utilized for protein fractionation. In order to understand what occurs before the co-precipitation, a kinetic study using bovine ß-trypsin and sodium flavianate was carried out based on reaction progress curve techniques. The experiments were carried out using α-CBZ-L-Lys-p-nitrophenyl ester as substrate which was added to 50 mM sodium citrate buffer, pH 3.0, containing varying concentra-tions of ß-trypsin and dye. The reaction was recorded spectrophoto-metrically at 340 nm for 30 min, and the families of curves obtained were analyzed simultaneously by fitting integrated Michaelis-Menten equations. The dye used behaved as a competitive inhibitor of trypsin at pH 3.0, with Ki = 99 µM; kinetic parameters for the substrate hydrolysis were: Km = 32 µM, and kcat = 0.38/min. The competitive character of the inhibition suggests a specific binding of the first dye molecule to His-57, the only positively charged residue at the active site of the enzyme.
Co rre spo nde nce
M. Mares-Guia BioMM, Inc. 14775 SW 132 Place Miami, FL 33186-7642 USA
E-mail: maresguia@ aol.com Research supported by CNPq and BioBRAS S/A.
Received September 1, 1997 Accepted May 21, 1998
Ke y wo rds
•Flavianic acid •Tripsin inhibition •Textile dyes
Intro ductio n
Interaction studies on systems of protein co-precipitation with dyes have regained at-tention in the last decade for the understand-ing of crystallization processes and biosepa-rations (1). The analysis and interpretation of kinetic data can be useful to investigate physical phenomena in such associating sys-tems, such as conformational changes or macromolecular polymerization that precede the co-precipitation events (2). Kinetic pa-rameters of enzyme-catalyzed reactions can
parameters from a single curve with a large number of experimental points, only limited by the system of data acquisition used. The technique has also attracted attention be-cause it appears to offer the opportunity to detect time-dependent features produced during association of ligands with proteins, such as slow transitions or conformational changes arising in response to changes in ligand concentration (4).
In this paper, we report kinetic properties of a dye-protein system in a concentration range below the values observed for co-precipitation, using as a model the inhibition of the well-known serine protease ß-trypsin by flavianate, a yellow textile dye used in the past to fractionate basic amino acids from crude protein extracts (5).
Mate rial and Me tho ds
Ge ne ral
All chemicals used in this study were analytical grade and were purchased from Sigma Chemical Co. (St. Louis, MO). The concentration of purified flavianic acid, twice-crystallized as the monosodium salt, was determined spectrophotometrically. Ex-tinction coefficients were determined for the solvent system described below. The experi-ments were carried out using α -CBZ-L-Lys-p-nitrophenyl ester without further purifica-tion as a stock solupurifica-tion in dimethylsulfoxide. ß-Trypsin was purified from commercial
tryp-sin according to Schroeder and Shaw (6) and Dias and Rogana (7). Concentrations of ß-trypsin were determined according to Chase and Shaw (8). Enzyme samples dissolved in HCl, pH 3.0, were prepared daily, filtered through a nitrocellulose membrane and cen-trifuged in a Sorvall instrument with an SS-34 rotor at 45,000 g for 45 min to remove a small insoluble residue. The enzyme was then added at a final concentration of 0.2 mg/ml in dilutions of sodium flavianate solu-bilized in 50 mM sodium citrate buffer, pH 3.0, and placed in the reference and sample cuvettes after a pre-incubation period of 15 min. The samples were carefully mixed and the activity was recorded with a Shimadzu UV-160 spectrophotometer during a steady-state of 30 min at 340 nm at a constant temperature of 37.0oC. Spontaneous
sub-strate hydrolysis was recorded separately. From every progress curve nine equally spaced points were then measured in tripli-cate. The full assay included a range of initial substrate concentrations of 47, 94, 140 and 185 µM, and a range of initial dye concentrations of 47, 94, 141, 264 and 367 µM.
Se lwyn’s te st
A test for undesired inactivation of ß-trypsin during the period of kinetic experi-ment was done according to Selwyn (9). The kinetic assays were conducted as previously described, varying concentrations of ß-tryp-sin up to 0.6 mg/ml, in the absence of dye. Results were analyzed by plotting the en-zyme concentration multiplied by time against the amount of released product.
No n-line ar re gre ssio n
Michaelis-Menten parameters were esti-mated by fitting values of S0, St, I, P and t to
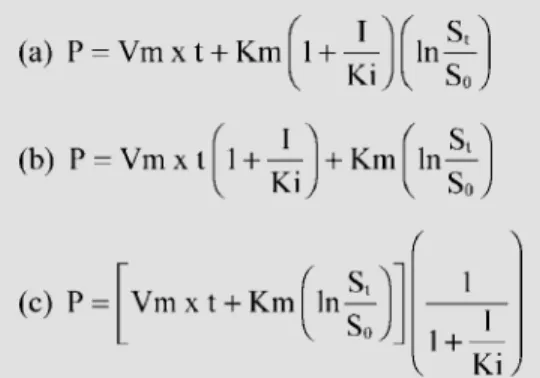
the integrated equations for pure competi-tive, non-competitive and uncompetitive in-hibition models (Figure 1). In these
equa-Figure 1 - Integrated M ichaelis-M enten equations for general in-hibition systems. a, Competitive;
tions, S0, St, I and P were concentrations of
initial substrate, substrate at time t, inhibitor and product, respectively. The data obtained were analyzed with the help of non-linear packages (Sigma Plot release 5.01, Jandel Corporation, San Rafael, CA, and Statistica release 4.5, StatSoft, Inc., Tulsa, OK) able to apply non-linear regression to equations in-troduced by the user. The values for the initial Km and kcat parameters were calcu-lated according to Lee and Wilson (10). Non-linear fitting was initially done simulta-neously with twenty curves to discriminate between competing patterns of inhibition. Adjustments were done with the reciprocal of square product concentration as the statis-tical weight for loss function. A refined pro-cedure was further applied according to Duggleby and Nash (11) to improve the fit-ting, placing the previous unadjusted residual range in the loss function of the algorithm. All accepted adjustments converged, with tolerance satisfied, and no ill-matrix condi-tions.
Tim e -de pe nde nce analysis
The flavianate-trypsin system was also investigated for time-dependence indicators like slowness of association-dissociation re-actions and hysteretic effect due to molecu-lar transconformations. A decay parameter of substrate depletion was thus assigned to each progression curve. The relations below describe the substrate consumption as a func-tion of time (t):
dS
vi = - = kS Equation 1
dt
Integration of Equation 1 between limits of S0 and St leads to Equation 2:
St = S0e
-kt Equation 2
First-order non-linear adjustments of Equation 2 were applied to substrate con-sumption data measured in kinetic assays carried out at different enzyme
concentra-Figure 2 - ß-Trypsin-catalyzed hydrolysis of α-CBZ-L-Lys-p-nitrophenyl ester obtained w ith increasing flavianate concentrations of 47 (1), 94 (2), 141 (3), 264 (4) and 367 (6) µM , at an S0
of 185 mM . Ordinate, Remaining substrate concentration at each time (t). Inset, Progress
curves of released product plotted against time multiplied by amount of enzyme (Selw yn’s test). Symbols represent increasing concentrations of trypsin.
St
(µ
M
)
200
200
¡
·
= 8 mM= 16 mM = 23 mM0 100 200 100
0
P
(
µM
)
150
100
50
0
6
5
4 3
2 1
ET x t (mM x min)
10 20 30
Time (min)
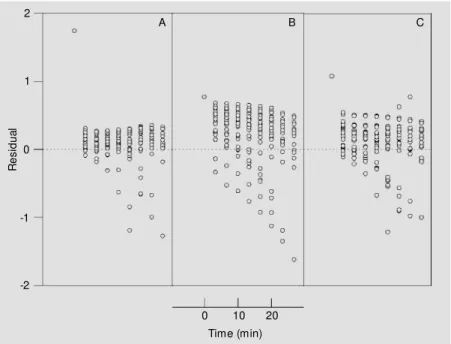
Figure 3 - Residual plots from fitting to competitive (A), non-competitive (B) and uncompeti-tive (C) kinetic models of integrated M ichaelis-M enten equations.
R
es
id
ua
l
2
0
-1
-2
0 10 20
Time (min)
A B C
tions and different preincubation periods of flavianate with trypsin, at fixed S0. Under
these experimental conditions, the S0/Km
ratio was in the range of 2-6 x 10⁻³. The
kinetic parameter k obtained was then plot-ted against these variables and analyzed (4).
Re sults and D iscussio n
The interaction of flavianate with trypsin
is maximized at pH 3.0. α -CBZ-L-Lys-p-nitrophenyl ester was chosen as an adequate substrate for ß-trypsin-catalyzed hydrolysis at this low pH. A sample of primary hydroly-sis data shown in Figure 2 reveals that ß-trypsin activity can be easily monitored. In fact, trypsin is inactive only at pH ranges lower than 2 (12). The inset in Figure 2 shows the results of the application of Selwyn’s (9) test, which requires that the experimental points should fall on a single curve, indicating that no denaturation of the enzyme occurred.
Alte rnative mo de ls
The kinetic parameters and standard er-rors obtained from non-linear fitting of the three inhibition models tested are listed in Table 1. The choice between alternative models was based on the chi-square (χ2) test
and non-linear correlation coefficents (R), since analysis of residual plots alone could not lead to a best model (Figure 3). An F-test based on the chi-square ratio (13) was then applied as the criterion of statistical accept-ability for kinetic models. The chi-square ratios for non-competitive/competitive and uncompetitive/competitive models were 2.50 and 1.39, respectively. The results led to the selection of the pure competitive model for inhibition of trypsin by flavianate since the value of the chi-square ratio for this model was higher than the 1.28 value predicted from F-distribution (N = 180, P<0.05).
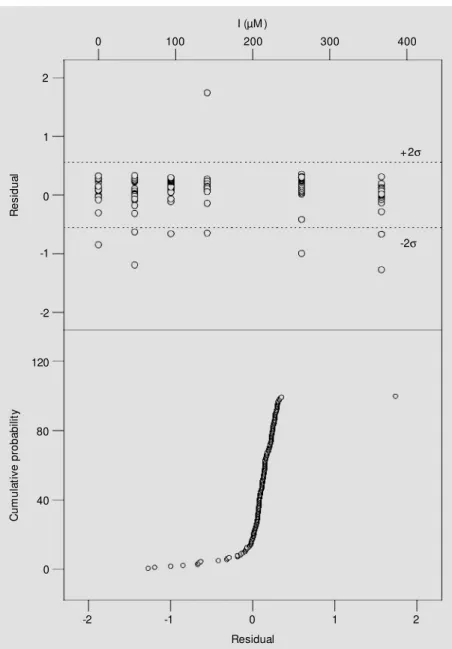
Having defined the model, further refin-ing of kinetic parameters was done accord-ing to Duggleby and Nash (11), with data depleted of outliers. These very extreme val-ues were identified by examination of resi-dues and probability plots (14), the latter a test for normality of residuals (Figure 4, lower panel). This plot represents a set of expected points from a normal distribution with a mean of zero versus cumulative prob-ability. Plotting the residuals against the mal scores gives the usual cumulative
nor-Figure 4 - Residual analysis for the competitive model adjustment. Upper panel, Residue plot obtained from adjustments of the integrated competitive model to the data (180 points). Low er panel, Cumulative normal probability plot of residues.
R
es
id
ua
l
2
1
0
-1
-2
120
80
40
0
0 100 200 300 400
I (µM )
+2σ
-2σ
-2 -1 0 1 2
Residual
C
um
ul
at
iv
e
pr
ob
ab
ili
mal probability plot. If the errors are nor-mally distributed, these points should lie on a straight line; otherwise, in the case of non-normality or in the presence of oversized residuals, the data will not follow a general linear trend. Nine extreme residuals in the residue plot (Figure 4, upper panel) were uncovered, and eleven residuals (Figure 4, lower panel), clearly not on a straight line, were detected and deleted. Detection was carried out iteratively as follows: first, we constructed half-normality plots with r and r+1 sets of deleted residues that resulted from
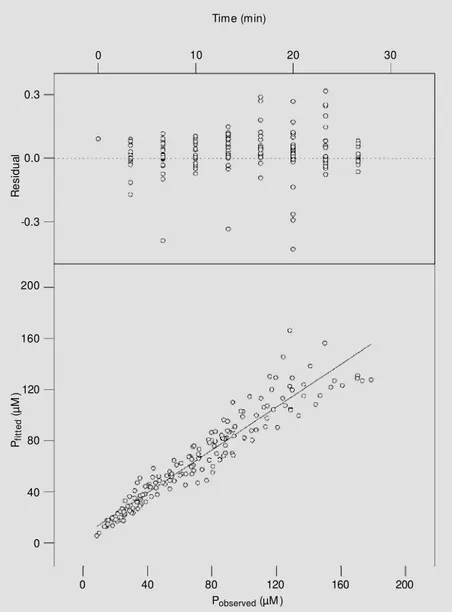
non-linear adjustments for competitive inhi-bition. We then applied a linear regression to both data sets and computed their weighted chi-square values. Finally, we tested for the best population of deleted residues by com-paring these values using an F-test. Re-fit-ting was then performed, and the new pa-rameters were determined (Table 1). Ap-plying Duggleby and Nash procedures (11) to this set of data leads to the significant decrease in chi-square value shown in Table 1. Re-fitting by only excluding outliers leads to a chi-square of 3.75. The agreement be-tween observed and calculated data from this new fitting is shown in the lower panel of Figure 5. Michaelian parameters finally evaluated at pH 3.0 (Table 1, last line) were at variance with data reported in the litera-ture at a similar pH range (12,15).
Thus, Bender et al. (15) reported kcat = 0.84/min, Km = 27.8 µM, with kcat/Km = 3.0 x 10⁻² min-1 µM-1, at pH 2.66, and Ascenzi
et al. (12) reported kcat = 3.0/min, Km = 500 µM, with kcat/Km = 6.0 x 10⁻² min-1 µM-1, at
pH 2.55. It is interesting to compare these parameters to those calculated at pH 7.8 (12): kcat = 140/s, Km = 89 µM, and kcat/ Km = 1.6 s-1 µm-1 On the other hand, this is
the only study in which purified ß-trypsin was used. Early authors used crystalline tryp-sin known to contain inactive material (8). The pH dependence of kinetic parameters shows that at acid pH values (2.6-4.8) the deacylation step is rate-limiting in catalysis,
with the binding constant Ks defined by the ionization state of the Asp-177 carboxyl group (16). The Duggleby and Nash (11) treatment and outlier depletion led to better results: a linear regression applied to the data in Figure 5 (lower panel) gave a slope of 0.84, suggesting that the pure competitive model chosen to explain the inhibition of ß-trypsin by flavianate is the best approxima-tion of the real situaapproxima-tion. This slope,
how-R
es
id
ua
l
120 0.3
0.0
-0.3
200
160
80
40
0
0 40 80 120 160 200
Pobserved (µM )
Pfit
te
d
(µ
M
)
0 10 20 30
Time (min)
Figure 5 - Upper panel, Residual plot relative to the refitting of the integrated competitive
ence of high concentrations of p-nitrophenol, with no inhibition.
Another explanation for the deviations from the experimental data would be the correctness of the models, since we did not test other patterns of integrated Michaelis-Menten equations because these integrated rate equations are generally available only for simple systems. For even moderately complex systems they become difficult or impossible to derive analytically (17,18). The competitive model found indicated that a dye molecule binds to ß-trypsin at its active center, competing with α -CBZ-L-Lys-p-ni-trophenyl ester. With the assumptions that flavianate binds to the protein through cou-lombic attraction between independent charged centers on the polymer and the an-ion (19), it follows that flavianate may be bound to His-57 (20). This catalytic residue is the only positively charged one located at the active center of ß-trypsin at pH 3.0, with a pKa of 6.8 (21). The His-57 residue can probably bind to either of the negative ionic charges on the dye, the sulfonate and the hydroxide, the sulfonic group and the hy-droxyl one, the latter having a pK value of 1.7.
Tim e -de pe nde nce analysis
Figure 6 shows the results obtained by modifying the enzyme concentrations
(up-Table 1 - Statistical and kinetic parameters for non-linear adjustments of integrated equations of inhibition models: the ß-trypsin-catalyzed reaction of α-CBZ-L-Lys-p-nitrophenyl ester inhibited by flavianate.
χ2: Chi-squares for residues after fitting.R: Non-linear correlation coefficient for fitting.
M odel Km kcat Ki 102 kcat/Km χ2 R
(µM ) (min) (µM ) (min-1 µM-1)
Competitive 25 ± 3 0.33 ± 0.02 93 ± 9 1.32 14.89 0.90 Noncompetitive 5x10⁻⁸± 4x10⁻⁸ 0.12 ± 0.01 1x10⁷± 2x10⁷ 2.40x10⁸ 37.23 0.51
Uncompetitive 45 ± 7 0.42 ± 0.04 136 ± 19 0.93 20.64 0.82
Refitting:
Competitive 32 ± 2 0.38 ± 0.01 99 ± 4 1.19 1.72 0.94
k
(m
in
)
0.24
0.06
0.078
0.075
0.072 0.12 0.18
0.069
0 5 10 15 20 25
ET (µM )
0 40 80 120 160 200
Preincubation time (min) Figure 6 - Time dependence of the
activity decay parameter k in the flavianate-trypsin system. Upper panel, Linear relationship of the
ac-tivity decay parameter k w ith in-creasing enzyme concentrations at 100 mM flavianate w ithout preincu-bat ion. The line represent s a w eighted linear regression applied to the data. Low er panel, Profile of
the k parameter at increasing prein-cubation periods w ith 150 mM flavianate and trypsin at 0.6 mg/ml. The line is a single exponential de-cay fitted to the data.
pres-per panel) or preincubation times (lower panel) of the flavianate-trypsin system be-fore the kinetic assays. The upper panel in Figure 6 clearly presents the expected linear relationship between trypsin concentration and the k parameter, indicating that no force is operative in the reaction other than the simple mass action law. These results rule out possible protein association-dissociation reactions occurring during complex forma-tion, or any hysteretic effect due to slow conformational changes caused by increas-ing protein concentration (22).
The lower panel of Figure 6 appears to represent a curvilinear profile rather than a
linear one. In fact, non-linear adjustments for polynomial, hyperbolic, logistic and ex-ponential models applied to the data resulted in statistical superiority of a single exponen-tial decay for the fitting (P<0.05), suggesting a continuous transition for the macromol-ecule or aggregate. The magnitude of changes in k reflects the responsiveness of the system to an apparent reduction of 7% of active centers or of the catalytic efficiency in ß-trypsin that occurred during the period of preincubation. This reduction could be due to a very small aggregation of flavianate-trypsin complexes occurring during preincu-bation.
Re fe re nce s
1. Lovrien RE, Conroy M J & Richardson TI (1995). M olecular basis for protein sepa-ration. In: Gregory RB (Editor), Protein-Solvent Interactions. M arcel Dekker, New York.
2. Conroy M J & Lovrien RE (1992). M atrix coprecipitating and cocrystallizing ligands (M CC ligands) for bioseparations. Journal of Crystal Grow th, 122: 213-222. 3. Dagys R, Pauliukonis A, Kazlauskas D,
M ankevicius M & Simutis R (1986). De-termination of initial velocities of enzymic reactions from progress curves. Bio-chemical Journal, 237: 821-825. 4. Kenneth EN & Ainslie GR (1980).
Hyster-etic enzymes. M ethods in Enzymology, 64: 192-226.
5. Bunney HE & Rose WC (1928). Grow th upon diets practically devoid of arginine, w ith some observations upon the relation of glutamic and aspartic acids to nutrition.
Journal of Biological Chemistry, 76:
521-535.
6. Schroeder D & Shaw E (1968). Chroma-tography of trypsin and its derivatives. Characterization of a new active form of bovine trypsin. Journal of Biological Chemistry, 243: 2943-2949.
7. Dias CLF & Rogana E (1986). Autolysis of ß-trypsin at pH 3.0. Brazilian Journal of M edical and Biological Research, 19: 11-18.
8. Chase T & Shaw E (1967). p
-Nitrophenyl-p’-guanidinobenzoate-HCl: A new active site titrant for trypsin. Biochemical and
Biophysical Research Communications, 29: 508-514.
9. Selw yn M J (1965). A simple test for inac-tivation of an enzyme during assay. Bio-chimica et Biophysica Acta, 105: 193-195. 10. Lee H & Wilson IB (1971). Enzymic pa-rameters: measurement of V and Km. Bi-ochimica et Biophysica Acta, 242: 519-522.
11. Duggleby RG & Nash JC (1989). A single-parameter family of adjustments for fit-ting enzyme kinetic models to progress-curve data. Biochemical Journal, 257: 57-64.
12. Ascenzi P, M enegatti E, Bortolotti F, Guarneri M & Antonini E (1981). Steady-state and pre-steady-Steady-state kinetics of the trypsin-catalysed hydrolysis of α -CBZ-L-lysine-p-nitrophenyl ester. Biochimica et Biophysica Acta, 658: 158-164.
13. Sprague ED, Larrabee CE & Halsall HB (1980). Statistical evaluation of alternative models: application to ligand-protein bind-ing. Analytical Biochemistry, 101:
175-181.
14. Fry JC (1993). One-w ay analysis of vari-ance. In: Fry JC (Editor), Biological Data Analysis. A Pratical Approach. IRL Press,
Oxford.
15. Bender M L, Kézdy J & Feder J (1965). The kinetics of the trypsin-catalyzed hy-drolysis of p-nitrophenyl α -N-benzyloxy-carbonyl-L-lysinate hydrochloride. Journal of the American Chemical Society, 87: 4953-4954.
16. Antonini E & Ascenzi P (1981). The mech-anism of trypsin catalysis at low pH. Pro-posal for a structural model. Journal of Biological Chemistry, 256: 12449-12455. 17. Waley SG (1988). Integrated 2:2 and 3:3
rate equations of enzyme kinetics. Bio-chimica et Biophysica Acta, 955: 272-273. 18. Gutheil WG, Kettner CA & Bachovchin WW (1994). Kinlsq: a program for fitting kinetics data w ith numerically integrated rate equations and its application to the analysis of slow , tight-binding inhibition data. Analytical Biochemistry, 223: 13-20.
19. Colvin JR (1955). A note on the stoichi-ometry of adsorption of anions by lyso-zyme. Canadian Journal of Biochemistry and Physiology, 33: 651-653.
20. M ares-Guia M , Shaw E & Cohen W (1967). Studies on the active center of trypsin. Further characterization of the hy-drophobic binding site. Journal of Biologi-cal Chemistry, 242: 5777-5781.
21. Bartunik HD, Summers LJ & Bartsch HH (1989). Crystal structure of bovine ß-tryp-sin at 1.5 Å resolution in a crystal form w ith low molecular packing density. Ac-tive site geometry, ion pairs and solvent structure. Journal of M olecular Biology, 210: 813-828.