Nutritional gains of
underprivileged children
attending a day care center in
S.Paulo City, Brazil: a nine month
follow-up study
Recuperação nutricional de crianças
empobrecidas matriculadas em
creche na cidade de São Paulo,
Brasil: um estudo de seguimento de
nove meses
Grants from FAPESP (Fundação de Amparo a Pesquisa do Estado de São Paulo), Employee Association of AGF Brasil Seguros and Oak Ridge Institute for Science and Education
Abstract
The efficacy of a well-operated day care center in providing better nutrition to poor children in Brazil was assessed. We col-lected data for 9 months from 180 under-five children attending a day care center located in a slum. Every working day each child received at least 100% of the age-group recommended dietary allowances plus iron fortified milk and, every six months, treatment for helminth infections. Statistical analyses were restricted to the 168 children (93%) who had measurements from at least five months. As outcome vari-ables, weight-for-height, height-for-age, and weight-for-age Z scores were dichoto-mized so that a Z score < -1 indicated a child was at risk of malnutrition. We examined the proportion of children at nutritional risk in each month and used multivariate sta-tistical techniques to adjust for confound-ing and to account for intra-subject corre-lation. The percentage of children at nutri-tional risk decreased over time, from 10.1% to 3.4% for weight for height, 29.8% to 15.2 % for weight for age, and from 50.0% to 44.8% for height for age. Most of the reduc-tion took place between the third and fourth months of enrollment. The correlated data models for the three dichotomized out-comes showed a two to three-fold reduction in the occurrence of wasting and under-weight. We concluded that attendance to well-operated daycare protects against nu-tritional risk, and approximately four months are required for a benefit to be seen.
Keywords Keywords Keywords Keywords
Keywords: Nutritional status. Health services research. Child day care centers. Epidemiology.
Jose Augusto Taddei
Núcleo de Nutrição, Alimentação e Desenvolvimento Infantil
S. Paulo State Health Secretary and Emory University, International Health Department
Correspondence: R. Marselhesa, 630
04020-060 São Paulo, SP - Brasil e-mail: taddei.dped@epm.br
Michael J.Cannon
L
LL
L
Lee
ee
ee
ee W
ee
W
War
W
W
ar
ar
ar
arner
ner
ner
ner
ner
Emory University, Epidemiology Department and Centers for Disease Control and Prevention.
Patricia Souza
Silvya Vitalle
Domingos Palma
F
F
F
F
Fer
er
er
er
ernando Nóbr
nando Nóbr
nando Nóbr
nando Nóbr
nando Nóbrega
ega
ega
ega
ega
Resumo
Avaliou-se a eficácia da freqüência a cre-che padrão em promover recuperação nutricional de crianças pertencentes a fa-mílias de baixa renda. Foram coletados da-dos, por um período de nove meses, de 180 crianças que frequentavam uma creche lo-calizada em uma favela. Em todos os dias úteis cada criança recebia no mínimo 100% das recomendações dietéticas diárias, acrescidas de leite fortificado com ferro e, semestralmente, tratamento para para-sitoses intestinais. As análises estatísticas se limitaram a 168 crianças (93%) para as quais se dispunham de medidas de pelo menos cinco meses. Como variáveis resposta, os escores Z das relações peso para estatura, estatura para idade e peso para idade fo-ram dicotomizados de forma que escore Z < – 1 indicava risco nutricional. Foram es-tudadas as proporções de crianças em ris-co nutricional a cada mês e utilizadas téc-nicas estatística multivariadas para contro-lar eventuais fatores de confundimento e correlacão entre as medidas subsequentes da mesma criança.
O percentual de crianças em risco nutricional diminuiu no decorrer do acom-panhamento, de10.1% para 3.4% na relação peso estatura, de 29.8% para 15.2 % na peso idade, e de 50.0% para 44.8% na estatura idade. A maior parte das reduções ocorre-ram entre os terceiro e quarto meses de frequência. Os modelos de dados correla-cionados para as três variáveis resposta dicotomizadas evidenciaram reduções de duas a três vezes nos riscos nutricionais descritos pelos indicadores de peso-estatu-ra (wasting) e peso-idade (underweight). Concluimos que a creche padrão diminui riscos nutricionais, sendo necessários apro-ximadamente quatro meses para que os benefícios sejam identificados.
Palavras-chave Palavras-chave Palavras-chave Palavras-chave
Palavras-chave: Estado nutricional. Pesquisa em serviços de saúde. Creches. Epidemiologia.
Introduction
Over the last few decades the number of children in day care centers in urban in-dustrialized societies has grown. This growth is due to the increase in the num-ber of working mothers and to the increase in the number of single-parent families. In 1995 in the United States, 60% of the chil-dren under five years of age, approximately 13 million children, received non-parental care or attended an early education pro-gram 1.
Similar trends can be found in develop-ing urban areas. For example, in the city of São Paulo, Brazil, the number of day care centers for low-income families has grown from 16 units in 1968 to 410 in 1984 and 692 in 1996. Approximately eighty thousand children from low-income families at-tended these institutions in 19962.
The effects of day care on child growth and development appear to vary by income. In the U.S., day care center attendance in-creases the risk of infections and injuries, and may cause behavioral disorders due to lack of mother-child contact 3-5. However,
for disadvantaged children living in third world urban slums, whose homes and fami-lies put them at developmental risk, atten-dance to day care centers may improve health and nutrition by providing adequate food and a sanitary environment 6, 7.
Day care may also decrease inequality in developing societies. A recent World Bank assessment of poverty in Brazil has identified the increase in day care center availability for low-income families as the most promising social policy to reduce pov-erty 8. Day care centers can be placed in
low-income areas, targeting health and nutrition interventions towards the most impover-ished children and, at the same time, allow-ing poor mothers to work.
rehabilita-tion centers and communities, little is known about catch-up growth in day care centers in developing countries 9. In
addi-tion, most studies of nutrition recovery have relied only on the description of clinical cases, or have considered multiple mea-surements in the same subject without ac-counting for the correlation among them 10, 11. Using multivariate statistical methods
that account for correlated multiple mea-surements, this study assesses the efficacy of a day care center in the city of São Paulo in improving the health of children at risk for malnutrition.
Methods
Study Population and Procedures
We collected data from children attend-ing a day care center in a slum in the city of São Paulo, Brazil, from March 1996, to No-vember 1996. A total of 180 children under five years of age attended the center during follow-up. All children were enrolled in the first or second month of follow-up. To be eligible for day care, children had to be up-to-date with all required immunizations. Vaccines for tuberculosis, whooping cough, diphtheria, tetanus, measles and poliomy-elitis are provided free by the Brazilian gov-ernment. The children spent every working day from 8 AM to 6 PM at the day care cen-ter, where they participated in age-group appropriate learning activities. Every day they received five meals that provided at least 100% of age-group recommended di-etary allowances 12. Meals were planned by
a nutritionist using computer software13.
Food preparation and actual intake were supervised by the nutritionist, who made corrections when needed to guarantee food quality and adequate intake for each child. Since nearly every child has parasites due to poor sanitary conditions in their homes, in March and September each child re-ceived 40mg of albendazole to decrease in-testinal infestation. To prevent iron defi-ciency anemia, every morning each child received a glass of milk fortified with 3.0 mg
of iron amino acid chelate 14.
In order to monitor nutritional status, we used standardized procedures and in-struments to obtain height and weight mea-surements for every child at the end of each month of enrollment. All measurements were taken by a nutritionist, (Souza15),
as-sisted by the day care center nurse. Length was measured for children in the nursery classes (age < 18 months), while height was measured for children in the pre-school groups (age 18 to 60 months). As we were interested in time trends, we restricted sta-tistical analyses to the 168 children (93%) who had measurements of height and weight from at least five months. Of these children, 143 (85%) had nine consecutive months of follow-up. Overall, a total of 1,458 monthly observations were obtained. Time-dependent covariates related to morbidity and day care attendance were recorded daily by each class instructor under the su-pervision of the nutritionist. Time-indepen-dent covariates were collected by a social worker upon enrollment in the day care center15.
Outcomes
The outcomes of interest were three measurements of nutritional status— weight-for-height Z scores (WHZ), a mea-sure of wasting or acute malnutrition; height-for-age Z scores (HAZ), a measure of stunting or chronic malnutrition; and weight-for-age Z scores (WAZ), a measure-ment of underweight. Z scores for the three outcome variables were calculated using an Epi-Info routine which utilizes a NCHS/ WHO reference population 16. We
dichoto-mized the three outcome variables so that a Z score < -1 indicated a child was at risk of malnutrition, and a Z score >= -1 indicated no risk 17.
Exposure and Covariates
the exposure of interest was months spent in the day care center. In addition to record-ing day care center attendance, we collected data on covariates that might confound the observed relationship between exposure and outcomes. The following time-depen-dent covariates were measured for each month of observation: number of days each child was absent from the day care center (continuous variable); class of enrollment (nursery or pre-school); presence of diar-rheal infection (yes or no); presence of skin infection (yes or no); and presence of res-piratory infection (yes or no). We also mea-sured eight time-independent dichoto-mous (yes/no) variables at baseline: birth weight less than 3000 g; prior hospitaliza-tion of the child; whether the child resided in a home with running water; maternal education <= 4 years; whether the child had other siblings; whether the child was breastfed < 60 days; age at enrollment < 18 months; and whether the child had at-tended a day care center before the study began.
Analysis
To evaluate whether day care center at-tendance improved health over time, we examined the proportion of children at risk for nutritional in each month. We also used multivariate statistical techniques to adjust for confounding and to account for intra-subject correlation resulting from multiple observations per subject. We chose a mar-ginal fixed effect model for correlated data that assumed an autoregressive correlation structure and robust variance estimator 18.
The model was fit using the generalized es-timating equations (GEE) method with SAS’s GENMOD procedure. Output from each model was in the form of eight preva-lence odds ratios (POR), comparing the odds of being at nutritional risk in months two through nine with the odds in month one.
Using correlated data models for each of the three outcomes (i.e., WAZ, HAZ, and WHZ), we evaluated whether the 13
covariates were univariate confounders. We fit models containing only the exposure variable, and models containing the expo-sure and one covariate. For each of the 13 covariates, including the covariate singly gave prevalence odds ratios that differed by less than 10% from the POR’s of the models with only the exposure variable. Therefore, we concluded that the covariates were not confounders in our data set. However, based on epidemiological and clinical knowledge, we included in our final mod-els five covariates: class of enrollment (an indicator of age and type of care provided), prior day care attendance, and presence of diarrhea, skin, and respiratory infections.
Results
Characteristics of the study
population
Many children enrolled in the study had characteristics associated with nutritional risk (Table 1). More than 40% weighed less than 3,000 grams at birth. Almost 70% had no running water at home. Two-thirds of mothers had received less than five years of schooling. Fewer than half the children were breastfed by their mothers for more than two months. Respiratory infections were common, with approximately half the children experiencing symptoms at least
Table 1. Characteristics of the 168 study participants at enrollment
Number %
Male 106 63.1
Prior hospitalization 59 35.1
Running water at home 52 31.0
Other siblings 128 76.2
Prior day care attendance 98 58.3
Mean Standard deviation
Birthweight (grams) 3100 698
Maternal education (years) 3.8 2.7
Breastfed (days) 88 69
once a month. Symptoms of diarrhea and skin infection were less frequent, each oc-curring in about 15% of children each month. The percentage of children with res-piratory infections showed a slight increase over time (p=0.01), while slight decreases in diarrheal (p=0.01) and skin infections (p=0.08) were seen.
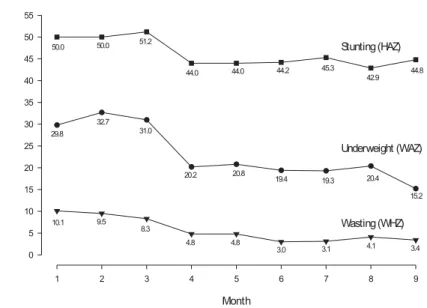
Time trends in outcome variables
At the beginning of the study, 10.1% of the children were at risk for wasting (WHZ < -1), 29.8% were at risk for underweight (WAZ < -1), and 50.0% of the children were at risk for stunting (HAZ < -1). For all three measures of outcome, the percentage of children at nutritional risk decreased over time (Figure 1). During the course of the study, the percentage of children with WHZ < -1 decreased to 3.4% by month 9. The per-centage with WAZ < -1 decreased to 15.2%. Recovery from stunting risk occurred less frequently, with the number of children having HAZ < -1 decreasing to 44.8%. Most of the reduction in children at nutritional risk took place between the third and fourth months of enrollment. The decrease over time was statistically significant for WHZ
(p<0.01) and WAZ (p<0.01), but not for HAZ (p=0.26).
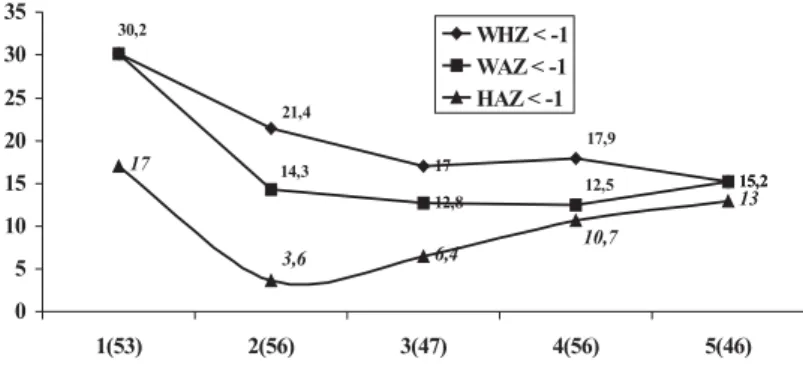
Modeling results
Correlated data models were fit for each of the three dichotomized outcomes – WHZ (wasting), WAZ (underweight) and HAZ (stunting). The prevalence odds ratios (with 95% confidence intervals) comparing months two through nine with month one are shown in Figure 2. The odds ratios for wasting (WHZ) for months 4 through 9 ranged from 0.45 to 0.28 and were highly significant, as the associated confidence in-tervals did not include the null value, POR=1. These odds ratios represent a two to three-fold reduction in the occurrence of wasting in months 4 through 9 compared to month 1. Similarly, the odds ratios for underweight (WAZ) in months 4 through 9 ranged from 0.64 to 0.43, representing an approximate two-fold reduction. This re-duction was also significant, as evidenced by 95% confidence intervals which ex-cluded the value one. The odds ratios for stunting for months 4 through 9 ranged from 0.78 to 0.92, representing a small, but not statistically significant, protective effect.
wasting and underweight is consistent with the pattern observed at nutritional rehabili-tation centers, where the time for nutrition recovery in most reports has varied from three to four months 19, 20. The modest
de-creases in stunting were also consistent with current epidemiological and clinical knowledge. Even though stunting is the most common anthropometric deviation found among impoverished children, its correction depends upon longer periods of adequate care and, even under favorable conditions, may not be corrected com-pletely 21.
As we did not follow a non-day care con-trol group, it is possible that the observed nutritional improvements were caused not by exposure to the day care center, but by other factors. The most important factor that might explain the improvements is the childhood aging process. Certain age groups can show improvements indepen-dent of interventions. Figure 3 shows this phenomenon using national survey data from São Paulo children who are similar to the children in our study, but most of whom were probably not enrolled in day care. A reduction in the percentage of children at nutritional risk occurred from age 1 to 2 for WHZ, WAZ, and HAZ. In most cases, after age 2 the percentage at risk increased, al-though for WHZ the percentage still de-creased from age 2 to 3.
There are a number of reasons why the normal aging process is unlikely to be the cause of the nutritional improvements we observed. First, in our models we controlled for enrollment class, an indirect measure of age. Second, by comparing the age distribu-tion of our study children (Figure 4) with Fig-ure 3, one can see that if the children had not been enrolled in day care, about as many would have experienced better outcomes as would have experienced worse ones. Third, most improvement in the models occurred between months 3 and 4, which is consis-tent with the time required for an interven-tion to cause nutriinterven-tion recovery. Finally, our results did not change when we divided the children into those older and younger than Figure 2. Prevalence odds ratios (PORs) showing
the odds of being at nutritional risk for months 2 through 9 compared with the odds for month1. PORs are shown for wasting (WHZ < -1), underweight (WAZ < -1), and stunting (HAZ < -1).
Discussion
provements in health care, sanitary condi-tions at home, and family income. However, we closely observed the community during the study period and saw no widespread changes in these conditions. Seasonal varia-tions could also potentially influence nutri-tional outcomes. In our study they were unlikely to have influenced nutritional im-provement since seasons are not markedly different in São Paulo. Also, all the children lived in slums where the availability of goods and services does not change in dif-Figure 3. Percentage of children at nutritional risk (Z score < - 1) by age in years, taken from the national demographic and health survey, 1996 (Brazil, 1996). Consists of a sub-sample of 258 children from São Paulo state urban areas whose mothers had less than 5 years of formal education.
Figure 4. Age distribution of children enrolled in the study (N=168).
2, and refit the models for the two age groups. We found no statistically significant reduc-tion in stunting for either age group, which was consistent with our original analysis. For underweight we still saw significant reduc-tions in both age groups, and although there were not enough outcomes to fit wasting models for the younger group, we still saw significant reductions in the older group (data not shown).
im-ferent seasons. Although the frequency of childhood infections varies in different sea-sons of the year, it is unlikely that a decrease in infections could explain the improve-ments we saw, since diarrhea and skin in-fections decreased only slightly, and respi-ratory infections increased. Even so, we controlled for infections in the analysis to ensure that they were not responsible for the nutritional changes observed.
The decrease in the proportion of chil-dren at nutritional risk (Z < -1) is probably due to the joint effect of three day care-as-sociated interventions: the provision of ad-equate diets, the iron fortification of milk, and the treatment of intestinal parasites. These interventions have been demon-strated to improve nutritional status in other studies 22-25. Since all children received
these three interventions, we were unable to determine which may have been the most important.
Recent studies have shown that the pre-vention of mild and moderate malnutrition has had more impact on child morbidity and mortality than the treatment of severe malnutrition 26. While many children in our
study were at risk for malnutrition (Z < -1), our sample did not show significant propor-tions of severe malnutrition (Z < -2). Most of the children would be classified as nor-mal or as having moderate or mild degrees of malnutrition. In an urban and partially developed city like São Paulo, few children have severe malnutrition 27. Many who are
severely malnourished do not survive to be enrolled in a day care center or are admit-ted to a hospital in order to recover. Thus, day care centers in low-income areas of cit-ies like São Paulo may be important tools for reducing child morbidity and mortality because they prevent mild and moderate malnutrition rather than treating severe malnutrition 28.
Well-operated day care centers in de-prived urban populations are effective in promoting better nutrition in children. Be-cause they also provide educational oppor-tunities for underprivileged children while allowing poor mothers to work, the estab-lishment of day care centers in developing urban areas is a promising social policy for decreasing poverty and improving health.
References
1. Hofferth SL. Child care in the United States today. Future Child 1996; 6(2):41-61.
2. Prefeitura do Município de São Paulo. Secretaria Municipal de Abastecimento. Programas de alimentação do Município. São Paulo; 1996.
3. Briss PA, Sacks JJ, Addiss DG, Kresnow M, O’Neil J. A nationwide study of the risk of injury associated with day care center attendance. Pediatrics 1994; 93: 364-7.
4. Caldwell, P. Child survival: physical vulnerability and resilience in adversity in the European past and the contemporary Third World. Soc Sci Med 1996; 43: 609-19.
5. Webb RE, Foegere W, Papillon Y. An evaluation of the educational benefits of nutritional rehabilitation centres as measured by the nutritional status of siblings. Environ Child Health 1975; 2:7-10.
6. Hillis SD, Weigle K, Miranda CM, McCann M, Bender D, Stewart P. Supplementary feeding in Colombian child care centers and growth velocity. Pediatrics 1994; 96:1070-1.
7. Stephenson LS, Latham MC, Kurz KM, Kinoti SN, Brigham H. Treatment with a single dose of albendazole improves growth of Kenyan schoolchildren with hookworm, Trichuris trichiura, and Ascaris lumbricoides infections. Am J Trop Med Hyg 1989; 41:78-87.
8. The World Bank, Brazil. Poverty assessment. Brasília (DF); 1996.
9. Marcovitch H. Failure to thrive. BMJ 1994; 308: 35-8.
20. Eisler M, Ravines LC, Ramirez JL. The Nutrition Rehabilitation Center. J Am Diet Assoc 1969; 55: 246-51.
21. Martorell R, Kettel Khan L, Schroeder DG. Reversibility of stunting: epidemiological findings in children from developing countries. Eur J Clin Nutr 1994; 48 suppl.1: S45-S57.
22. Hadju V, Stephenson LS, Abadi K, Mohammed HO, Bowman DD, Parker RS. Improvements in appetite and growth in helminth-infected schoolboys three and seven weeks after a single dose of pyrantel pamoate.
Parasitology 1996; 113:497-504.
23. Lawless JW, Latham MC, Stephenson LS, Kinoti SN, Pertet AM. Iron supplementation improves appetite and growth in anemic Kenyan primary school children. J Nutr 1994; 124: 645-54.
24. Queiroz SS, Torres MAA. Anemia carencial ferropriva: aspectos fisiopatológicos e experiência com a utilização do leite fortificado com ferro. Pediatr Mod 1995; 32: 441-5.
25. Silva E.M.K. Avaliação do estado nutricional de crianças de creches públicas e crianças que receberam outros tipos de cuidados no município do Embú-SP, 1994/1995. [tese de doutorado]. São Paulo: UNIFESP;1996.
26. Schroeder DG, Brown KH. Nutritional status as a predictor of child survival: summarizing the association and quantifying its global impact. Bull World Health Organ 1994; 72: 569-79.
27. BEMFAM-Brasil. Pesquisa Nacional sobre Demografia e Saúde – 1996. Rio de Janeiro; 1997.
28. Bengoa JM. Nutrition rehabilitation centers. J Trop Pediatr 1967; 12: 169-76.
11. WHO Working Group. Use and interpretation of anthropometric indicators of nutritional status. Bull World Health Organ 1986; 64:929-41.
12. American Dietetic Association (ADA). Position of the American Dietetic Association: nutrition standards for child care programs. J Am Diet Assoc 1994; 94: 363.
13. Anção NS, Cuppari L, Tudisco ES, Draibe S.A, Sigulem DM. Sistema de apoio à decisão em nutrição - versão 2.5. [software] São Paulo: CIS/EPM/ UNIFESP; 1995.
14. Lost C, Name JJ, Jeppsen RB, Ashmead HD. Depleting hemoglobin in iron deficiency anemia in young children through liquid milk fortification with bioavailable iron amino acid chelate. J Am Coll Nutr 1998; 17:187-94.
15. Souza PC. Efeito da frequência a uma creche padrão na saúde e nutrição de 74 pré-escolares residentes em favelas [dissertação de mestrado]. São Paulo: UNIFESP;1997.
16. Dean AG, Dean JA, Coulombier D, Brendel KA, Smith DC, Burton AH et al. Epi Info, version 6: a word processing, database, and statistics program for epidemiology on microcomputers [computer program]. Atlanta, Georgia: Centers for Disease Control and Prevention; 1994.
17. WHO Expert Committee on Physical Status. The use and interpretation of anthropometry. Geneva; 1995. (WHO -Technical Report Series, 854).
18. SAS Institute, Inc. SAS/STAT software: changes and enhancements through release 6.12. [computer program]. Cary, NC: SAS Institute; 1997.