Validation of a quantitative
food frequency questionnaire
developed to under
graduate students
Validação de um questionário
quantitativo de frequência
alimentar desenvolvido para
universitários
Tiemy Rosana KomatsuI
Simone Kimie OkuI
Suely Godoy Agostinho GimenoII
Leiko AsakuraIII
Lucíola de Castro CoelhoI
Clarissa Viana Demézio da SilvaIV
Rita de Cássia Coelho Almeida AkutsuV
Anita SachsI
ISpecialization Program of Public Health Nutrition, Department of Preventive
Medicine, Paulista Medicine School - São Paulo (SP), Brazil; e acrescentar o item
IIPost-graduation Program of Public Health, Department of Preventive
Medicine, Paulista Medicine School - São Paulo (SP), Brazil.
IIINutrition School, Universidade Federal de Alagoas – Maceió (AL), Brazil.
IVGynecology Institute,Universidade Federal do Rio de Janeiro – Rio de Janeiro
(RJ), Brazil.
VDepartment of Nutrition, Universidade de Brasília – Brasília (DF), Brazil.
Corresponding author: Anita Sachs. Departamento de Medicina Preventiva. Rua Botucatu, 740, Vila Clementino, CEP: 04023-900, São Paulo, SP, Brazil. E-mail: [email protected]
Conlict of interests: nothing to declare.
Abstract
A validity test of a Food Frequenc y Questionnaire was carried out using 50 stu-dents of health occupation in São Paulo, Brazil. herefore, a three day dietary record was used as reference method and variables such as energy, macronutrients and dietary iber were analyzed. he accordance between the Food Frequency Questionnaire and average data from dietary record was tested with kappa statistics and intra-class correla-tion coeicients (ICC). Limits of agreement were estimated by the Bland-Altman’s method. Better results were found for calories (ICC 0.43; 95%CI 0.17 – 0.63) and non-energy-adjusted nutrients, except dietary fiber (ICC 0.34; 95%CI 0.07 – 0.56). he percentage of individuals classiied in the same category of consump-tion was nearly half (49.8%), while only 16% of them were classiied in opposite categories. With the exception of lipids, other ana-lyzed variables tended to be overestimated by the Food Frequency Questionnaire. he Food Frequency Questionnaire is recommended as a method of assessing food intake of university students in studies which focuson calorie esti-mates and also intend to classify groups into intake categories.
Resumo
Validou-se um Questionário Quantitativo de Frequência Alimentar em 50 graduandos em Saúde de São Paulo, Brasil. Considerou-se o registro alimentar de 3 dias como referên-cia e variáveis energia, macronutrientes e ibras alimentares. A concordância entre o Questionário Quantitativo de Frequência Alimentar e a média dos registros alimentares de 3 dias foi avaliada pela estatística kappa, pelo coeiciente de correlação intraclasse (ICC) e percentual de concordância. Os limites de concordância foram examinados pelos grá-icos de Bland-Altman. Melhores valores de coeiciente de correlação intraclasse foram encontrados para calorias (ICC 0,43; IC95% 0,17 – 0,63) e para nutrientes não ajustados por calorias, com exceção das fibras (ICC 0,34; IC95% 0,07 – 0,56). O percentual de concordância mostrou uma minoria classii-cada em terços opostos (16%) e aproximada-mente metade classiicada no mesmo terço (49.8%). Houve tendência à superestimação nos dados do Questionário Quantitativo de Frequência Alimentar para calorias e nutrien-tes, exceto gorduras. Recomenda-se a utilização deste instrumento em população universitária em estudos que visem à estimativa de calorias, bem como à classiicação dos indivíduos em categorias de consumo.
Palavras-chave: Consumo de alimentos. Questionários. Estudos de validação. Serviços de Saúde para Estudantes.
Introduction
Epidemiological studies provide evidence able to identify risk factors and the impor-tance of the diet in the prevention of non-transmissible chronic diseases (NTCDs)1-3.
The quantification and assessment of the diet are diicult tasks, although vital to the relationship between nutrients and NTCDs and in the monitoring of individual and populational dietetic behavior4,5. hose
studies belong to the nutritional epidemio-logical area6.
Several types of instruments are used to assess both the present and previous diet: the 24 hour dietary recall (R24h), food-intake record (FR), and the food frequency question-naire (FFQ). All of those instruments show either advantageous or limiting results7.
Presently, the FFQ is the most useful instru-ment in epidemiological studies, intended to assess the relation between diet and disease, since it enables the access to information about the food intake level before the disease and also, from the scientiic point of view, a much less expensive method5. The instrument is
structured in awayit can consider the dietary intake recording frequency in time-units and it might be subject to two types of errors: ran-dom and systematic ones8. Systematic errors
occur when there is a diference between the measured value and the real one, and thus, interfering in the instrument validity9. In order
to minimize such results, more investigative studies on instrument validation are necessary. A validation study should be conducted in order to improve the FFQ application within a speciic population10, and to avoid
missinter-pretations, improve accuracy and reduce bias levels related to diet-disease occurrences7,11,12.
of the university’s population. Since no golden-standard is known to exist, related to a dietary intake assessment, this study was intended to verify the relative validity of a quantitative food frequency questionnaire, especially built for col-lege students of the healthcare area.
Methods
Quantitative Food Frequency Questionnaire construction
The study included 104 volunteers from the healthcare area, attending to the Students’ Nutrition Ambulatory of the Universidade Federal de São Paulo (UNIFESP). This self-administered quantitative FFQ included 77 items at its initial stage. he food list was based in informed food and preparations for a 3-days dietary report (3dDR)13. In addition to
that, information about home measurements were changed to grams and mL, with the help of centesimal composition charts14-16, and
cal-culated by the Nutritional Support software of UNIFESP17. he charts were then organized
according to the percentage contribution for the total energy value informed, and selected and assembled according to their nutritional similarity and also according to the food that responds to the 95% of the energy intake. Based on the distributive percentage related to each weighted portion in grams, it was possible to deine as a small portion (S) the one with value equal or lower than 25%; the medium portion (M) at 50% and the large one (L) at 75% or more. Following the development of a pilot project, the instrument was restructured as to include 70 food items. In addition to the food list, the FFQ presents a blank to be illed with the type of food absent from the initial list but pertaining to the dietary habits of the voluntary participant. hus, their consumption frequency, of at least once a week, was considered valid5.
Study validity
he instrument used to assess the amount of food items consumed was tested in univer-sity students of both genders. he inclusion
criteria were the absence of any interfering condition related to the usual food intake (such as pregnancy, lactation etc.), no previous nutritional orientation and the student being enrolled in the health care area of UNIFESP. Convenient samples were attained by invi-tation, in the classrooms, to participate in the project. All students interested in the project were directed to the Students’ Ambulatory of Health Service, where their personal informa-tions were collected. At irst, 108 students were recruited, but at the end only 50 of them — from the several health area Graduation courses — comprised the total sample. Participants were asked to sign an Informed Consent form and the investigation was approved by the Ethics and Research Committee from UNIFESP (CEP 1152/09).
he validation study sought to compare results attained by the study-test-method and results obtained by a reference method, considered of superior quality. The 3dDR instrument was used in order to avoid errors co-related to FFQ5,7.
he FFQ was illed before the 3dDR in order to estimate the usual diet as suggested by Cade et al. 12.Data collection was performed by trained
nutritionists — dietitians attending the Public Health Specialization in Nutrition course at UNIFESP.
Literature suggests that the applied methods should be in consonance with the period of time in which they are to be conducted12. hus, FFQ
data collection was approved for a period of six months. his same period was considered for the reference method (3dDR) data collection. Food items in the 3dDR home measurements were converted to grams /day using the Nutritional Support software of UNIFESP17 and the
compo-sition tables for food items14-16. As for the FFQ,
it was conducted in a previous phase, dealing with the changes occurred in the food intake in grams /day using an Excel
®
18 spreadsheet,Statistical analysis
Data were analyzed by the SPSS software, version 15.0, for Windows19, considering a
signiicance level of 5%. In a previous analysis on the validity of FFQ, the Student’s t-test was
done in pairs, intending to verify the existence of statistically signiicant diferences. In addi-tion the residual method was performed for energy adjustment previous to intra-class correlation coefficient (ICC) estimate as proposed by Willett and Stampfer20. Relative
validity was assessed using ICC for raw nutri-ents and adjusted by energy21.
The Kappa index was used to assemble dietetic variables related to consumption´s thirds of each method. In this case, the assess-ment was carried out with the total proportion of participants correctly classiied in the same consumption category22. Information
diver-gences were examined in a graphic developed by Bland and Altman23, allowing trend
veriica-tion on sub- or- over data estimaveriica-tion, presented by the test-method.
Results
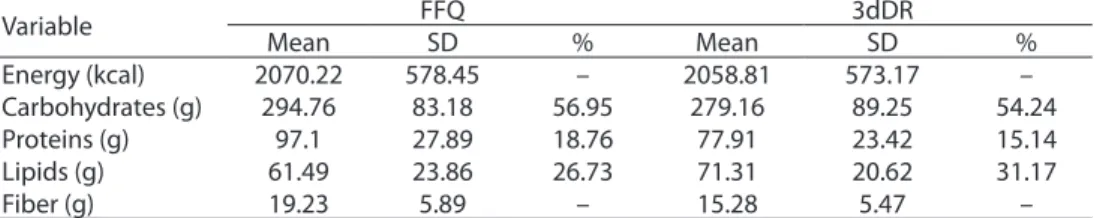
Most participants were female (74%). he sample consisted of students of medicine (44%), nursing students (22%), nutrition stu-dents (18%) and others (16%). From the initial sample, which included 108 participants, 53.7% of them were presented with incomplete docu-ments or desistance and so, only 50 participants were approved for the validation study. Table 1 shows data related to energy and nutrients obtained by both dietary inquiries. As for the
percentage of macronutrient contributions, increased values were shown by the FFQ for carbohydrates and proteins when compared to those of 3dDR.
In relation to kappa statistics values when adjusted to energy, little concordance was observed of macronutrients when compared to FFQ and 3dDR data are shown in Table 2. Better results were seen for energy (ICC 0.32; 95%CI 0.1 – 0.55). Table 3 shows the resulting FFQ capacity in classifying individuals within the same thirds, adjacent thirds or opposite thirds, for each consumption variable, after the adjustment by energy.
It was observed that individuals classiied in the opposite thirds are represented by the minority (16%), as approximately half of the participants were classified in the same thirds. However, results do not point to a valid agreement since the attained values for kappa were low, mainly for macronutrients, and varying from 0.05 for proteins to 0.14 for carbohydrates and lipids.
It was observed a tendency to overestima-tion in the FFQ value for energy and nutrients, except for lipids (Table 4). Bland and Altman’s23
proposed graphics were built in order to verify the divergences between both methods. hus analysis of the diference between the nutrients and energy found the same results (Figure 1A and B). Figure 1A shows that higher deviation levels between data on energy obtained by FFQ and 3dDR were seen in intakes of more than 2000 kcal. Figure 1B shows trends of overestima-tion in the FFQ report, in relaoverestima-tion to 3dDR for proteins as well as for other nutrients, whose results were similar.
Table 1 - Crude values for energy and macronutrients from the Food Frequency Questionnaire and 3-days Dietary Report and the percentage contribution of macronutrients in relation to the total energy.
Tabela 1 - Valores brutos de calorias e macronutrientes obtidos pelos Questionário de Frequência Alimentar e Registro Alimentar de 3 dias e percentual de contribuição de macronutrientes em relação ao valor calórico total.
FFQ: Food Frequency Questionnaire; 3dDR: 3-days Dietary Report; SD: standard deviation. FFQ: Questionário de Frequência Alimentar; 3dDR: Registro Alimentar de 3 dias; SD: desvio padrão.
Variable FFQ 3dDR
Mean SD % Mean SD %
Energy (kcal) 2070.22 578.45 – 2058.81 573.17 –
Carbohydrates (g) 294.76 83.18 56.95 279.16 89.25 54.24
Proteins (g) 97.1 27.89 18.76 77.91 23.42 15.14
Lipids (g) 61.49 23.86 26.73 71.31 20.62 31.17
Table 2 - Weighted Kappa statistics values and interclass correlation coeicients with a 95% conidence interval between the Food Frequency Questionnaire and 3-days Dietary Reports´ variables.
Tabela 2 - Valores da estatística kappa ponderado e coeiciente de correlação intraclasse, com intervalo de coniança de 95% entre as variáveis do Questionário de Frequência Alimentar e do Registro Alimentar de 3 dias.
*adjusted for energy. ICC: interclass correlation coeicients. *ajustado para energia. ICC: coeiciente de correlação intraclasse.
Variable ICC 95%CI Kappa 95%CI
Energy (kcal) 0.43 0.173 – 0.630 0.32 0.097 – 0.545
Carbohydrates (g) 0.35 0.08 – 0.569 0.05 0 – 0.2679
Proteins (g) 0.35 0.08 – 0.569 0.23 0.014 – 0.4476
Lipids (g) 0.38 0.112 – 0.591 0.28 0.063 – 0.489
Fiber (g) 0.28 -0.001 – 0.512 0.19 0 – 0.396
Carbohydrates* 0.22 -0.055 – 0.471 0.14 0 – 0.371
Proteins* 0.29 0.014 – 0.523 0.05 0 – 0.271
Lipids* 0,26 -0.016 – 0.501 0.14 0 – 0.366
Fiber* 0,34 0.068 – 0.580 0.23 0.024 – 0.438
Table 3 - Percentual of thirds’ classiication and weighted Kappa after adjustment for energy.
Tabela 3 - Classiicação percentual dos participantes em terços e kappa ponderado após ajuste de energia.
Variable Same Third (%) Adjacent Third (%) Oposit Third (%) Kappa p-value*
Energy (kcal) 54 32 14 0.32 0
Carbohydrates (g) 44 36 20 0.14 0.11
Proteins (g) 36 44 20 0.05 0.69
Lipidss (g) 42 40 18 0.14 0.2
Fiber (g) 40 52 8 0.23 0.32
Mean 49.8 40.8 16 – –
*for crude agreement. *para concordância bruta.
Figure 1 - Bland-Altman graphic for energy (A) and protein (B).
Figura 1 - Gráico de Bland-Altman para energia (A) e para proteína (B)
165 145 125 105 85 65 45 -70 -50 -30 -10 10 30 50 70
Média PTN_QFA e RA
Diferença PTN_QFA e RA
500
0 1000 1500 2000
-2000 -1500 -1000 1000 1500 2000
-500 500
0
2500 3000 3500 4000 4500
Média PTN_QFA e RA
Diferença PTN_QFA e RA
A B
Table 4 - Means and standard deviation of the diference of data gathered trough Food Frequency Questionnaire and 3-days Dietary Report adjusted for energy.
Tabela 4 - Média e desvio padrão da diferença dos dados obtidos pelo Questionário de Frequência Alimentar e Registro Alimentar de 3 dias ajustados pela energia.
Variable Average (FFQ-3dDR) SD
Energy (kcal) 11.4 615.46
Carbohydrates (g) 17.42 35.02
Proteins (g) 20.57 18.42
Lipids (g) -11.07 11.84
Fiber (g) 3.17 5.56
Discussion
Assessing food intake is not an easy task, due not only by the absence of a golden standard but also by the fact that the existing methods are subject to variations and measurement errors24.
Both 3dDR and FFQ showed tendency to protein rich diets (Table 1), according to the WHO recommendations25, which are intended
to prevent NTCDs. he contributing percentage of proteins in relation to the total energy value was over 15%. As a consequence, an alteration occurs in the percentage of other participating macronutrients. he low intake of fibers (< 25 g/d)26 reinforces the need for
nutritional attention and surveillance toward this populational group. he mean levels for energy intake, ibers and macronutrients except lipids, were higher for FFQ in relation to those in 3dDR. Since the comparison between the mean of energy and nutrients between both methods provide limited information concerning the validity5 , other statistical tests
were carried out.
he ICC and the kappa index values were low and even furtherly reduced when energy was corrected (Table 2). his adjustment of nutri-ents using energy is seen as a methodological strategy developed to correctly try to estimate parameters and try to control any eventual confusion efect caused by energy in valida-tion8,10 studies. The Reduction of coefficient
values after the adjustment by energy is useful to other studies27-31, which may evidence the
presence of systematic errors on sub-or-super account of food consumption5,31.
A large number of validation studies used the Pearson’s or the Spearman’s correlation coef-icient when comparing the methods9,27-30,32-40
which turned results more difficult to be evaluated. In spite of the coeicient’s attained values, the use of ICC was adopted for viewing the several publications which point to over-estimates association when using Pearson’s correlation in samples with great inter-subject variability, which as a consequence, could lead to false conclusions concerning the method’s validity23,41. High values for Pearson’s
cor-relation coeicient do not necessarily mean that both methods are consistent, since this
measurement is only directed to the strength relation between two variables23.
Related literature shows that correlations between the FFQ diet estimations and the method of reference are found between 0.3 and 0.742, although other studies had been
published about similar methodology valida-tion with lower coeicients, than those seen here, for some nutrients16,31. hose studies
showed a satisfactory reproducibility level and reasonable validity in relation to the studied nutrients.
he FFQ validity evaluation was also tested by comparing the individuals’ classiication within the consumption thirds for both methods. Results showed to be consistent with other studies in literature, regarding studies with similar methodology8,9,43,44, a higher
percentage of individuals classified in the same category (43.2%) and a few individuals in opposite thirds (16%). he questionnaire’s ability in classifying individuals, according to their intake level, contributed to attain a correct risk estimate31.
Mc Pherson et al.45 stated that some
self-administered dietary inquiries present overestimated results at the first contact with the instrument in relation to the second. In the present study, it could be observed that FFQ overestimated the dietary mea-surements, except when dealing with lipids. As for proteins and carbohyrates, a higher divergence level between the methods was observed. Other authors31,43 found more
coherent data during a second applica-tion of the FFQ and 3dDR methods and suggested a better participant preparation when answering on the changes of their dietary intake, during the period of the study. Krebs-Smith10 emphasized an
over-estimation trend related to dietary intake, which might be the result of a long food list, leading then to the responsive indi-viduals’ weariness. The food list was care-fully developed and reformulated after the execution and inclusion of 70 food items in the pilot project.
Viewing to improve the results interpretation, the methodology proposed by Bland-Altman23
the consumption data, so then it was possible to observe that in lower energy intake cases, the agreement between methods turns to be more useful. Approximately over 200 kcal data shows to be more distant from the mean levels, even if ICC and higher kappa (0.43 and 0.42, respectively) had been found when compared to macronutrients and ibers.
Among this study’s limitations, it is impor-tant to mention the higher number of female participants and the losses. Other Brazilian studies that considered the university popu-lation have also included larger number of female participants in relation to the number of males46,18, although this is a characteristic
of the population of students46-48 enrolled in
the Graduation courses of UNIFESP (61.44% females, 2009). In relation to losses, it is pos-sible that this high percentage might have inluenced the results concerning the viewing the inal sample small size. he reason for such losses, was the poor attendance for nutritional visits, absence of 3dDR, FFQ incorrect record illing, and/or lacking of the Informed Consent. Literature suggests12 that a minimum
num-ber (50) of participants may be adequate for a validation study12. Other studies on validation,
conducted in Brazil, also presented losses to follow up, even though, with a lower per-centage as seen in the present study (53.7%): Assis et al.49 and Ribeiro et al.28 with 14% and
Zanolla et al.31 with 27%. A study by Cardoso
et al.27 showed that from the initial sample of
255 nutritionists, the investigators remained with only 77 individuals for the reproducibility study. For validation, 52 participants were recruited. However, validation studies in Brazil may eventually include less than 50 participants9,22,29,30. In addition to that,
it may be possible to emphasize a series of
limitations inherent to any FFQ as those related to memory, perception, lacking stan-dartization, structure faults, and also due to chance42. Speciically, in relation to the tested
FFQ, a possible biased record should be taken into consideration since this FFQ is self-administered, and subject to false interpreta-tions, even with a previous pilot-study having been conducted and intended to minimize this efect. he low correlation coeicients levels — except those of calories and ibers — for the agreement methods, may occur mainly in the absence of a golden-pattern. Due to this inding, it was opted for the use of 3dDR, since this method independs on the memory and it may lead to less FFQ correlated errors5, and
also to its possible application in the studied sample. However, the illing of 3dDR opens the space for possible changes in the present diet and as a consequence, not relecting the real consumption. At the same time, the role played by the dietary intake variability within the course of time must be emphasized and also, one must not ignore the existence of a diferent scale in order to estimate the nutri-ent intake using the FFQ or 3dDR10.
he knowledge of the problems linked to the method enables the development of new studies which seek its correction and calibra-tion. This way, it is recommended that the use of this instrument in university popula-tion in studies intended to estimate energy as well as in the classiication of individuals in consumption categories. he use of adequate instruments may serve as the basis to develop adequate instruments, able to serve as the basis for strategies, development of new strategies, disease prevention, and also, to improve the quality of life and health promotion.
References
1. Barreto ML, Carmo EH. Tendências recentes das doenças crônicas no Brasil. In: Lessa I. O adulto brasileiro e as doenças crônicas da modernidade: epidemiologia das doenças crônicas não-transmissíveis. São Paulo: Hucitec; 1998. p. 15-27.
2. Tomita LY, Cardoso MA. Avaliação da lista de alimentos e porções alimentares de Questionário Quantitativo de Frequência Alimentar em população adulta. Cad Saúde Pública 2002; 18:1747-56.
3. Geraldo JM, Alfenas RCG. Papel da dieta na prevenção e no controle da inlamação crônica – evidências atuais. Arq Bras Endocrinol Metabol 2008; 52(6): 951-67.
4. Carroll RJ, Pee D, Freedman LS, Brown CC. Statistical design of calibration studies. Am J Clin Nutr 1997; 65(4 Suppl): 1187S-89S.
6. Sempos CT, Liu K, Ernst ND. Food and nutrient exposures: what to consider when evaluating epidemiologic evidence. Am J Clin Nutr 1999; 69(6): 1330S-38S.
7. Slater B, Lima FEL. Validade e reprodutibilidade dos métodos de inquérito alimentar. In: Fisberg RM, Slater B, Marchioni DML, Martini LA. Inquéritos alimentares: métodos e bases cientíicos. São Paulo: Manole; 2005. p.1-31.
8. Slater B, Philippi ST, Marchioni DML, Fisberg RM. Validação de questionário de Frequência Alimentar – QFA: considerações metodológicas. Rev Bras Epidemiol 2003; 6: 200-8.
9. Matarazzo HCZ, Marchioni DML, Figueiredo RAO, Slater B, Neto JE, Filho VW. Reprodutibilidade e validade do questionário de frequência de consumo alimentar utilizado em estudo caso-controle de câncer oral. Rev Bras Epidemiol 2006; 9(3): 316-24.
10. Salvo VLMA, Gimeno SG. Reprodutibilidade e validade do questionário de frequência de consumo de alimentos. Rev Saude Publica 2002; 36(4): 505-12.
11. Kaaks R, Riboli E. Validation and calibration of dietary intake measurements in the EPIC project: methodological considerations. European Prospective Investigation into Cancer and Nutrition. Int J Epidemiol 1997; 26 Suppl 1: S15-25.
12. Cade J, hompson R, Burley V, Warm D. Development, validation and utilisation of food-frequency questionnaires – a review. Public Health Nutr 2002; 5(4): 567-87.
13. Carvalho FS, Van Laer NM, Sachs A, Salvo VLMA, Coelho LC, Santos GMS, et al. Desenvolvimento e pré-teste de um questionário de frequência alimentar para graduandos. Rev Nutr 2010; 23: 847-57.
14. Pinheiro ABV, Lacerda EMA, Benzecry EH, Gomes MCS, Costa VM. Tabela para avaliação de consumo alimentar em medidas caseiras. Rio de Janeiro: Atheneu; 2007.
15. Fisberg RM, Villar BS. Manual de receitas e medidas caseiras para cálculos de inquéritos alimentares. São Paulo: Sigmus; 2002.
16. NEPA-UNICAMP. Tabela brasileira de composição de alimentos (TACO). Campinas: NEPA-UNICAMP; 2004.
17. Anção MS, Cuppari L, Draibe SA, Sigulem D. Programa de apoio à Nutrição. Versão 1.15. São Paulo: Departamento de Informática em Saúde – SPDM UNIFESP/EPM; 2002.
18. Microsoft Corporation. Microsoft Oice Excel ®.[computer program] Estados Unidos; 2003.
19. SPSS Corporation. SPSS for Windows®.[computer program]. Version 15.0. Chicago; 2006.
20. Willett WC, Stampfer MJ. Total energy intake:
implications for epidemiologic analyses. Am J Epidemiol 1986; 124(1): 17-27.
21. Fleiss JL. he design and analysis of clinical experiments. New York: John Wiley & Son; 1986.
22. Marchioni DM, Voci SM, Lima FE, Fisberg RM, Slater B. Reproducibility of a food frequency questionnaire for adolescents. Cad Saúde Pública 2007; 23(9): 2187-96.
23. Bland JM, Altman DG. Measuring agreement in method comparison studies. Stat Methods Med Res 1999; 8(2): 135-60.
24. Lopes ACS, Caiafa WT, Mingoti SA, Lima-Costa, MFF. Ingestão alimentar em estudos epidemiológicos. Rev Bras Epidemiol 2003; 6(3): 209-19.
25. World Health Organization. Diet, nutrition and the prevention of chronic diseases. Report of a Joint WHO/ FAO Expert Consultation. Geneva; 2003.
26. Brasil. Ministério da Saúde. Secretaria de Atenção à Saúde. Coordenação-Geral da Política de Alimentação e Nutrição. Guia alimentar para a população brasileira: promovendo a alimentação saudável. Brasília: Ministério da Saúde; 2005. 236p. – (Série A. Normas e Manuais Técnicos).
27. Cardoso MA, Kida AA, Tomita LY, Stocco PR. Reproducibility and validity of a food frequency questionnaire among women of Japanese ancestry living in Brazil. Nutr Res 2001; 21: 725-33.
28. Ribeiro AC, Sávio KEO, Rodrigues MLCF, Costa THM, Schmitz BAS. Validação de um questionário de frequência de consumo alimentar para população adulta. Rev Nutr 2006; 19(5): 553-62.
29. Lima FEL, Slater B, Latorre MRDO, Fisberg RM. Validade de um questionário quantitativo de frequência alimentar desenvolvido para população feminina no nordeste do Brasil. Rev Bras Epidemiol 2007; 10(4): 482-90.
30. Galante AP, Colli C. Desenvolvimento e aplicação de um questionário semiquantitativo de frequência alimentar on-line para estimar a ingestão de cálcio e ferro. Rev Bras Epidemiol 2008; 11: 402-10.
31. Zanolla AF, Olinto MTA, Henn RL, Wahrlich V, Anjos LA. dos. Avaliação de reprodutibilidade e validade de um questionário de frequência alimentar em adultos residentes em Porto Alegre, Rio Grande do Sul, Brasil. Cad Saúde Pública 2009; 25: 840-48.
32. Sichieri RE, Everhart J. Validity of a Brazilian food frequency questionnaire against dietary recalls and estimated energy intake. Nutr Res 1998; 18: 1649-59.
33. Chan SG, Ho SC, Kreiger N, Darlington G, Adlaf EM, So KF, et al. Validation of a food frequency questionnaire for assessing dietary soy isolavone intake among midlife Chinese women in Hong Kong. J Nutr 2008; 138(3): 567-73.
32. Field AE, Peterson KE, Gortmaker SL, Cheung L, Rockett H, Fox MK, et al. Reproducibility and validity of a food frequency questionnaire among fourth to seventh grade inner-city school children: implications of age and day-to-day variation in dietary intake. Public Health Nutr 1999; 2(3): 293-300.
34. Imaeda N, Goto C, Tokudome Y, Hirose K, Tajima K, Tokudome S. Reproducibility of a short food frequency questionnaire for Japanese general population. J Epidemiol 2007; 17(3):100-7.
35. Jackson M, Walker S, Cade J, Forrester T, Cruickshank J.K, Wilks R. Reproducibility and validity of a quantitative food-frequency questionnaire among Jamaicans of African origin. Public Health Nutr 2001; 4(5): 971-80.
36. Matthys C, Pynaert I, De Keyzer W, DeHenauw S. Validity and reproducibility of an adolescent web-based food frequency questionnaire. J Am Diet Assoc 2007; 107(4): 605-10.
37. Messerer M, Johansson SE, Wolk A. he validity of questionnaire-based micronutrient intake estimates is increased by including dietary supplement use in Swedish men. J Nutr 2004; 134(7): 1800-5.
38. Parr CL, Veierød MB, Laake P, Lund E, Hjartåker A. Test-retest reproducibility of a food frequency questionnaire (FFQ) and estimated efects on disease risk in the
Norwegian Women and Cancer Study. Nutr J 2006; 5: 4.
39. Ribeiro LG, Cardoso LO. Estudos de validação: Qual análise utilizar? Rev Bras Med Esporte 2009; 15: 316.
40. Slater B, Marchioni DM, Voci SM. Use of linear regression for correction of dietary data. Rev Saude Publica 2007; 41(2): 190-6.
41. Lee MS, Pan WH, Liu KL, Yu MS. Reproducibility and validity of a Chinese food frequency questionnaire used in Taiwan. Asia Pac J Clin Nutr 2006; 15(2): 161-9.
42. Bilau M, Matthys C, Bellemans M, De Neve M, Willems JL, De Henauw S. Reproducibility and relative validity of a semi-quantitative food frequency questionnaire designed for assessing the intake of dioxin-like contaminants. Environ Res. 2008; 108(3): 327-33.
43. McPherson RS, Hoelscher DM, Alexander M, Scanlon KS, Serdula MK. Dietary assessment methods among school-aged children: validity and reliability. Prev Med 2000; 31: S11-S33.
44. Fujimori E, Oliveira IMV, Soares MAL, Osso AN. Avaliação nutricional de estudantes universitários do sexo feminino. Rev Esc Enferm USP 1994; 28: 72-82.
45. Santos JS, Xavier AAO, Ries EF, Costabeber I, Emanuelli T. Consumo de produtos de origem animal por universitários em Santa Maria – RS. Nutrire: rev Soc Bras Alim Nutr= J Brazilian Soc Food Nutr 2006; 31(2): 13-24.
46. Marcondelli P, Costa THM, Schmitz BAS. Physical activity level and food intake habits of university students from 3 to 5 semester in the health area. Rev Nutr 2008; 21(1): 39-47.
47. De Assis MA, Kupek E, Guimarães D, Calvo MC, De Andrade DF, Bellisle F. Test–retest reliability and external validity of the previous day food questionnaire for 7–10-year-old school children. Appetite 2008; 51(1): 187-93.