SPR sensors in D-type optical fibers
DOCTORAL THESIS
Diego Felipe De Nóbrega Dos Santos
DOCTORATE IN AUTOMATION AND INSTRUMENTATIONSUPERVISOR
José Manuel Rocha Teixeira Baptista
III
Acknowledgements
First, I am thankful to Prof. Dr. José Manuel Baptista and Prof. Dr. Ariel Guerreiro, for supervising me in the past years during my Ph.D. thesis. José Manuel had always asked for new scientific possibilities and looking for error in the results making me to understand completely the results, before continuing to other problems. Ariel gave me a lot advice about the simulation, how to solve the problems and suggesting from time to time a crazy idea.
Also, I am thankful to all the group of the department of physics of the University of Madeira in special to Prof. Dr. Pedro Almeida and Prof. Dr. Mikhail Benilov for advice about COMSOL Multiphysics and show me that there are more than SPR sensors in optical fibers.
I am also thankful to Prof. Dr. Markus Schmidt, Prof. Dr Kay Schuster and Prof. Dr. Patrick Uebel, that welcomed in Institute for Photonic Technology (IPHT) and let me understand the theoretical and experimental physics difficulties of working with optical fibers.
I also would like to thank to Dr. Nunzio Cennamo and Prof. Dr. Luigi Zeni from the
Second University of Naples and Dr. Luis Coelho and Dr. Pedro A. S. Jorge from Institute for Systems and Computer Engineering, Technology and Science (INESC-TEC former INESCPorto) for allowing me to validate the experimental and theoretical results.
To the University of Madeira and to INESC-TEC friends, teachers and staff for the companionship and professionalism shown over the years.
I also like to acknowledge the Portuguese funding institution (FCT - Fundação para a Ciência e a Tecnologia) for supporting their program under Grant SFRH/BD/85068/2012.
IV
Abstract
This thesis investigates how to improve the performance of current designs of optical fiber sensors based on Surface Plasmon Resonance, and how to use a better understanding of the physical and sensing principles behind them to propose new sensing concepts and ideas. We adopt a methodology based on numerical simulations because they provide a better insight onto the operation of these sensors and because they allow an easy and quick way of testing new designs and concepts without the need to fabricate the sensors. We also show that these simulations have a good agreement with experimental results.
We adopt a systematic approach to investigate the various parameters that influence the sensor performance, and present different sensors designs, where we study the localization, optical properties, shape and size of the metal components, combined with different type of fibers, resulting in the coupling between the plasmon and optical modes. Furthermore, we verify that choosing the optical modes used in sensing in multimode fibers can also have advantages. We investigate the use of modern artificial materials, such as metamaterials, as well as the inclusion of multiple wires in the fiber to enhance the performance of the SPR sensor. At a more fundamental level, we show that the control of the coupling between multiple plasmon modes in metal components and the optical modes in the fiber constitutes a new way to improve the performance of the sensor and can be inclusively used to develop a new type of SPR sensors capable of measuring simultaneously two variables, such as the external refractive index and temperature
Keywords: Optical fiber sensor, Surface plasmon resonance, Numerical simulation,
V
Resumo
Esta tese investiga como é possível melhorar o desempenho das estruturas atuais dos sensores de fibra ótica baseados em Ressonância Plasmónica de Superfície (SPR), bem como compreender melhor os princípios físicos e de sensorização na base do seu funcionamento, permitindo propor novos conceitos de sensores. Foi utilizada uma metodologia baseada em simulações numéricas, pois proporcionam um melhor entendimento do funcionamento desses sensores, constituindo uma maneira simples e rápida de testar novas estruturas e conceitos, sem a necessidade de fabricar os sensores. Mostra-se também que essas simulações têm uma boa concordância com os resultados experimentais.
Foi adotada uma abordagem em que se investiga sistematicamente os diversos parâmetros que influenciam o desempenho do sensor e se apresentam diferentes estruturas de sensores onde foram estudadas a localização, propriedades óticas, forma e tamanho dos componentes metálicos, combinados com diferentes tipos de fibras, resultando no acoplamento entre os modos plasmónicos e os modos óticos. Também foi verificado que a escolha dos modos óticos utilizados na deteção em fibras multimodo pode apresentar vantagens. Foi investigado ainda o uso de materiais artificiais recentemente desenvolvidos, de que são exemplo os metamateriais, bem como, a inclusão de múltiplos fios metálicos na fibra, de forma a melhorar o desempenho dos sensores SPR. A um nível mais fundamental, foi demonstrado que o controlo do acoplamento entre os múltiplos modos plasmónicos gerados nos componentes metálicos e os modos óticos propagados na fibra constitui uma nova forma de melhorar o desempenho do sensor. Tal pode ser inclusivamente utilizado para desenvolver um novo tipo de sensores SPR capazes de medir simultaneamente duas variáveis, como por exemplo o índice de refração externo e a temperatura.
VI
Resumen
Esta tesis investiga cómo es posible mejorar el desempeño de los diseños actuales de sensores de fibra óptica basados en la Resonancia Plasmónica de Superficie (SPR) y permitir un mejor entendimiento de los principios físicos y sensores que luego permitirá proponer nuevos conceptos e ideas. Fue utilizada una metodología basada en simulaciones numéricas, ya que esta proporciona una mejor comprensión sobre el funcionamiento de estos sensores y porque permiten una manera simple y rápida de probar nuevos diseños y conceptos sin necesidad de fabricar los sensores. También fue verificado que estas simulaciones son una buena aproximación a los resultados experimentales.
Se adoptó un enfoque sistemático para investigar los diversos parámetros que influyen en el desempeño del sensor y se presentan diferentes diseños de sensores, donde estudiamos la localización, las propiedades ópticas, la forma y el tamaño de los componentes metálicos, combinados con diferentes tipos de fibras, resultando en el acoplamiento entre los modos plasmónicos y los modos ópticos. También se verifico que la elección de los modos ópticos utilizados en la detección en fibras multimodo ofrece otras ventajas. Fue investigado el uso de materiales artificiales recientemente desenvuelto, como son los metamateriales, así como la inclusión de múltiples hilos de metal en la fibra óptica para mejorar el rendimiento del sensor SPR. En un nivel más fundamental, se demuestra que el control del acoplamiento entre múltiples modos plasmónicos criados por la componente metálica y los modos ópticos en la fibra constituye es una nueva forma de mejorar el rendimiento del sensor. Esto incluso se puede utilizar para desarrollar un nuevo tipo de sensores basados en SPR capaces de medir simultáneamente dos variables, tales como el índice de refracción externa y la temperatura.
VII
Contents
Chapter 1 Introduction and motivation... 1
1.1 Motivation ... 2
1.2 Supporting Research collaborations ... 3
1.3 Structure of the thesis ... 3
Chapter 2 State of the art ... 5
2.1 What are Surface Plasmons ... 5
2.2 Optical Excitation of Surface Plasmon ... 6
2.3 Evaluation of the performance of the SPR sensors ... 7
2.4 SPR sensor classification ... 8
2.4.1 Optical configurations ... 10
2.4.2 Interrogation of the SPR sensor ... 10
2.4.3 Geometry design of the SPR fiber sensor ... 11
2.4.4 Plasmonic coating ... 16
2.4.5 Fiber Grating SPR sensor ... 16
2.4.6 Application of the SPR sensor ... 17
Chapter 3 Models and methodology ... 19
3.1 Maxwell’s equations ... 19
3.2 The Lorentz and the Drude models, and the optical properties of the gold, silver, aluminum and copper 21
3.2.1 The Lorentz model ... 21
3.2.2 The Drude model ... 22
3.2.3 The Sellmeier equation ... 23
3.2.4 Optical properties of gold, silver, aluminum and copper ... 24
3.3 Optical waveguide theory ... 26
3.3.1 Definitions and properties of guided modes ... 27
3.3.2 Poynting vector, total power and loss in the guided mode ... 27
Contents
VIII
3.3.4 The circular step-index waveguide ... 30
3.4 Surface plasmon resonance (SPR) ... 33
3.4.1 Theory of the surface plasmon polariton (SPP) ... 33
3.4.2 Planar waveguide in a metal and dielectric external interface... 34
3.4.3 Fiber optics sensors based on surface plasmon resonance ... 36
3.5 Finite element method (FEM) ... 37
Chapter 4 Singlemode sensors with thin metal films ... 41
4.1 SPR sensor based on conventional D-type fiber ... 42
4.1.1 Numerical mode analysis ... 42
4.1.2 Algorithm using Fresnel laws ... 47
4.2 Optimization of the microstructured D-type fiber sensor based in SPR ... 51
4.2.1 Triangular and parabolic SPR D-type fiber sensor ... 52
4.2.2 Microstructured D-type fibers: intensity of electric field and transmission coefficient .... 54
4.2.3 Microstructured D-type fibers: optimization of the parameters of the SPR ... 55
4.3 PCF D-type sensor based in SPR. ... 56
4.3.1 Introduction of photonic crystal fibers ... 56
4.3.2 Design of photonic crystal fibers ... 57
4.3.3 Loss of the conventional and PCF D-type fiber ... 58
4.3.4 Sensitivity and resolution of the two configurations ... 59
4.4 Proposals of PCF D-type sensors based in SPR. ... 59
4.4.1 Loss and distribution of the Poynting vector ... 60
4.5 Conclusion ... 64
Chapter 5 Multimode sensors with thin metal films ... 65
5.1 Introduction to multimode fibers ... 65
5.2 Multimode fiber sensor based in SPR ... 67
5.3 POF SPR sensor and effect of modal filtering ... 68
5.4 Numerical simulation without tapered POF filter ... 68
5.5 Experimental characterization of the POF SPR sensor ... 71
5.5.1 Experimental configuration without tapered POF filter ... 73
5.5.2 Configuration with tapered POF filter before the SPR sensor system ... 74
5.5.3 Configuration with tapered POF filter after the SPR sensor system ... 74
IX
Chapter 6 Sensors with metamaterials ... 79
6.1 SPR sensor based in metamaterials ... 80
6.2 Effective medium theory ... 81
6.3 Metamaterials formed by Alumina and Silver (Al2O3 – Ag) ... 82
6.4 Proposal SPR sensor based in a metamaterial ... 83
6.4.1 Metamaterial versus pure metal layers ... 84
6.4.2 Loss for different concentrations of Al2O3 and Ag ... 86
6.4.3 Loss for different thicknesses of the metamaterial ... 88
6.4.4 Optimization of the sensor ... 89
6.5 Conclusion ... 91
Chapter 7 ... 93
Singlemode sensors with wires ... 93
7.1 SPR sensor based in metal wire... 94
7.2 Singlemode fiber sensor based in SPR with a metal wire on a D-type fiber ... 94
7.2.1 Description of the isolated modes and the supermodes ... 95
7.2.2 Effects of the different parameters ... 97
7.2.3 Resolution, sensitivity and operation range ... 98
7.3 Conclusion ... 100
Chapter 8 Multimode sensors with wires ... 103
8.1 Optimization of modal sensitivity in nanowire SPR multimode sensor ... 104
8.1.1 Design parameters ... 104
8.1.2 SPR in the multimode fiber ... 105
8.2 Sensitivity of two modes in the SPR multimode fiber ... 106
8.3 Conclusion ... 108
Chapter 9 SPR sensor with wires for simultaneous measurement of refractive index and temperature 109
9.1 Introduction of the SPR sensor for measurement of temperature ... 110
9.2 Consideration of temperature in the calculation ... 111
9.2.1 Sellmeier equation with temperature variation ... 111
Contents
X
9.3 Plasmonic measurement of refractive index and temperature based on a D-type fiber sensor
with gold wires... 113
9.3.1 Study of sensor behavior as function of the external refractive index variation ... 114
9.3.2 Optimization of the sensor ... 118
9.3.3 Study of the sensor behavior as a function of temperature ... 120
9.4 Conclusion ... 122
Chapter 10 Conclusions and outlook ... 125
10.1 Sensors with thin materials films ... 126
10.2 Sensors with wires ... 127
10.3 Simultaneous measurement of refractive index and temperature ... 128
10.4 Outlook ... 128
XI Figure 2.1 Basic schemes for SPR sensors with (a) Otto configuration based coupling; (b)
Kretschmann configuration based coupling... 6 Figure 2.2 Basic scheme for SPR sensors with grating coupling. ... 6 Figure 2.3 Configuration of SPR sensor using an optical fiber where the fiber cladding is
removed (cladding-off fiber). ... 7 Figure 2.4 Attenuation of light due to SPR with angular modulation or wavelength
modulation [2]. ... 8 Figure 2.5 Classification of SPR fiber sensors. MMF: Multi Mode Fiber; SMF: Single Mode
Fiber; MOF: Microstructured Optical Fiber; PMF: Polarization Maintaining Fiber; FBG: Fiber Bragg Grating, LPG: Long Period Fiber Grating; TFBG: Tilted Fiber Bragg Grating; LSPR: Localized Surface Plasmon Resonance [23]. ... 9 Figure 2.6 SPR fiber-optic sensor with a side-polished configuration. ... 11 Figure 2.7 SPR fiber optic sensor with a D-shape or D-type fiber configuration. ... 12 Figure 2.8 Schematics of the SPR fiber-optic sensor design with (a) tapered fiber; (b)
hetero-core fiber; (c) U-shape fiber; d) H-shaper fiber. ... 12 Figure 2.9 Schematic of an optical fiber SPR sensor implemented on the tip of an optical
fiber with a mirror in the end. ... 13 Figure 2.10 SPR fiber optic sensors based in photonic crystal fibers with; (a) with circular
holes [55], (b) with crescent-shape holes, (c) MOF three structured holes (also called wagon wheel fiber) [12] and d) microcapillary fiber SPR sensor [56]... 14 Figure 2.11 Examples of grating SPR sensor (a) with a long period grating (LPG), (b) with a
tilted fiber Bragg grating TFBGs [1]... 17 Figure 3.1 Refractive index of the core (GeO2-SiO2) and of the cladding (SiO2). ... 24
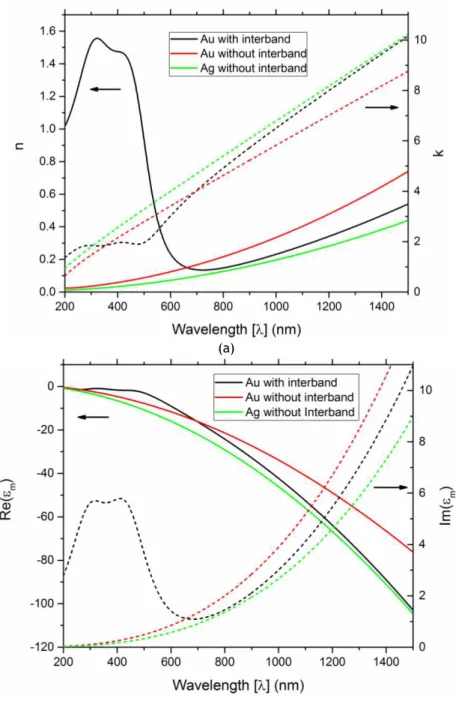
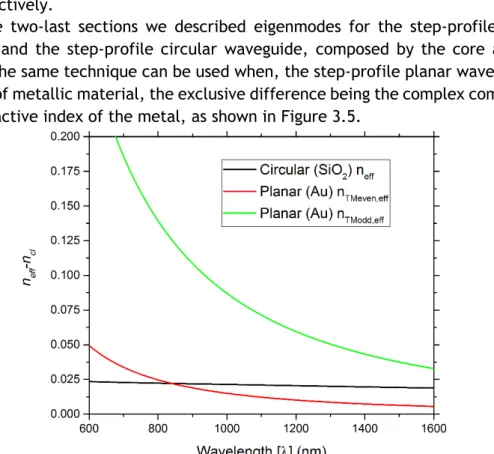
Figure 3.2 (a) Refractive index and (b) permittivity of gold (Au) and silver (Ag). The solid lines are the real part of the refractive index and permittivity, the dashed lines are the imaginary part of the refractive index and permittivity, respectively. The black and red lines refer to the gold with and without interband, respectively, and the green line refers to silver. ... 26 Figure 3.3 Schematic of the planar step-index waveguide. ... 28 Figure 3.4 Schematic of the fiber step-index waveguide. ... 31 Figure 3.5 Numerical solution of the eigenvalue equation in a step-profile planar composed
of gold (Au) and step fiber circular composed of the core (GeO2-SiO2) and the cladding
(SiO2). ... 33 Figure 3.6 Surface plasmon is propagated along the interface between the metal and the
dielectric, where εm is the permittivity of the metal, εd is the permittivity of the
dielectric and the penetration field in each element is given as δd and δm, for the
dielectric and metal, respectively. (a) Lines of the electric field and (b) distribution of electric, Ex and magnetic, Hy, fields, respectively [1]. ... 34
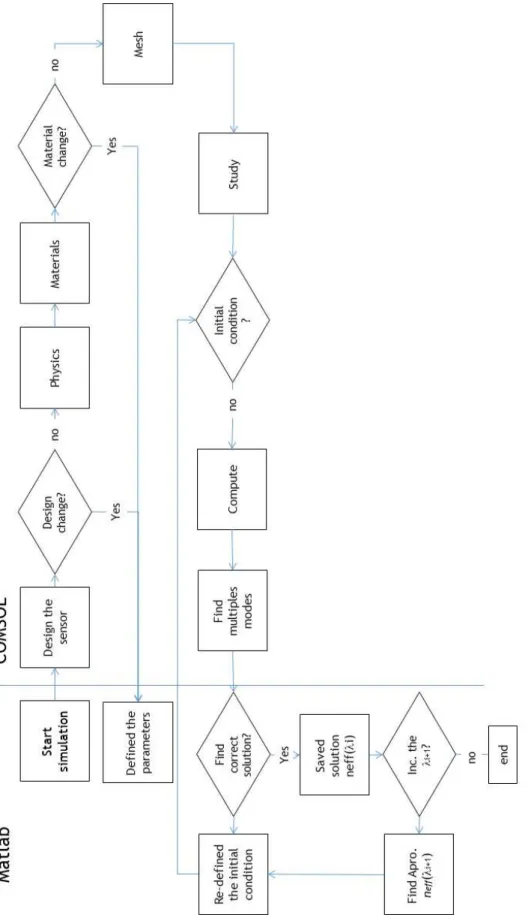
Figure 3.7 Basic scheme of computational simulations used in this work. ... 39 Figure 4.1 Schematic of the SPR D-type sensor. The fiber is composed by two refractive
indexes (core - nco and cladding - ncl) then a metallic layer is deposited with thickness
dm and refractive index nm, at a distance d of the center of the fiber, for the
measurement of the external refractive index next. ... 42
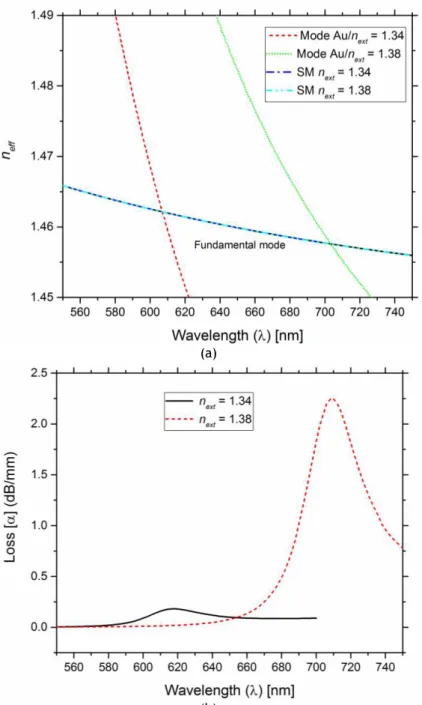
Figure 4.2 Structure of the finite elements in COMSOL for a D-type optical fiber with a metallic layer for SPR. The elements are smaller in the metallic layer and in the core. ... 43 Figure 4.3 (a) Refractive index as function of the wavelength of the modes when considering
insolated waveguides for the fundamental mode fiber type D (solid black) and for the plasmonic mode in the interface Au and next = 1.34 and next = 1.38 (dashed red). The
found SMs are represented in dot-dashed blue and dot-two-dashed, respectively. (b) Attenuation in function of the wavelength for the SMs with different external refractive indexes. The thickness of the gold is dm = 45 nm. ... 45
List of
FiguresXII
blue lines indicate the transverse electric field ex and ey. (a) No resonance = 500
nm. (b) Resonance = 630 nm. ... 46 Figure 4.5 Normalized Poynting vector amplitude along a cutline across the fiber core for
different values of the wavelength, with the thickness of metal dm = 45 nm and
external refractive index next = 1.34. ... 46
Figure 4.6 Transmission (T) as a function of wavelength for a SPR D-type fiber by two methods: The Fresnel method (solid line) and using the FEM method (dash line) with different thicknesses of the gold (Au), d = 4.0 µm, next = 1.392 and = 88.85º. ... 48
Figure 4.7 Simulation of the transmission coefficient of the sensor, for different distances between the center of the core and the metal (d). In this simulation, the thickness of the gold layer is 65 nm and the refractive index of the external environment is 1.392. ... 48 Figure 4.8 Transmission as function of wavelength for two values of external refractive
index, where d = 4.0 µm and dm = 65 nm... 49
Figure 4.9 Simulation of the transmission coefficient T of the sensor for different thicknesses of the dielectric (Ta2O5). The thickness of gold is 65 nm and next = 1.329 .. 50
Figure 4.10 Transmission coefficient T of the sensor with different dielectric (Ta2O5)
thickness dov = 20 nm. The thickness of gold is 65 nm. ... 50
Figure 4.11 D-type optical fiber (a) holes in a triangular configuration and (b) holes in a parabolic configuration. ... 52 Figure 4.12 (a) Intensity of the electric field Ezin 2D (V/μm) with λ = 300 nm, dm = 65 nm
and next = 1.37. (b) and (c) Zoom of the core of the intensity of the electric field Ez in 2D (V/μm) with: (b) λ = 300 nm, no SPR present and (c) λ = 660 nm, with SPR... 53 Figure 4.13 (a) Intensity of the electric field 𝑬𝒛 in 1D (V/μm) as function of the longitudinal
fiber x at λ = 630 nm. (b) Attenuation as a function of wavelength for different external refractive indexes (next), for three configurations of the SPR sensor,
convectional (solid line), parabolic (dashed line) and triangular (dot line), where the dm = 45 nm and d = 4.5 µm. ... 54
Figure 4.14 Attenuation as a function of wavelength for different thicknesses of gold (Au) and for three configurations of the SPR sensor, conventional (solid line), parabolic (dashed line) and triangular (dot line) where next = 1.38 and d = 4.5µm. ... 55
Figure 4.15 Simulation of attenuation as function of the wavelength, for different values of residual cladding, d. In this simulation, only two configurations of the SPR sensor were studied, conventional (solid line) and parabolic (dashed line) where dm = 45 nm
and next = 1.38. ... 56
Figure 4.16 Schematic of the PCF D-type. ... 58 Figure 4.17 Attenuation as a function of wavelength for different external refractive
indexes for the conventional (solid line) and PCF (dashed line) D-type. L = 1 mm and dm = 45 nm. ... 58
Figure 4.18 Design of the enhanced proposal for the PCF D-type sensor based in SPR. ... 60 Figure 4.19 Attenuation as a function of wavelength for D-type and enhanced D-type fibers.
The configurations had the following parameters: L = 1 mm, next = 1.39 and dm = 45
nm. ... 60 Figure 4.20 Normalized Poynting vector distributions, overlayered by an arrow indicating
the transverse electric field ex and ey, for the different wavelengths, indicated in
Figure 4.19. The upper images are for the conventional D-type fiber and lower images are for the enhanced PCF D-type. ... 61 Figure 4.21 Normalized Poynting vector amplitude along a cutline across the fiber core for
the different wavelengths indicated in Figure 4.19 for the enhanced PCF D-type fiber. ... 62 Figure 4.22 Attenuation as a function of wavelength for different refractive indexes of
external medium for both configurations. The configurations had the following
parameters: d = 4.05 μm and d = 3.2 μm for conventional (solid lines) and enhanced
PCF D-type (dashed lines), respectively, L = 1 mm and dm = 45 nm. ... 62
Figure 5.1 Section view of the sensor system based on SPR in POF. ... 68 Figure 5.2 Numerical results for two modes LP02 (mode 56) and LP04 (mode 16) in POF. (a)
POF without the cut, (b) POF with cut and gold layer. ... 69 Figure 5.3 (a) Attenuation as function of the wavelength for different modes when the RI
XIII Figure 5.4 Attenuation as function of wavelength for different values of the external
refractive index of the sensor for: (a) mode 16 (dashed line) and mode 56 (solid line), (b) magnification of the mode 56 behavior. ... 71 Figure 5.5 Experimental configuration of the sensor system with tapered POF filter at the
input of the sensor system ... 72 Figure 5.6 Experimental configuration of the sensor system with tapered POF filter at the
output of the sensor system. ... 73 Figure 5.7 Experimentally obtained SPR transmission spectra, normalized to the air
spectrum, for different RI of the aqueous medium. Configuration without tapered POF filter. ... 73 Figure 5.8 Experimentally obtained SPR transmission spectra, normalized to the air
spectrum, for different RIs of the aqueous medium. Configuration with tapered POF filter at the input of the SPR sensor. ... 74 Figure 5.9 Experimentally obtained SPR transmission spectra, normalized to the air
spectrum, for different RIs of the aqueous medium. Configuration with tapered POF filter at the output of the SPR sensor. ... 75 Figure 6.1 Scanning electron microscopy (SEM) images of the fabricated metamaterial: (a)
cross section and (b) top view. Bright and dark spots correspond to Ag-filled and empty pores, respectively [99]. ... 80 Figure 6.2 Complex dielectric (a) real part and (b) imaginary part of the metamaterial for
concentrations of Ag of 100% (solid curve, corresponding to pure silver), 90% (dashed curve), 80% (dotted curve) and 70% (dash-dotted curve) 60% (dash-double dotted curve) and 50% % (small dashed curve). The equivalent curve for alumina (Al2O3) is
also presented for reference (small dotted curve). ... 83 Figure 6.3 From left to right up: three dimensional representation of a section of the fiber
sensor, transverse cross-section of the fiber sensor. From right to left down: detail of the structure of the surface of the sensor indicating the position metamaterial film and a scheme of the thin metal-dielectric layers that compose the metamaterial. ... 84 Figure 6.4 (a) Attenuation as function of wavelength for different values of the external
refractive index, with two different layers, one with only Ag and the other with metamaterial with a concentration of 80% Ag and 20% Al2O3. (b) Distribution of the
light in the region of the center of the fiber and the metal/metamaterial film for two concentrations of Ag (100% and 80%) and with 1.34 RI. ... 85 Figure 6.5 (a) Attenuation as function of wavelength for different metamaterial filling
ratios for the PCF D-type configuration with next = 1.30 RIU. (b) Distribution of light in
the region of the center of the fiber and the metamaterial film for two concentrations of Ag (75% and 65%). ... 87 Figure 6.6 Attenuation as function of wavelength for different thicknesses of the
metamaterial PCF D-type configuration fiber with next = 1.32 RIU and Ag = 90%. ... 89
Figure 6.7 Attenuation peak as function of the relative concentration and thickness of the metamaterial with next = 1.30 RIU. ... 90
Figure 6.8 The wavelength peak of the attenuation as function of the relative concentration and thickness of the metamaterial for next = 1.30 RIU. ... 91
Figure 7.1 Schematic of the SPR D-type fiber with a gold wire configuration, with the inset of zoom of the core and metal wire. ... 95 Figure 7.2 (a) Real and imaginary part of the refractive index of the sensor as function of
wavelength for external refractive index of 1.38. (b) Detailed distribution of the light intensity in the metal wire for the plasmon modes of the wire (top) and the resulting modes after hybridization with the fundamental mode of the fiber (bottom)... 96 Figure 7.3 Attenuation curves as a function of wavelength for different distances between
the center of the metal with the center of the fiber core (a) and for different radius of the metal (b). In the inset of Figure 7.3a, it is also shown the intensity of the electric field distribution along a cutplane of the sensor, corresponding to the supermodes of the two peaks (SM2 and SM1). ... 98 Figure 7.4 Comparison between the attenuation curves as function of wavelength for two
List of
FiguresXIV
Figure 8.2 Attenuation as a function of wavelength for different modes. The distribution of light intensity for each different mode is also presented. ... 105 Figure 8.3 Attenuation as function of wavelength for different values of the external
refractive index for: (a) the fundamental mode (solid line) and the MP,3,5. (dashed
line), (b) magnification of the fundamental mode behavior. (c) The distribution of light intensity for the MP,3,5 mode and the fundamental mode. ... 107
Figure 9.1 Schematic of the proposed SPR D-type fiber. ... 114 Figure 9.2 (a) Real part (solid line) and imaginary part (dot line) of the refractive index of
the sensor as a function of wavelength for external refractive index of 1.38. Also, we represent the dispersion curves of the metal wires for the external modes, mE (dashed
line) and for the internal modes, mI (dashed-dot line). The crossings between the
dispersion curves of the modes in the metal wires and the fundamental mode of the fiber are indicated by square and triangle dots created by the external wire (RI) and the internal wires (T), respectively and these points are represented by the circular green circles in the imaginary part of the effective refractive index of the sensor (green dot line). (b) Distribution of light intensity in the sensor in the referred points. (c) Detail of the distribution of light intensity near the external and the left internal wire in Figure 9.2b. ... 116 Figure 9.3 Attenuation as function of wavelength for different values of external refractive
index with four metallic wires, for d = 2 µm. The range of external refractive index is from 1.30 to 1.38. In the curve for next=1.38, the two peaks with higher wavelengths
are partially overlapped, which makes at extremely difficult to measure the central wavelength for the weaker peak, and therefore limits the range of operation of the sensor. ... 117 Figure 9.4 Attenuation as a function of wavelength for different values of external
refractive index D-type for d = 2 µm, (a) dI = 3 µm (the distance between the internal
wires and the core) and rI = 500 nm (radius of the internal wires) and for (b) dI = 4 µm
and rI = 550 nm. The external refractive index varies from 1.30 to 1.38. ... 119
Figure 9.5 Attenuation as a function of wavelength for different values of temperature sensor D-type. The external refractive index is 1.34 RIU. The configuration is d = 2.5 µm, dI = 4 µm, rE = 300 nm (the radius of the external wire) and rI = 500 nm (the radius
XV
List of Tables
Table 2.1 Characteristics of general SPR-based fiber-optic sensors [1]. ... 15
Table 3.1 Sellmeier coefficients for germanium, silica, alumina and PMMA ... 23
Table 3.2 Plasma and collision wavelengths used for different metals [71]. ... 24
Table 3.3 Coefficients for gold from reference [91]. ... 25
Table 3.4 Modal field components for step-profile planar waveguide for the modes TE, where
X
x
/
is the normalized radial distances and the ex ez hy 0[93]. .... 29Table 3.5 Modal field components for step-profile planar waveguide for the modes TM, where the
X
x
/
is the normalized radial distances and the ey hz hx 0 [93]. ... 30Table 4.1 Sensitivity, resolution, wavelength operation range values for the refractive index SPR optical fiber sensor based on conventional D-type fiber and with an overlayer of the Ta2O5 with thickness of the 20 nm. ... 51
Table 4.2 Sensitivity and resolution values for the refractive index optical fiber sensors based on conventional and on the PCF D-type fiber configurations. ... 59
Table 4.3 Sensitivity values for the refractive index optical fiber sensors based on conventional D-type fiber and on the enhanced PCF D-type sensor ... 63
Table 5.1 Sensitivity, resolution and range of the wavelength for the POF D-type of the mode 16. ... 76
Table 6.1 Sensitivity, resolution and range of the wavelength values for the refractive index optical fiber sensors based on two materials (Ag and metamaterial). ... 86
Table 6.2 Information about the loss peak (αpeak), wavelength (λ), 3dB/mm the variation of the loss ( ) low and high wavelength with variation of loss 3dB (λL and λH, respectively) information about narrow of the sensor, extracted from Figure 6.5 ... 88
Table 7.1 Sensitivity, resolution and range of the wavelength values for the refractive index optical fiber sensors based on two forms of metal inclusions (film with 45 nm of thickness and wire with 300 nm of radius). ... 100
Table 8.1 Sensitivity, resolution and wavelength range for the fundamental and MP,3,5 modes ... 108
Table 9.1 Values of the Lorentz-Drude Model parameters in electron volts [87]. ... 112
Table 9.2 Sensitivity, resolution and range of the wavelength values for the refractive index optical fiber sensors. ... 118
XVII
Publications in Refereed Journals and
Conferences
Journals
1 D. Santos, A. Guerreiro and J. M. Baptista, “SPR Microstructured D-Type Optical
Fiber Sensor Configuration for Refractive Index Measurement”, IEEE Sensors
Journal, 5472 – 5477, 15 (2015). DOI: 10.1109/JSEN.2015.2442335
2 N. Cennamo, L. Coelho, D. F. Santos, J. M. Baptista, A. Guerreiro, P. A. S. Jorge
and L. Zeni, “Modal Filtering for Optimized Surface Plasmon Resonance Sensing in Multimode Plastic Optical Fibers”, IEEE Sensors Journal, 6306-6312, 15 (2015). DOI: 10.1109/JSEN.2015.2450991
3 D. Santos, A. Guerreiro and J. M. Baptista. “SPR optimization using metamaterials in a D-type PCF refractive index sensor”, Optical Fiber Technology, 83-88, 33 (2017) DOI: 10.1016/j.yofte.2016.11.010.
4 D. Santos, A. Guerreiro and J. M. Baptista. “Surface plasmon resonance sensor based on D-type fiber with a gold wire”, Optik - International Journal for Light and Electron Optics, 244-249, 139 (2017) DOI: 10.1016/j.ijleo.2017.03.035. 5 D. Santos, A. Guerreiro and J. M. Baptista. “Simultaneous plasmonic measurement
of refractive index and temperature based on a D-type fiber sensor with gold
wires”, IEEE Sensors Journal, 2439-2446, 17 (2017) DOI:
10.1109/JSEN.2017.2674522.
Conference Proceedings
1 D. Santos, A. Guerreiro and J. M. Baptista, “Performance analysis simulation of new SPR microstructured D-type optical fiber sensor configurations for refractive
index measurement”, 23rd International Conference on Optical Fibre Sensors, 1-4,
91579O (2014).
2 D. Santos, A. Guerreiro and J. M. Baptista, “New SPR PCF D-type optical fiber
sensor configuration for refractive index”, 24th International Conference on
Publications in Refereed Journals and Conferences
XVIII
3 D. Santos, A. Guerreiro and J. M. Baptista, “Optimization of modal sensitivity in
nanowire SPR multimode sensor”, 25th International Conference on Optical Fibre
Sensors, accepted (2017).
4 D. Santos, A. Guerreiro and J. M. Baptista, “SPR based PCF D-type sensor based
on a metamaterial composed of planar metals for refractive index sensing”, 6th
1
Chapter 1
Introduction and motivation
Sensors are a technology component that play a critical role in the modern world in improving the quality of life, either as part of information and monitoring systems or integrated in different types of devices. They are found in applications ranging from infrastructure and industrial monitoring to environmental control, among others. Indeed they can be found measuring many distinct parameters, from pH, temperature, humidity, pressure and voltage, to refractive index, carbon dioxide (CO2)
concentration and many other physical, chemical and biological parameters. The use of sensors is today generalized, and they play a crucial role in obtaining relevant information.
In particular, fiber optic sensors have the advantage of allowing their integration in vast numbers in the existing network of optical fibers, an infrastructure that covers almost the entire world. Due to their intrinsic characteristics, a single optical fiber can support a high number of sensors, operating remotely and having immunity to electromagnetic and radiofrequency interference [1]. In addition to some external refractive index detection fiber optic systems already available commercially, there has been considerable scientific interest in the technology of surface plasmon resonance (SPR), sensors associated with photonic crystal fiber (PCF), nanoscale structures and metamaterials. This new type of sensors, based on micro-layers of material deposited on nano- and micro-structured fibers, have been attracting the attention of researchers [2].
The operation of surface plasmon resonance sensors as bio sensing has been demonstrated by Liedberg et al. [3] in 1983. In his study, the authors used a practical and commonly used method to excite surface plasma, which was originally suggested by Kretschmann in 1971. It is a method in which light propagates through a prism in the configuration of attenuated total reflection (ATR), depositing a metal film by evaporation at the base of this prism [4].
In 1993, Jorgenson and Yee [5] constructed the first fiber-based SPR sensor. This work demonstrated that the optical fiber can replace the prism, in the configuration of Kretschmann, allowing also generate the resonance of surface plasmons. The fiber used was chemically treated to remove almost the entire sheath and thereby increased the sensitivity of the sensor. This type of fiber optic sensor based on SPR is able to present a very high sensitivity to the refractive index, a short response time and still have all the advantages of using optical fiber [6].
Introduction and motivation
2
coatings, the excitation techniques, the detection or interrogation method and the application.
The performance enhancement of SPR sensors is focused on improving the operating wavelength range, refractive index detection range, sensitivity, and resolution, to obtain the best configuration SPR sensor for a given application. Due to the different types of SPR sensors, their actual construction and testing is very expensive and time consuming, making simulation programs important tools to obtain a first and fast approximation of the behavior of the final sensor. These tools should allow analyzing parameters such as: the intensity of the electric and magnetic field, the effective index of refraction, among others, permitting to innovate SPR sensors and understand phenomena not previously observed.
There are several difficulties to develop a good simulation program, including those found when writing the code for 2D and 3D designs [1]. When the structure of the sensor is too complex, the calculations become rather elaborate, being necessary to use more simplified numerical analysis methods such as: the expansion and propagation method (MEP) [7], the method for multilayer structure transfer matrix modeling [8], the optical fiber multilayer cylindrical structure [9] and the rigorous couple wave analysis (RCWA) [10]. However, these methods have some limitations in analyzing structures with nanostructured irregularities [11]. The finite-difference time domain (FDTD) method and the finite element method (FEM) allow calculate the electric and magnetic fields in these structures, but require high computational memory capacities [12]. Therefore, it is a challenge to work with this type of structures.
1.1
Motivation
One of the main reasons for this thesis was the need to have tools to simulate the behavior of SPR fiber sensors for the measurement of external refractive index. Due to the different types of optical fibers and sensor configurations associated with SPR, their actual construction and testing is very expensive and time consuming, making simulation programs important tools to obtain a first and fast approximation of the behavior of the final sensor. With such a tool, it is possible to solve problems that arise during the study and at the same time optimize the project to be carried out. The possibility of having a single tool to simulate the performance of fiber optic sensors was the objective in this thesis in the field of optical fiber sensors based on SPR.
The work of this thesis is therefore motivated by the following questions:
• Is this simulation approach effective in modelling different SPR D-Type fiber configurations?
• How do the results of the simulations compare with the experimental data? • How can we engineer the interactions between light and plasmons to
improve sensing performance?
• What kind of microstructures and new materials can be incorporated in the sensors to help boost sensing performance?
3 The main objective of this thesis is the numerical simulation analysis of new SPR sensor configurations using the same simulation tool, focusing on the optimization of different parameters in SPR sensors (see chapter 4-9). Therefore, we compare the numerical results with experimental results (see chapter 5). We study the effect of replacing a conventional film metal with a metamaterial (see chapter 6). We proposed an SPR sensor based in wires where a single and multimode fibers are used (see chapters 7-8). And finally, we propose and analyze an SPR sensor configuration for the simultaneous measurement of the external refractive index and the temperature (see chapter 9).
1.2
Supporting Research collaborations
The realization of this Ph.D. thesis included periods as visiting researcher and collaborations with several institutions: University of Porto, Portugal, Institute for Photonic Technology, in Jena, Germany, Second University of Naples, Italy, and the host institutions, the Institute for Systems and Computer Engineering, Technology and Science (INESC-TEC former INESCPorto) and the University of Madeira. Each of these periods had a direct impact in one or more chapters of this thesis, as well as, the publication of different scientific articles.
In particular, the period between the 2nd and 3rd year was spent at the Institute for
Photonic Technology (IPHT), under the local supervision of Dr. Kay Schuster and Prof. Markus A. Schmidt, investigating the interaction between light, plasmonic and high refractive index microstructures in optical fibers.
Another collaboration included Prof. Dr. Luigi Zeni, Dr. Nunzio Cennamo (from the University of Naples), and Dr. Pedro Jorge and Dr. Luis Coelho (from INESC-TEC), and resulted in a study of multimode optical fiber sensor, discussed in chapter 5.
1.3
Structure of the thesis
This thesis is organized in ten chapters, including this introduction. In the second chapter a definition of SPR is presented, a current state of the art of the SPR sensor configurations found in literature and how the SPR sensors can be classified. In addition, we described the characteristics of an SPR sensor, completed in chapter three. In the third chapter, we describe Maxwell’s equations and the wave equation to study the behavior of the electromagnetic wave (light) inside the optical fiber. We also study the optical properties of the materials used in this thesis and we analyze guided modes in planar and cylindrical structures.
Chapter 4 presents the conventional SPR D-type fiber sensor and we analyze the behavior of the different SPR sensor parameters. We also analyze and compare the SPR sensor based on a conventional D-type fiber and on a D-type photonics crystal fiber. From this chapter resulted two publications, one in a journal (1) and another one in a conference (1).
Introduction and motivation
4
In Chapter 6 we address an SPR D-type PCF with a metamaterial and we propose a method to manufacture a SPR fiber sensor with a metamaterial with specific characteristics. Two publications resulted from this chapter, one in a journal (3) and another one in a conference (2).
In Chapter 7 and 8 we study a SPR D-type with two different types of fiber, singlemode and multimode, respectively, where we study the effects of the multiple modes that propagate in the fiber and in the metal. From this chapter resulted three publications, one in journal (Erro! A origem da referência não foi encontrada.) and another two in conferences (3 and 4).
Chapter 9 proposes a sensor with simultaneous measurement of the refractive index and temperature. Another journal paper was published (4).
5
Chapter 2
State of the art
The phenomenon of surface plasmon resonance (SPR) has been studied since the beginning of the 20th century, and since then the basic principles of operation of SPR
have become well known. The quantity of work in literature about SPR sensors is so large that any review is necessarily incomplete, therefore, in this chapter we shall focus on the main results relevant to the central problem of this dissertation.
In this chapter, we explore the nature of surface plasmons and the different ways to excite optically surface plasmons, starting with the prism configurations by Otto and Kretschmann, and then moving into other configurations in different types of optical fibers, such as cladding-off fiber, D-type fiber, microstructured fiber, plastic optical fiber, among others. We also describe how SPR sensors are classified and characterized. The large quantities of configurations found in literature justify the need to have a simulation tool that is able to completely understand, optimize and choose the more appropriated SPR sensor.
2.1
What are Surface Plasmons
State of the art
6
2.2
Optical Excitation of Surface Plasmon
A light wave can couple to a surface plasmon at a metal-dielectric interface if the
component of light’s waveguide is parallel to the interface and matches the
propagation constant of the surface plasmon. The most common couplers used in SPR sensors include a prism coupler, a grating coupler , and a waveguide coupler, as shown in Figure 2.1a, Figure 2.1b and Figure 2.2, respectively [13].
The phenomena of surface plasmon resonance has been studied since the beginning of the 20th century, although the greatest progress on SPR was achieved in the late 60s
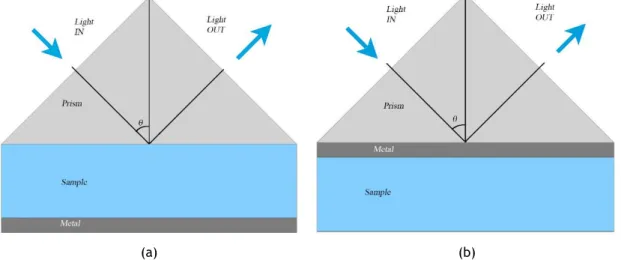
with the development of bulk configurations [14], [15]. The first two bulk configurations are the Otto [14], (dielectric-metal interface) and the Kretschmann [15] (metal-dielectric interface), as shown in Figure 2.1a and Figure 2.1b, respectively. The first SPR sensor based on a light prism was developed in 1983 by Liedberg et al.
[3]. Another SPR configuration based on a prism uses a corrugated interface to form a grating coupler, as shown in Figure 2.2 [16]. Nowadays SPR sensors are the most sensitive optical refractometric configurations.
(a) (b)
Figure 2.1 Basic schemes for SPR sensors with (a) Otto configuration based coupling; (b) Kretschmann configuration based coupling.
7
Figure 2.3 Configuration of SPR sensor using an optical fiber where the fiber cladding is removed (cladding-off fiber).
Optical fiber sensors are also a very interesting solution for environmental monitoring, due to their intrinsic characteristics such as high sensor count multiplexing, remote sensing, miniaturization capability and immunity to electromagnetic and radiofrequency interferences [1]. The first configuration of a SPR sensor in an optical fiber was first proposed in 1990 [17], but only Jorgenson and Yee in 1993 [5] fabricated the first optical fiber SPR sensor. In this work, SPR in an optical fiber was generated by removing the fiber cladding (cladding-off fiber), where a metal layer was deposited, allowing the excitation of the SPR, as shown in Figure 2.3.
2.3
Evaluation of the performance of the SPR sensors
State of the art
8
Figure 2.4 Attenuation of light due to SPR with angular modulation or wavelength modulation [2].
The variation of the 𝛿𝑛 can be observed trough the reflection (Figure 2.4), loss [20] or transmission. For example, Jorgenson and Yee [5] measured the variation of the transmission when some important parameters were changed (film thickness, film refractive index, external refractive index, waveguide refractive index). The sensitivity of an SPR sensor is defined as the ratio between the change in sensor output and the change in the quantity to be measured. Homola in [21] calculated the sensitivity of a SPR sensor using perturbation theory. This theory consists in studying the relation between the change in the propagation constant of the surface plasmon (SP) and the refractive index. In other work, the author uses another interrogation technique based on the optical excitation and interrogation of a surface plasmon, which consisted in the analysis of the state of polarization of the reflected wave in presence of the excited plasmon [22].
The resolution of a refractive index SPR sensor defines the smallest variation in the refractive index which produces a variation in the sensor output. This parameter of performance is related to the limit of detection and the intensity noise [19].
The sensitivity and the resolution of an SPR sensor is dependent on three parameters, according to Homola: the variation of the refractive index of the external medium; the method of excitation of the SPR and the modulation approach used in the SPR sensor.
2.4
SPR sensor classification
9
Figure 2.5 Classification of SPR fiber sensors. MMF: Multi Mode Fiber; SMF: Single Mode Fiber; MOF: Microstructured Optical Fiber; PMF: Polarization Maintaining Fiber; FBG: Fiber Bragg Grating, LPG: Long
State of the art
10
2.4.1
Optical configurations
SPR sensors can be categorized by the type of optics (prism or fiber). The two first configurations of SPR prims sensors are based in the Otto [14] and Kretschmann [15] configurations. The appearance of the optical fiber permitted another method of propagation of the light, and at the same time the possibility of the creation of another kind of SPR sensor. The optical fiber can be: multimode fiber (MMF), singlemode fiber (SMF), microstructured optical fiber (MOF), polarization maintaining fiber (PMF), or multiple-core fiber.
The first SPR fiber sensor was made using a multimode fiber in which a part of the fiber was removed and then was placed the metal [5]. This configuration is one of the most common type used for SPR fiber sensors, due to the abundance and relative simplicity of sensor fabrication. The problem with this configuration is the large number of modes that propagate in the fiber, producing a lot of resonance modes and a lot of signal noise in the sensor, resulting in a decreased sensor performance. The use of a singlemode fiber is the solution for the problem of multiple modes that propagate in the fiber but, when part of the fiber is removed to place the metal, the SPR fiber sensor becomes extremely fragile.
The microstructured optical fiber (MOF) is another recent possibility in the creation of a SPR fiber sensor. The MOF D-type or D-shape is a simple sensor configuration used for fabrication of a SPR sensor [24]–[26]. Theoretically MOF SPR sensors are constructed with a different size, structure of the metal, localization of the metal, among other differences, when compared with SPR fiber sensors based on conventional optical fibers [27]–[29].
2.4.2
Interrogation of the SPR sensor
Although the sensing principle of SPR sensors is simple, several interrogation approaches have been applied in these sensors. Today SPR sensors can be classified based on the type of sensor interrogation:
SPR sensor with angular modulation: in this case the measurement is obtained by
analyzing the angles of coupling incident light as function of the excitation of the surface plasmon. The angle of incident light that produces the strongest coupling is used as a sensor output [30], [31]. In this type of interrogation, the optimization of the sensing parameter is obtained by using the Fresnel’s formulas and multiple -reflectance theory.
SPR sensor with wavelength modulation: for this type of classification many wavelengths are used to excite the surface plasmon and normally is measured the wavelength with the strongest coupling and used as a sensor output. In this case the angle of incident is the same and only the wavelength is changed [32]. This kind of modulation also permits multiplexing on wavelength using different materials or different sizes to change the resonance of the plasmon [33].
The most used sensors based in SPR are based on angular or on wavelength modulation [28], [34], [35].
SPR sensor with intensity modulation: in this case the wavelength and the angle
11 light interaction with the surface plasmon. The loss intensity is used as a sensor output [36]. The advantages of this configuration is its simplicity and low cost, but it is necessary the complete control the wavelength resonance of the sensor which, is controlled by the materials that constitute the sensor [23]. Moreover, this interrogation scheme requires intensity referencing.
SPR sensor with phase modulation: in this case is used the phase of the light wave
as the sensor output, being observed the interaction of the light with the surface plasmon as function of the light phase modulation [37]. The SPR sensor based in phase modulation has better resolution, but there are some difficulties to build high precision and real-time wave front phase detection [38], [39].
SPR sensor with polarization modulation: changes in the polarization of the light
wave interacting with a surface plasmon are measured [40].
Finally, it is possible to combing two types of modulation, for example, phase modulation and polarization modulation, as proposed by Xiangliang in [41].
In this thesis, we considered SPR sensors with wavelength modulation because is relatively easy to interrogate, presents a good sensitivity and resolution, and does not require referencing [1].
2.4.3
Geometry design of the SPR fiber sensor
The geometry design of the SPR fiber sensor can be classified in three ways, depending on the localization of the metal with respect of the fiber:
Side fiber SPR sensor: In this case, the localization of the metal is on one side of the fiber. The metal cladding-off fiber (also denominated unclad fiber) was the first configuration to be studied for SPR sensors in an optical fiber, as shown in Figure 2.3 [5]. This configuration has been very studied with a good sensitivity when using MMFs, but with the noise problem. The metal cladding-off using SMF has a good sensitivity with low noise since only one mode is studied, but the fragility of the SPR sensor is increased. To solve this problem another configuration was proposed. In 1994 Bender
et al. [42] demonstrated another configuration, the side-polished fiber. This sensing configuration is formed by an optical fiber where the cladding is polished, only on one face, where the metal is deposited. In this case the fiber is bent, as shown in Figure 2.6. This type of configuration demonstrated the same sensitivity, being more robust in comparison with the cladding-off SMF [43].
Figure 2.6 SPR fiber-optic sensor with a side-polished configuration.
State of the art
12
combination with SPR technology, the sensitivity of the external refractive index is obtained using the wavelength [45], intensity [46] or phase variations [47] and with better results. This configuration is very used in the literature because of the robustness and availability of the fiber and can use other types of fiber, films, or metal configurations, like multimode plastic fiber [48], microstructured fiber [12], metamaterial films and metallic wires studied in this thesis.
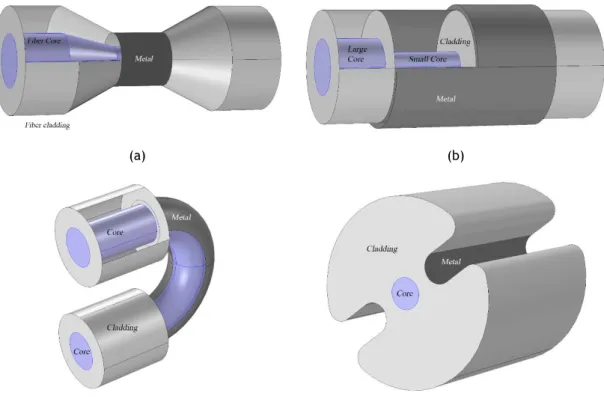
Figure 2.8 shows different schematics of the SPR fiber optic sensor design. In 1997 Tubb et al. [49] used other configuration, a tapered fiber, as shown in Figure 2.8a. This type of configuration is able to generate multiple SPR wavelength peaks [50]. The SPR tapered fiber can reach high sensitivity (11800 nm/RIU) when combined with a
Figure 2.7 SPR fiber optic sensor with a D-shape or D-type fiber configuration.
(a) (b)
(c) (d)
13 high dielectric overlay like Indium Nitride [51], but again with the cost of an increased fragility of the SPR sensor.
There are more fiber configurations of the SPR sensor based in optical fibers: Hetero-core fiber, that consists in two fibers with different sizes of the cores (one large and one small). The main characteristic of this sensor is that the modes leak into the cladding layer and then the SPR occurs between the metal and the external medium. This can be used for the measurement of the variation of the refractive external medium (Figure 2.8b) [52]. U-shape fiber, like in the previous designs, the aim is to allow the modes to propagate in the cladding through the bend of the fiber, and replacing the cladding by the metal layer we can create SPR (Figure 2.8c) [34]. H-shape fiber design is a fiber where the cladding is partial removed, and replaced by a metal film, resulting in a fiber with the form of an “H”, as shown in Figure 2.8d. In this fiber the modes that propagate in the core can couple into the plasmonic mode, similar to a D-type fiber [53].
Fiber tip SPR sensor: in this case the localization of the metal is at the end of the fiber. The schematic of the sensor is shown in Figure 2.9, and consists in an optical fiber where the end of the cladding is removed and then a thin film is deposited in the side of fiber. Finally in the tip of the fiber is deposited a mirror that reflects the wave and then interrogation is performed through analyzing light back-reflected from the mirrored fiber tip. The characteristics of the sensor are similar to the unclad sensor, but increase dips, because the wave travels two times in the metal [54].
Figure 2.9 Schematic of an optical fiber SPR sensor implemented on the tip of an optical fiber with a mirror in the end.
State of the art
14
can be used both in communication and sensing systems. Some of the designs of SPR sensors found in literature are: MOF with crescent-shape holes, PCF with circular holes [55], MOF with three structured holes (also called wagon wheel fiber) [12] and microcapillary fiber SPR sensors [56], as shown in Figure 2.10.
(a) (b)
(c) (d)
Figure 2.10 SPR fiber optic sensors based in photonic crystal fibers with; (a) with circular holes [55], (b) with crescent-shape holes, (c) MOF three structured holes (also called wagon wheel fiber) [12] and
d) microcapillary fiber SPR sensor [56].
15 to refractive index in wavelength. Figure 2.10d illustrates the microcapillary fiber SPR sensor and the characteristic of this SPR sensor is that light travels in the medium with the highest refractive index (sample). This design reached a sensitivity of 6607 nm/RIU for a large high refractive index (>1.5 RI). In these configurations one of the main difficulties is the deposition of the metal inside the fiber.
Table 2.1 shows some parameters that characterize SPR sensors’ performance, namely, sensitivity, resolution, wavelength operation, refractive index (RI) range of detection for different fiber optical structures [57]. Table 2.1 addresses SPR fiber structures with different geometrical configurations and coatings [18].
Table 2.1 Characteristics of general SPR-based fiber-optic sensors [1].
Optical structure Characteristics Detection RI range
Wavelength operation
Sensitivity/
Resolution Ref. Cladding-off
cylindrical fiber
Single metal coating
MMF, Au-Ag alloy
nanoparticle. 1.342~1.346 400~800 nm ~3000 nm/RIU [58] MMF, Au, surface
roughness.
1.3335~
1.4018 550~1000 nm 1600~3000 nm/RIU [59] MMF, Au. 1.33~1.40 670 nm 2.5 x 10⁻⁴ RIU [60]
MMF, parameter analysis.
1.333 e
1.339 400~900 nm
2266.7~2780.1
nm/RIU [61]
Multi-metal coating
Au, Ag double layer,
Au-Ag alloy nanoparticle.
2500~3000 nm/RIU [62]
With multi-layer
MMF, Au, dielectric multilayer. (SIO2, TiO2)
1.333 e 1.336 1.001~1.313
450~950 nm 10-5 RIU [63]
Tapered fiber
Off Cladding
MMF, Au, tapering ratio.
1.333 e
1.335 2700~4900 nm/RIU [64] MMF, Au. 1.333~1.343 600~700 nm 2750~15000nm/RIU [65]
With Cladding
SMF, Au, semi-cylindrical, multiple
peaks.
1.440~1.454 400~1700 nm 7 x 10⁻⁷ RIU [50]
D-Type fiber Single metal
coating SMF, cut core 1.33~1.40 632.8 nm 8 x 10⁻⁵ RIU [66]
With overlayer
SMF, half of core polished, Au, Overlayer SiO2
1.332~1.40 632.8 nm 2.5 x 10⁻⁶ RIU
(phase) [67] SMF, half of core
polished, Au, Overlayer SiO2
1.33~1.40 632.8 nm 2.5 x 10⁻⁵ RIU [46]
SMF, remained thin clad, Au, overlayer
Ta2O5
1.329~1.393 760~940 nm 5 x 10⁻⁷ RIU [68]
SMF, Au, Al mirror,
overlayer Ta2O5 1.32~1.42 825 nm 4 x 10
-5 RIU [69]
With thin cladding
PMF, polarization
alignment. 1.33~1.339 700~900 nm 4 x 10⁻⁶ RIU [70]
Modified fiber end
Flat fiber tip
MMF, end mirror Ag
and metal coating,
Au.
State of the art
16
2.4.4
Plasmonic coating
The most simple designs of SPR sensor found in literature consist in a material that guides the light and a metal film, normally gold (Au), silver (Ag), copper (Cu) or alumina (Al), but there are countless possibilities to combine multiple metal coatings to improve the sensitivity, resolution and spectral operation region of the SPR sensor. Sharma in [71] studied different combinations of two metallic layers and these bi-metallic layers have a better performance that only one layer. We can also use a thin high refractive index overlayer after the metallic layer to shift the spectral operation sensing region [72]. We can also use metamaterials instead of pure metallic layers and improve the operational characteristics of the sensor [73]. The shape of the metallic layer is also studied to improve the sensor. The use of metallic wires permit an increase in the number of modes that couple with the fundamental mode and increase the performance of the sensor [74].
2.4.5
Fiber Grating SPR sensor
Until now, the most common mechanism of SPR excitation in an optical fiber is total internal reflection (TIR), where a part of the evanescent field that penetrates through the interface no ordinary total reflection can excite SPs. The evanescent field is increased by reducing the distance between the waveguide and the metal, and with that purposed, multiple designs were created (subsection 2.4.3). Another technology used for SPR excitation is fiber grating.
A fiber grating is a periodic structure in the refractive index of the fiber core that couples with a specific wavelength, producing an effective mirror for that wavelength. This technology allows the modes that are propagated in the core to be propagated in the cladding of the fiber and be coupled with the plasmonic modes without change the external geometry of the fiber. These structures are the Long Period Fiber Gratings (LPFGs) and Tilted Fiber Bragg Gratings (TFBGs) permitting the deposition of the metal directly on the fiber cladding. The use of LPFGs as SPR sensors was reported by Nemova
17
(a)
(b)
Figure 2.11 Examples of grating SPR sensor (a) with a long period grating (LPG), (b) with a tilted fiber Bragg grating TFBGs [1].
2.4.6
Application of the SPR sensor
SPR sensors are essentially refractive index sensors and the sensitivity and resolution of the sensor (characterization parameters) are calculated through the variation of the refractive index (n), as shown in section 2.3. We also know the different components of the SPR sensor (thickness and type of metal, composition of the fiber, distance between the core and the metal, external refractive index, among others) change the effective refractive index of the sensor and consequently change the operational characteristics of the SPR sensor. The possibility to change these important parameters of the SPR sensor permits the optimization of the sensor.
State of the art
18
Luan in [28] used a liquid with large thermo-optic coefficient, ideal for measure of temperature. Saikia in [78] created a pH sensor based on SPR of silver nanostructured film.
19
Chapter 3
Models and methodology
In this chapter, we review the concepts of light propagation, addressed by electromagnetic theory. We also discuss the optical properties of dielectrics and metals. Next, we explain optical waveguide theory for a planar step-index and for a circular step-index guide, to understand the behavior of the different materials in these structures and finally the phenomena of SPR in optical fiber sensors is explained [81].
An introduction of the finite element method (FEM), the methods used for the simulation of SPR and the different problems of these methods in the simulations are also addressed.
3.1
Maxwell’s equations
The electromagnetic fields in optical fiber waveguides are governed by the
macroscopic Maxwell’s equations in the absence of external currents or electric
charges, say:
t
t
t
E
(
r
,
)
B
(
r
,
)
(3.1)t t t j t
H(r, ) (r, ) D(r, ) (3.2)
)
,
(
)
,
(
r
t
r
t
D
(3.3)0
)
,
(
B
r
t
(3.4)where E, H, D and B are the electric, the magnetic, the dielectric and the magnetic induction fields, respectively. Also, the term j is the current density, ρ is the charge density, r is the spatial coordinate and t denotes time.
The dielectric and the magnetic fields are written as [82]
![Figure 2.4 Attenuation of light due to SPR with angular modulation or wavelength modulation [2].](https://thumb-eu.123doks.com/thumbv2/123dok_br/15672518.624190/27.892.247.603.110.379/figure-attenuation-light-spr-angular-modulation-wavelength-modulation.webp)
![Figure 2.10 SPR fiber optic sensors based in photonic crystal fibers with; (a) with circular holes [55], (b) with crescent-shape holes, (c) MOF three structured holes (also called wagon wheel fiber) [12] and](https://thumb-eu.123doks.com/thumbv2/123dok_br/15672518.624190/33.892.120.729.205.822/figure-sensors-photonic-crystal-fibers-circular-crescent-structured.webp)
![Table 2.1 shows some parameters that characterize SPR sensors’ performance, namely, sensitivity, resolution, wavelength operation, refractive index (RI) range of detection for different fiber optical structures [57]](https://thumb-eu.123doks.com/thumbv2/123dok_br/15672518.624190/34.892.148.787.350.1093/parameters-characterize-performance-sensitivity-resolution-wavelength-refractive-structures.webp)