Research Article
Investigating Acid Stress Response in Different
Saccharomyces
Strains
Rogelio Lopes Brandão,
1Júlio César Câmara Rosa,
1Jacques Robert Nicoli,
2Marcos Vinicius Simi Almeida,
1Ana Paula do Carmo,
1Heloa Teixeira Queiros,
1and Ieso Miranda Castro
1,31N´ucleo de Pesquisas em Ciˆencias Biol´ogicas, Escola de Farm´acia, Universidade Federal de Ouro Preto,
Campus Morro do Cruzeiro, 35400-000 Ouro Preto, MG, Brazil
2Departamento de Microbiologia, Instituto de Ciˆencias Biol´ogicas, Universidade Federal de Minas Gerais,
Campus Universit´ario, 30171-970 Belo Horizonte, MG, Brazil
3LBCM, Instituto de Ciˆencias Exatas e Biol´ogicas, Campus Morro do Cruzeiro, 35400-000 Ouro Preto, MG, Brazil
Correspondence should be addressed to Ieso Miranda Castro; [email protected]
Received 3 February 2014; Accepted 1 April 2014; Published 17 April 2014
Academic Editor: Praveen Rao Juvvadi
Copyright © 2014 Rogelio Lopes Brand˜ao et al. This is an open access article distributed under the Creative Commons Attribution License, which permits unrestricted use, distribution, and reproduction in any medium, provided the original work is properly cited.
Yeast cells need to respond to a variety of stresses found in such different conditions as gastrointestinal tract after probiotic ingestion or fermentation vat during ethanol production. In the present study, H+neutralisation capacity, membrane fatty acid composition, H+-ATPase activity, and cytosolic Ca2+concentration were evaluated in yeast cells used for probiotic (Saccharomyces boulardii) and laboratory (Saccharomyces cerevisiaeW303) purposes, as well as in some W303 mutant strains forENA1gene andS. cerevisiae BY4741. Results show that the H+internal concentration of yeast is regulated by several systems, including the plasma membrane H+-ATPase, and that Ena1p has an important but undefined role in the cellular response to acid. Membrane fatty acid composition ofS. cerevisiaeW303 strain was affected by exposure to acidic pH, but the presence of 86 mM NaCl prevented this effect, whereas membrane fatty acid composition ofS. boulardiiwas unaffected by acidic pH. We also demonstrated that the acid stress response is dependent on calcium metabolism and blocked by FK 506.
1. Introduction
To survive and proliferate, free-living organisms must adapt to changes in their environment. Exposure of the Saccha-romyces cerevisiae to environmental stresses, such as toxic ions [1, 2], ethanol [3], or changes in temperature [4] or pH [5], triggers biochemical and gene expression changes [6]. Yeast rapid exposure to inorganic acids is of interest, because such exposure occurs under environmental (e.g., yeast probiotics passing through the gastrointestinal system) and industrial conditions (e.g., sulphuric acid to eliminate bacterial contamination in yeast cultures that are to be reused for fermentation [7]).
Saccharomyces cerevisiae grows well over a wide range of pH but grows better in acidic than in alkaline pH [5,
8]. Studies have demonstrated changes in the expression of
hundred genes in S. cerevisiae following alterations in pH [9–11]. The responses of S. cerevisiae to alkaline pH have been reviewed by Ari˜no [5] and involve various signalling pathways. In particular, the role of calcineurin on alkaline stress was suggested early on, and the involvement of calcium signalling in this response was reported in subsequent works [5, 10, 12, 13]. Responses to alkaline pH have also been described forCandida albicans[14] andAspergillus nidulans [15,16].
Responses to acid stress have been studied in yeast cells that were artificially exposed to weak organic acids [9, 17], food preservatives [17,18], and herbicides [19]. In response to exposure to weak acids, yeast cells show decreased mem-brane permeability, anion extrusion, an increased ability to catabolize preservatives [20], and altered gene expression [9]. Results of genomewide analysis and functional screening of
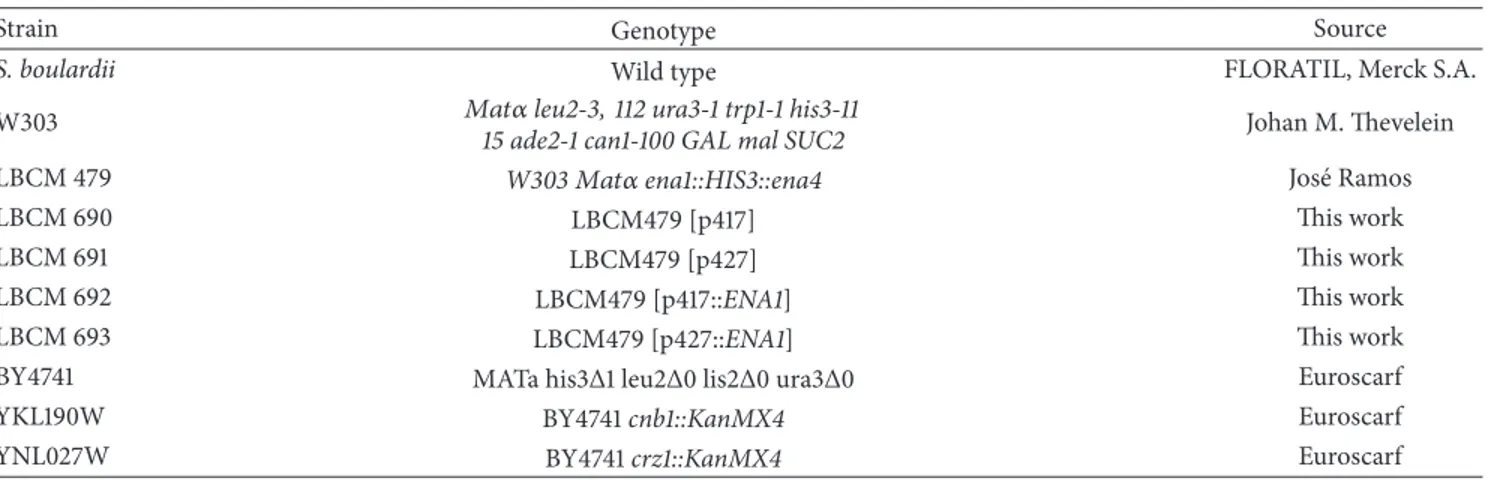
Table 1:Saccharomyces cerevisiaestrains used in this study.
Strain Genotype Source
S. boulardii Wild type FLORATIL, Merck S.A.
W303 𝑀𝑎𝑡𝛼leu2-3, 112 ura3-1 trp1-1 his3-11
15 ade2-1 can1-100 GAL mal SUC2 Johan M. Thevelein
LBCM 479 W303𝑀𝑎𝑡𝛼ena1::HIS3::ena4 Jos´e Ramos
LBCM 690 LBCM479 [p417] This work
LBCM 691 LBCM479 [p427] This work
LBCM 692 LBCM479 [p417::ENA1] This work
LBCM 693 LBCM479 [p427::ENA1] This work
BY4741 MATa his3Δ1 leu2Δ0 lis2Δ0 ura3Δ0 Euroscarf
YKL190W BY4741cnb1::KanMX4 Euroscarf
YNL027W BY4741crz1::KanMX4 Euroscarf
genes involved in response to lactic, acetic, and hydrochloric acids suggest that acidic conditions affect cell wall architec-ture, the expression of genes involved in metal metabolism, vacuolar H+-ATPase (V-ATPase), and HOG MAPK protein levels [17].
Similar to the response to weak acids, resistance to inorganic acid exposure involves changes in the membrane conductivity to H+, active extrusion of protons from the cell [21], and the modulation of gene expression [8, 17]. Previous studies have shown that the protein kinase C (PKC) pathway involved in cell integrity inS. cerevisiaeis activated in response to acid stress and that this activation is dependent on the cell wall sensor Mid2p [22–24]. Claret et al. have suggested the existence of two distinct pathways, involving Mid2p (cell wall sensor) or Rgd1p (Hog pathway) that act together to induce cell integrity pathway and to increase acidic tolerance [22].
InSaccharomyces, cytosolic calcium plays an essential role in the control of the cell cycle, budding process, and mating. Additionally, cytosolic calcium is an important second mes-senger in eukaryotic cells. Yeast cells growing under standard laboratory conditions exhibit low cytosolic calcium levels and minimal calcineurin activity [25]. Exposure to various environmental stresses, such as salt, oxidative, alkali, or heat stress, causes immediate changes in the cytosolic calcium. Calcium levels first increase and then decline rapidly when yeast cells are exposed to these conditions [10,14,26–28]. Crz1 is the major effector of calcineurin-regulated gene expression inS. cerevisiae, but unidentified targets for calcineurin with roles in stress adaptation also exist [5]. The Cch1 and Mid1 proteins, components of membrane calcium channel, and effectors of Slt2p (PKC pathway) are involved in cell viability at low pH inSaccharomyces[22]. However, calcium-mediated signalling mechanisms have not been studied under the acid-shock response.
In a previous work carried out in our laboratory, we established that low concentrations of sodium ions conferred protection to yeast cells exposed to acid stress [29]. Our observations also suggested that the systems involved in maintaining the plasma membrane potential (PMA1p H+ -ATPase and secondary transporter systems) were linked to the acid stress response. In the present study, we focused
experiments on plasma membrane H+-ATPase participation and on calcium signalling events observed in yeast cells in response to acid stress.
2. Materials and Methods
2.1. Yeast Strains and Growth Conditions. Table 1 lists the yeast strains used in this study. Yeast strains were grown in an orbital shaker (200 rpm) at 30∘C in YPD medium containing (w/v) 1% yeast extract, 2% peptone, and 2% glucose. Cellular growth was monitored by optical density (OD) at 600 nm.
2.2. Acid Stress Condition and Viability Assays. Yeast cell cultures(OD600nm ∼ 1.0)were harvested by centrifugation
at 4,750×g for 5 min and washed twice with YP media. Then pellets were suspended at an OD600 nm of 1.0 in an aqueous solution, previously adjusted to pH 2.0 with 1 M HCl and supplemented with 86 mM NaCl. This condition was applied to every acid treatment performed in this study. Yeast samples were then incubated in an orbital shaker at 30∘C for 1 h. Aliquots were collected after 0 (control cells, before acid stress), 15, 30, and 60 min of incubation. Cells were immediately washed twice with an equal volume of YP and diluted 20,000×. Then, 50𝜇L of cell suspension was seeded on YPD agar. Plates were incubated at 30∘C for 48 to 72 h. The results were expressed as the percentage (%) of colony forming units (cfu) relative to the control sample (𝑡 = 0).
The growth of yeast cells in the presence of Na+was tested on a series of YPD plates supplemented with increasing con-centrations of NaCl (200–500 mM). Tenfold serial dilutions of cell suspensions were prepared, and 5𝜇L aliquots of each were spotted onto YP plates. Growth was monitored over 3 days.
cells) to acid stress. Aliquots of 50 mL were collected by centrifugation, washed twice with Milli-Q water, and resus-pended in a 2 mL volume to obtain a dense cell suspension. The pH of cell suspension was previously adjusted in pH 6.8 with NaOH and the first acid pulses were performed with small volumes of 10 mM HCl, because near the neutral pH range even the addition of small amounts of protons results in large pH changes. To estimate the total cell capacity to neutralise H+ (meaning the ability of cell surface-derived chemical groups plus internal metabolites), the cells were previously disrupted with liquid nitrogen in Milli-Q water and resuspended as described before.
2.4. Determination of H+-ATPase Activity. Measurements of H+-ATPase activity were made with 375 mg of cells (wet weight) grown in YPD (4% glucose) to an OD600 of 1.0– 1.2 (control) or cells grown in YPD, washed, exposed to acid stress, as described above, and harvested after 10, 30, and 60 min. After recover on glass fiber filters, the cells were removed from the filters, immediately frozen in liquid nitrogen, and stored until use. Plasma membrane isolation and determination of ATPase activity, in the presence of inhibitors of mitochondrial ATPase and phosphatase, were performed as previously described [31]. Protein content was determined by the Lowry method [32].
2.5. Intracellular Free Calcium Concentration. The cytosolic free calcium concentration was measured by the aequorin-based method [33] with some modifications. The pVTU-AEQ plasmid was a gift from Marco Vanoni (Univer-sit`a di Milano-Bicocca, Milan, Italy). Briefly, exponentially growing cells transformed with the multicopy apoaequorin-expressing plasmid pVTU-AEQ were harvested by cen-trifugation at 4,750×g for 5 min, washed three times with Mes/Tris 0.1 M (pH 6.5), and resuspended at a density of
∼109 cells/mL. To reconstitute functional aequorin, 50𝜇M coelenterazine (Molecular Probes; stock solution 1𝜇g/𝜇L dissolved in methanol) was added to the cell suspension, and the cells were incubated for 30 min at room temperature in the dark. Excess coelenterazine was removed by washing the cells three times with Milli-Q water and centrifuging at 3,200×g for 3 min.
For each acid pulse (pH 2.0 plus 86 mM NaCl), 450𝜇L of cell suspension (in water) was transferred to a luminometer tube. Light emission was monitored in a Berthold Lumat LB 9501/16 luminometer at 2 s intervals starting 1 min before and lasting until >6 min after HCl addition to the final concentration indicated in the figures. The results summarise three replicates and are expressed in relative luminescence units per second (RLU/s).
2.6. Analysis of Membrane Fatty Acid Composition. The Microbial Identification System (MIS, Microbial ID Inc., Newark, DE, USA) was used to analyse the fatty acid com-position of cytoplasmic membranes [34]. Methyl esters were obtained according to the MIDI method (Microbial ID Inc.). Methyl esters were identified and quantified by chromatogra-phy with the Sherlock software package (MIDI Inc., version
4.5). Arcsine square root transformations were performed. Data were analysed by analysis of variance (ANOVA) with the Scott Knott test at 5% significance. Transformations and analyses were performed with the Genes software package, version 2007.0.0, which allows for the study of microbial genetic diversity from membrane fatty acid composition [35]. Data were analysed by the standardized Euclidian distance, and the calculated matrix distance was used for clustering analysis by the UPGMA method (Unweighted Pair Group Method with Arithmetic Mean).
2.7. Molecular Biological Methods. Preparation and manipu-lation of nucleic acids (e.g., phenol extraction, ethanol pre-cipitation, and electrophoresis) were performed as described by Sambrook et al. [36].
The plasmids p417-CYC (low copy) and p427-TEF (high copy), purchased from Dualsystems Biotech AG, Switzerland, were used to express ENA1 (YDR040C, Saccharomyces cerevisiaeGenome Database,http://www.yeastgenome.org/). The insert was prepared by using yeast genomic DNA from the W303 strain as a template. The primers were forward,
GACTAGTATG GGCGAAGGAACTACTAAG; and reverse,
TCCCCCGGGTCATTGTTTAT ACCAATATTAAC. The
forward PCR primer contained a Spe1 site, and the reverse primer had a Sma1 site. The PCR product was cut with Spe1/Sma1 and inserted into Spe/Sma1 p417-CYC or p427-TEF vectors to produce the recombinant plasmids.
Competent Escherichia coli Top10F’ strain cells were transformed with the recombinant plasmids, for expres-sion of Ena1p or aequorin. The presence of the appropri-ate insert was determined by DNA extraction, followed by digestion and sequencing with the chain termination method (MegaBace 1000 Sequencing Analysis System and DynamicTM ET dye terminator kit). Nucleic acid sequences were compared to sequences in theSaccharomycesGenome Database.
For H+-ATPase activity and bioluminescence assays, yeast cells were transformed by the lithium method [37].
2.8. Reproducibility of Results. All experiments were per-formed in triplicate. Means±SD are indicated in each figure, except for H+neutralisation and calcium signal experiments.
3. Results
1 2 3 4 5 6 7 8 1000
2000 3000 4000
pH
nmo
l H
+ /m
g o
f cells
(a)
1 2 3 4 5 6 7 8
1000 2000 3000 4000
pH
nmo
l H
+/m
g o
f cells
(b)
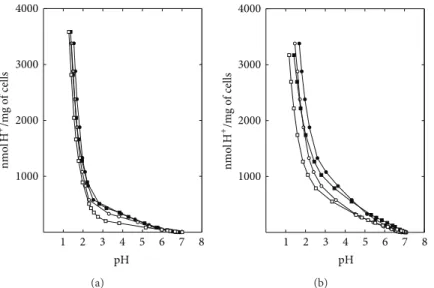
Figure 1: H+neutralisation capacity of yeast cells grown in YPD medium, as determined by an acid pulse technique. (a) Extracellular H+ neutralisation capacity ofS. boulardii(e),S. boulardiiexposed to pH 2.0 + 86 mM NaCl (o),S. cerevisiaeW303 (◼), andS. cerevisiaeW303
exposed to pH 2.0 + 86 mM NaCl (◻). (b) Total H+neutralisation capacity ofS. boulardii(e),S. boulardiiexposed to pH 2.0 + 86 mM NaCl
(o),S. cerevisiaeW303 (◼), andS. cerevisiaeW303 exposed to pH 2.0 + 86 mM NaCl (◻).
and S. boulardii to neutralise added H+ were similar, but S. cerevisiaeW303 was lightly more affected by acid pulses thanS. boulardii(Figure1(a)). Results also demonstrated that the extracellular capacity to neutralise added H+was smaller than the total capacity for both yeast strains (Figures1(a)and
1(b)). This difference is particularly evident when we observe the resulting pH after the addition of a specific amount of H+/mg of cells. Saccharomyces boulardii had a higher total H+ neutralisation capacity and possibly a greater ability to maintain pH homeostasis after acid stress thanS. cerevisiae W303 (Figure 1(b)), suggesting that the two strains have different compositions of intracellular buffering compounds. The resulting pH after the addition of 1,000 nmol H+/mg of cells was 3.3 and 2.8 (in control cells or exposed to pH 2.0 + 86 mM NaCl, resp.) for S. boulardii and pH 2.6 and 2.2 for W303 (Figure 1(b)). This buffering mechanism is important for a rapid intracellular pH adjustment but cannot accommodate extreme changes in extracellular pH. In fact, a 0.5 pH unit difference in external medium, in low pH range, represents a pronounced stress condition.
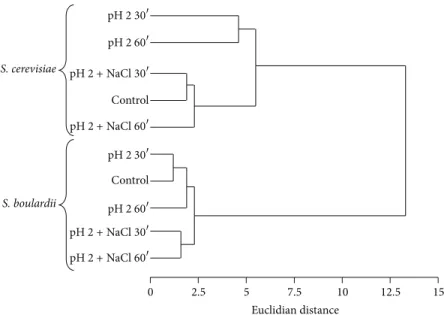
3.2. Membrane Fatty Acid Composition. The composition and levels of fatty acids in the cell membrane were modulated in response to acid stress, as shown by a dendrogram shown in Figure2. A passive increase in intracellular proton concen-tration may partially explain this cellular response to acid. This effect was particularly pronounced in the W303 strain, in which changes in fatty acid profile were observed after 30 min of acid exposure (pH 2.0). Small increases were observed for oleic acid and arachidic acid, whereas the percentage of gadoleic acid, a cis-icos-9-enoic acid related to oleic acid but has 20 carbon atoms, presented a large decrease. Figure2also shows that the addition of 86 mM NaCl prevented this effect in the W303 strain and that membrane fatty acid composition of S. boulardii was unaffected by acidic pH. It has been
known that unsaturation of fatty acid chains has a profound effect on membrane fluidity, but further work will be needed to investigate if the changes in saturation and unsaturation degrees influence the acid tolerance.
3.3. H+-ATPase Activity in Ena Mutants. To confirm the involvement of systems involved with maintaining the plasma membrane potential (PMA1/H+-ATPase and sec-ondary transport systems) during the acid stress response, we constructed yeast strains expressing different levels of Ena1p. While Pma1p is involved in protons active extrusion, ENA proteins act in the responses to saline or alkaline stress [38] and help to regulate the plasma membrane potential [29]. Sac-charomyces cerevisiaecontains several genes encoding ENA proteins but theENA1gene is the most functionally relevant component of the gene cluster [38]. Figure 3shows the in vivo activation of the plasma membrane H+-ATPase by pulse acid (pH 2.0 + 86 mM NaCl) in yeast strains with different levels of Ena1p. The deletion strain (W303ena1::HIS3::ena4), the W303ena1::HIS3::ena4strain transformed with the empty vectors, and the strain expressing single copy of ENA1 (W303 ena1::HIS3::ena4 + p417::ENA1) showed acid-induced H+ -ATPase activation. In contrast, no activation was observed in Saccharomyces strains expressing high levels of Ena1p (W303 and W303 ena1::HIS3::ena4 + p427::ENA1). Table2
0 2.5 5 7.5 10 12.5 15 Euclidian distance
Control
Control
30
60
+NaCl30
+NaCl60
30
60
+NaCl30
+NaCl60
S. cerevisiae
S. boulardii
pH 2
pH 2
pH 2
pH 2
pH 2
pH 2 pH 2
pH 2
Figure 2: Dendrogram of the fatty acid composition of yeast cytoplasmic membranes. Data were analysed by the standardized Euclidian distance, and the calculated matrix distance was used for clustering analysis by the UPGMA method. The composition and levels of fatty acids in the cell membrane were modulated in response to acid stress, particularly in the W303 strain, and this effect was prevented by addition of 86 mM of NaCl as shown by the dendrogram.
0 10 20 30 40 50 60
0.0 0.2 0.4 0.6 0.8
Time (min)
H
+-A
TP
as
e ac
ti
vi
ty
(
𝜇
mol Pi
·
min
−1
·
m
g p
ro
tein
−1
)
Figure 3: H+-ATPase activity. Plasma membrane H+-ATPase acti-vation in wildS. cerevisiaeW303 (e), theena1-4mutant (◼),ena1-4
mutant +p417::ENA1(⧫),ena1-4mutant +p427::ENA1(),ena1-4 mutant + p417 (◊), andena1-4mutant + p427 (Δ)S. cerevisiaeW303 mutants subjected to pH 2.0 (HCl) + 86 mM NaCl for 60 min.
the ENA1 levels, the acid-induced plasma membrane H+ -ATPase activation, and the acid tolerance as demonstrated in a previous study [29]. In contrast, strains overexpressing Ena1p have more positive membrane potentials and are not susceptible to acid-induced H+-ATPase activation. The strain expressing single copy (or maximum two copies of ENA1) showed lower viability compared to S. boulardii (low ENA1 expression and acid resistance, previous work [29]) possibly because W303ena1::HIS3::ena4 + p417::ENA1 shows a different expression profile compared toS. boulardii (ectopic x eutopic expression). Subsequent experiments to understand the relationships between Ena1p expression and acid induced H+-ATPase activation are necessary to confirm
this hypothesis. In addition, other factors are involved in acid stress response.
3.4. Acid Induced Cytosolic Ca2+ Transient Increase. The calcium signal induced by glucose was well known and used as a positive control in the present experiment [39]. However, information on calcium transient signal in response to acid exposure is not available in the literature. As expected, yeast cells resuspended in Mes/Tris (0.1 M, pH 6.5) and submitted to glucose pulses showed clear glucose-induced calcium signal (Figure4(a)). On the other hand, acid pulses produced very low cytosolic calcium signal which were pH dependent (Figure4(b)). The effect of identical acid pulses was also measured in suspensions with lower cell density. We observed a higher calcium signal in these suspensions, likely because the denser cell suspensions had a higher buffering capacity (results not shown). However, the luminescence assay is pH sensitive, and other studies have demonstrated a relationship between pH and luminescence of coelenterazine [40]. To evaluate whether the transient acid-induced calcium signals were the result of pH changes, we performed a similar experiment using a 15 mM KCl pulse as a negative control. The KCl pulse did not induce pH change or stimulate luminescence (Figure4(b)).
Table 2: Effect of acid stress on strain viability (% cfu).
Strains
Conditions
Control (nonstressful) pH 2.0 + 86 mM NaCl
10 min 30 min 60 min
W303 100 82.2 ± 3.1 70.1 ± 5.0 32.9 ± 4.1
LBCM479 (ena1-4Δ) 100 96.6 ± 4.2∗ 84.4 ± 4.3∗ 67.3 ± 3.1∗
LBCM479 [p417::ENA1] 100 92.6 ± 2.6∗ 77.7 ± 0.6 37.0 ± 1.4
LBCM479 [p427::ENA1] 100 88.0 ± 1.6 73.2 ± 0.9 38.9 ± 3.5
Yeast cells were harvested during the exponential growth phase and subjected to 1 h of acidic stress (pH 2.0 + 86 mM NaCl). Data are expressed as the mean±
standard deviations of three separate experiments.∗(𝑃values<0.05 compared to W303 strain).
0 500 1000 1500 2000
Time (s)
RL
U/s
40 140 240 340 440 540
−60
(a)
0 50 100 150 200
40 140 240 340 440
−60
RL
U/s
Time (s)
(b)
Figure 4: Calcium signalling inS. cerevisiaeBY4741. (a) Glucose-induced calcium signalling at pH 6.5 (◼), pH 3.7 (), pH 3.0 (Δ), and pH 2.0 (◻); (b) acid-induced calcium signalling at pH 5.1 (◼), pH 4.2 (), pH 3.0 (Δ), pH 2.0 (◻), and 15 mM KCl (⧫).
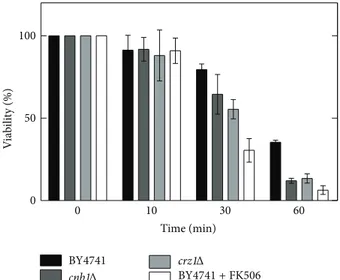
These cells (incubated with FK506) were less resistant when compared to control cells (Figure 5). It is known that S. cerevisiae generates cytosolic calcium signals in response to diverse stimuli. These calcium transient signals mediate various responses in eukaryotic cells. For example, alkaline stress triggers calcium fluctuation inS. cerevisiae[5] andC. albicans[14]. Claret et al. [22] proposed the involvement of the cell calcium channel components Cch1 and Mid1 in cell viability at low pH.
4. Discussion
Changes in extracellular pH have a negative effect on the yeast life cycle and the maintenance of internal pH homeostasis is important for cell viability. Yeast cells can maintain an appropriate internal pH by utilizing cell buffer systems and consuming H+through metabolic pathways [41], increasing proton extrusion by the plasma membrane H+-ATPase [42,
43], transporting acid between the cytosol and organelles [44, 45]. Our results confirm that the cell buffer power might be part of the pH homeostatic mechanism involved in the acid stress response. The composition and levels of fatty acids in the cell membrane were also modulated in response to acid stress. Here, we propose that modulation of composition and level of membrane fatty acids interferes with H+ conductivity into the cells. Genes involved in the biosynthesis of plasma membrane lipids, which are essential
0 50 100
BY4741
Time (min)
V
ia
b
ili
ty (%)
0 10 30 60
BY4741 +FK506
cnb1Δ
crz1Δ
Figure 5: Effect of pH 2.0 (HCl) + 86 mM NaCl on calcineurin/crz1 mutants. The results show that the acid stress response is dependent on calcium metabolism and is blocked by FK 506.
Sant’Ana et al. [29], who reported that the addition of sodium conferred protection to yeast cells against acid stress. In fact, addition of sodium slowed depolarization promoted by proton influx. The authors suggested that, alternatively, the sodium effect could be related to unknown signalling events in response to acid stress. For instance, Bollo et al. [48] reported an effect of 120 mM extracellular NaCl on Ca2+ mobilization from intracellular stores inTrypanosoma cruzi. The present work showed that sodium, through an indirect effect, is able to affect the modulation of membrane fatty acids in acid stress condition.
It is well known that cells of most organisms maintain high concentration ratios of extracellular to intracellular H+ across the plasma membrane and that stress factors leading to dissipation of the H+gradient across the plasma membrane and to intracellular acidification induce the stimulation of plasma membrane H+-ATPase activity. In this work we compared the activity of plasma membrane H+-ATPase in different yeast strains exposed to low pH. The results indicate a H+-ATPase activation following the acid exposure. However, the level of activation, as previously suggested, and the great tolerance to acid were dependent on expression of secondary transport systems involved in maintaining the plasma membrane potential. This relationship between acid H+-ATPase activation and secondary systems needs to be clarified by studies of internal pH, of membrane potential, and H+-ATPase activity in strains expressing different levels of a gene family, especially those encoding the most impor-tant ionic transporters.
In the yeast S. cerevisiae, calcineurin, a heterodimeric enzyme consisting of a catalytic (a) subunit and an associated calcium binding regulatory (b) subunit, is activated under specific environmental conditions and plays an important role in coupling Ca2+ signals to cellular responses. The sensitivity and response of the cells to various stresses are dependent on its ability to sequester and use Ca2+ from external and internal stores. Our results show that calcium signalling participates in acid stress response and that the stress response is calcineurin dependent. Crz1, a substrate phosphoprotein for calcineurin, functions downstream of calcineurin to effect calcineurin-dependent responses. Via-bility test results show similar phenotypes forcnb1Δandcrz1Δ mutants.
The response of the yeastS. cerevisiaeto environmental stress results in remodelling of gene expression. In previous studies, the genome response to acid stress has been evaluated by DNA microarray analysis and a functional screening performed using a gene deletion collection [9, 17]. The expression analysis showed that genes involved in stress responses, such asYGP1,TPS1, andHSP150, were upregulated after acid shock and that genes involved in metal metabolism or regulated by Aft1p were induced under the acid adaptation [17]. The last study also indicated that loss of V-ATPase and Hog-MAPK proteins caused acid sensitivity. Mildly stressing acidic conditions (e.g., shift from pH 6 to pH 3) do not affect S. cerevisiaegrowth but instead may be slightly beneficial [8]. However, proteins in the cell wall have been shown to be upregulated in response to low pH [8,17,49].
Some studies on the effect of acidic pH on yeast show that PKC cell wall integrity pathway is activated in response to low pH and that RGD1p (Hog pathway) plays a role in response to acidic pH [22–24]. In more recent work, using screening deletion mutants and gene expression profile, de Lucena et al. [50] showed that the cell wall integrity pathway is the main mechanism for cell tolerance to sulphuric acid pH 2.5 and that Ca2+-calmodulin pathway is also responsive to this type of stress. Here, we have shown that cytosolic free calcium levels increase under acid shock and that calcineurin is an important transducer of calcium signals in acid stress responses.
In conclusion, the results of the present study show that the H+ internal concentration of yeast is regulated by several systems, including the plasma membrane H+-ATPase, and that Ena1p has an important but undefined role in the cellular response to acid. We also demonstrated that the acid stress response is dependent on calcium metabolism and blocked by FK 506. RNA-seq and microarray studies using differentS. cereviseaestrains, includingS. boulardii, are currently being performed to provide some insight into the mechanisms of acid stress response. In parallel, experiments aiming to characterize the calcium signal (external or inter-nal) and the dependence of the acid response pathway on calcineurin/Crz1p are under way.
Conflict of Interests
The authors declare that there is no conflict of interests regarding the publication of this paper.
Acknowledgments
This work was supported by Grants from Fundac¸˜ao de Amparo `a Pesquisa do Estado de Minas Gerais (FAPEMIG) (CBB APQ 00333-10/CBB APQ 00482/11) and from Conselho Nacional de Desenvolvimento Cient´ıfico e Tecnol´ogico (CNPq) to Ieso Miranda Castro (Process 304259/2011-0). J´ulio C´esar Cˆamara Rosa and Ana Paula do Carmo were supported by fellowships from Coordenac¸˜ao de Aperfeic¸oamento de Pessoal do Ensino Superior (CAPES). English language in the paper was revised by Write Science Right (http://www.writescienceright.com/).
References
[1] L. Trabalzini, A. Paffetti, A. Scaloni et al., “Proteomic response to physiological fermentation stresses in a wild-type wine strain ofSaccharomyces cerevisiae,”Biochemical Journal, vol. 370, no. 1, pp. 35–46, 2003.
[2] M. Platara, A. Ruiz, R. Serrano, A. Palomino, F. Moreno, and J. Ari˜no, “The transcriptional response of the yeast Na+-ATPase ENA1 gene to alkaline stress involves three main signaling pathways,”The Journal of Biological Chemistry, vol. 281, no. 48, pp. 36632–36642, 2006.
[4] A. Daquinag, M. Fadri, S. Y. Jung, J. Qin, and J. Kunz, “The yeast PH domain proteins Slm1 and Slm2 are targets of sphingolipid signaling during the response to heat stress,”Molecular and Cellular Biology, vol. 27, no. 2, pp. 633–650, 2007.
[5] J. Ari˜no, “Integrative responses to high pH stress inS. cere-visiae,”OMICS A Journal of Integrative Biology, vol. 14, no. 5, pp. 517–523, 2010.
[6] A. P. Gasch, P. T. Spellman, C. M. Kao et al., “Genomic expres-sion programs in the response of yeast cells to environmental changes,”Molecular Biology of the Cell, vol. 11, no. 12, pp. 4241– 4257, 2000.
[7] H. F. De Melo, B. M. Bonini, J. Thevelein, D. A. Sim˜oes, and M. A. Morais Jr., “Physiological and molecular analysis of the stress response of Saccharomyces cerevisiae imposed by strong inorganic acid with implication to industrial fermentations,” Journal of Applied Microbiology, vol. 109, no. 1, pp. 116–127, 2010. [8] A. K.-L. Chen, C. Gelling, P. L. Rogers, I. W. Dawes, and B. Rosche, “Response ofSaccharomyces cerevisiae to stress-free acidification,”Journal of Microbiology, vol. 47, no. 1, pp. 1–8, 2009.
[9] H. C. Causton, B. Ren, S. S. K. Sang Seok Koh et al., “Remodeling of yeast genome expression in response to environmental changes,”Molecular Biology of the Cell, vol. 12, no. 2, pp. 323– 337, 2001.
[10] R. Serrano, A. Ruiz, D. Bernal, J. R. Chambers, and J. Ari˜no, “The transcriptional response to alkaline pH inSaccharomyces cerevisiae: evidence for calcium-mediated signalling,”Molecular Microbiology, vol. 46, no. 5, pp. 1319–1333, 2002.
[11] R. Serrano, H. Mart´ın, A. Casamayor, and J. Ari˜no, “Signaling alkaline pH stress in the yeastSaccharomyces cerevisiaethrough the Wsc1 cell surface sensor and the Slt2 MAPK pathway,”The Journal of Biological Chemistry, vol. 281, no. 52, pp. 39785– 39795, 2006.
[12] L. Viladevall, R. Serrano, A. Ruiz et al., “Characterization of the calcium-mediated response to alkaline stress inSaccharomyces cerevisiae,”The Journal of Biological Chemistry, vol. 279, no. 42, pp. 43614–43624, 2004.
[13] M. Karababa, E. Valentino, G. Pardini, A. T. Coste, J. Bille, and D. Sanglard, “CRZ1, a target of the calcineurin pathway in Candida albicans,”Molecular Microbiology, vol. 59, no. 5, pp. 1429–1451, 2006.
[14] H. Wang, Y. Liang, B. Zhang, W. Zheng, L. Xing, and M. Li, “Alkaline stress triggers an immediate calcium fluctuation in Candida albicansmediated by Rim101p and Crz1p transcription factors,”FEMS Yeast Research, vol. 11, no. 5, pp. 430–439, 2011. [15] S. H. Denison, “pH regulation of gene expression in fungi,”
Fungal Genetics and Biology, vol. 29, no. 2, pp. 61–71, 2000. [16] M. A. Pe˜nalva, J. Tilburn, E. Bignell, and H. N. Arst Jr., “Ambient
pH gene regulation in fungi: making connections,”Trends in Microbiology, vol. 16, no. 6, pp. 291–300, 2008.
[17] M. Kawahata, K. Masaki, T. Fujii, and H. Iefuji, “Yeast genes involved in response to lactic acid and acetic acid: acidic con-ditions caused by the organic acids inSaccharomyces cerevisiae cultures induce expression of intracellular metal metabolism genes regulated by Aft1p,”FEMS Yeast Research, vol. 6, no. 6, pp. 924–936, 2006.
[18] P. Piper, C. O. Calderon, K. Hatzixanthis, and M. Mollapour, “Weak acid adaptation: the stress response that confers yeasts with resistance to organic acid food preservatives,” Microbiol-ogy, vol. 147, no. 10, pp. 2635–2642, 2001.
[19] M. G. Cabral, I. S´a-Correia, and C. A. Viegas, “Adaptative responses in yeast to the herbicide 2-methyl-4- chlorophenoxy-acetic acid at the level of intracellular pH homeostasis,”Journal of Applied Microbiology, vol. 96, no. 3, pp. 603–612, 2004. [20] M. Mollapour and P. W. Piper, “Targeted gene deletion in
Zygosaccharomyces bailii,”Yeast, vol. 18, no. 10, pp. 173–186, 2001. [21] P. Eraso and C. Gancedo, “Activation of yeast plasma membrane ATPase by acid pH during growth,”FEBS Letters, vol. 224, no. 1, pp. 187–192, 1987.
[22] S. Claret, X. Gatti, F. Doignon, D. Thoraval, and M. Crouzet, “The Rgd1p Rho GTPase-activating protein and the Mid2p cell wall sensor are required at low pH for protein kinase C path-way activation and cell survival inSaccharomyces cerevisiae,” Eukaryotic Cell, vol. 4, no. 8, pp. 1375–1386, 2005.
[23] X. Gatti, G. De Bettignies, S. Claret, F. Doignon, M. Crouzet, and D. Thoraval, “RGD1, encoding a RhoGAP involved in low-pH survival, is an Msn2p/Msn4p regulated gene inSaccharomyces cerevisiae,”Gene, vol. 351, pp. 159–169, 2005.
[24] H. Fernandes, O. Roumanie, S. Claret et al., “The Rho3 and Rho4 small GTPases interact functionally with Wsc1p, a cell surface sensor of the protein kinase C cell-integrity pathway in Saccharomyces cerevisiae,”Microbiology, vol. 152, no. 3, pp. 695– 708, 2006.
[25] K. W. Cunningham, “Acidic calcium stores ofSaccharomyces cerevisiae,”Cell Calcium, vol. 50, no. 2, pp. 129–138, 2011. [26] T. K. Matsumoto, A. J. Ellsmore, S. G. Cessna et al., “An
osmot-ically induced cytosolic Ca2+ transient activates calcineurin signaling to mediate ion homeostasis and salt tolerance of Saccharomyces cerevisiae,”The Journal of Biological Chemistry, vol. 277, no. 36, pp. 33075–33080, 2002.
[27] M. Bonilla and K. W. Cunningham, “Mitogen-activated protein kinase stimulation of Ca2+signaling is required for survival of endoplasmic reticulum stress in yeast,”Molecular Biology of the Cell, vol. 14, no. 10, pp. 4296–4305, 2003.
[28] C.-V. Popa, I. Dumitru, L. L. Ruta, A. F. Danet, and I. C. Farcasanu, “Exogenous oxidative stress induces Ca2+release in the yeastSaccharomyces cerevisiae,”FEBS Journal, vol. 277, no. 19, pp. 4027–4038, 2010.
[29] G. Dos Santos Sant’Ana, L. Da Silva Paes, A. F. Vieira Paiva et al., “Protective effect of ions against cell death induced by acid stress inSaccharomyces,”FEMS Yeast Research, vol. 9, no. 5, pp. 701–712, 2009.
[30] T. A. Krulwich, R. Agus, M. Schneier, and A. A. Guffanti, “Buffering capacity of bacilli that grow at different pH ranges,” Journal of Bacteriology, vol. 162, no. 2, pp. 768–772, 1985. [31] J. Becher Dos Passos, M. Vanhalewyn, R. Lopes Brandao, I.
M. Castro, J. R. Nicoli, and J. M. Thevelein, “Glucose-induced activation of plasma membrane H+-ATPase in mutants of the yeastSaccharomyces cerevisiaeaffected in cAMP metabolism, cAMP-dependent protein phosphorylation and the initiation of glycolysis,” Biochimica et Biophysica Acta: Molecular Cell Research, vol. 1136, no. 1, pp. 57–67, 1992.
[32] O. H. Lowry, N. J. Rosebrough, A. L. Farr, and R. J. Randall, “Protein measurement with the Folin phenol reagent,” The Journal of Biological Chemistry, vol. 193, no. 1, pp. 265–275, 1951. [33] R. Tisi, S. Baldassa, F. Belotti, and E. Martegani, “Phospholipase C is required for glucose-induced calcium influx in budding yeast,”FEBS Letters, vol. 520, no. 1–3, pp. 133–138, 2002. [34] M. C. Pereira, N. M. Vieira, M. R. T´otola, and M. C. M.
Revista Brasileira de Ciencia do Solo, vol. 35, no. 4, pp. 1159–1165, 2011.
[35] C. D. Cruz,Programa genes: diversidade gen´etica [Ph.D. thesis], Universidade Federal de Vic¸osa, Vic¸osa, MG, Brazil, 2008. [36] J. Sambrook, E. F. Fritsch, and T. Maniatis,Molecular Cloning: A
Laboratory Manual, Cold Spring Harbor Laboratory Press, Cold Spring Harbor, NY, USA, 2nd edition, 1989.
[37] H. Ito, Y. Fukuda, K. Murata, and A. Kimura, “Transformation of intact yeast cells treated with alkali cations,” Journal of Bacteriology, vol. 153, no. 1, pp. 163–168, 1983.
[38] A. Ruiz and J. Ari˜no, “Function and regulation of the Sac-charomyces cerevisiaeENA sodium ATPase system,”Eukaryotic Cell, vol. 6, no. 12, pp. 2175–2183, 2007.
[39] M. J. M. Tr´opia, A. S. Cardoso, R. Tisi et al., “Calcium signaling and sugar-induced activation of plasma membrane H+-ATPase inSaccharomyces cerevisiaecells,”Biochemical and Biophysical Research Communications, vol. 343, no. 4, pp. 1234–1243, 2006. [40] Y. Zang, Q. Xie, J. B. Robertson, and C. H. Johnson, “pHlash: a new genetically encoded and ratiometric luminescence sensor of intracellular pH,”PLoS ONE, vol. 7, Article ID 43072, 2012. [41] M. J. Carlisle, S. C. Watkinson, and G. W. Gooday,The Fungi,
Academic Press, San Diego, Calif, USA, 2nd edition, 2001. [42] R. Serrano, M. C. Kielland-Brandt, and G. R. Fink, “Yeast
plasma membrane ATPase is essential for growth and has homology with (Na+,K+), K+ and Ca2+-ATPases,”Nature, vol. 319, no. 6055, pp. 689–693, 1986.
[43] F. Portillo, “Regulation of plasma membrane H+-ATPase in fungi and plants,”Biochimica et Biophysica Acta: Reviews on Biomembranes, vol. 1469, no. 1, pp. 31–42, 2000.
[44] V. Carmelo, H. Santos, and I. S´a-Correia, “Effect of extracellular acidification on the activity of plasma membrane ATPase and on the cytosolic and vacuolar pH ofSaccharomyces cerevisiae,” Biochimica et Biophysica Acta: Biomembranes, vol. 1325, no. 1, pp. 63–70, 1997.
[45] G. A. Mart´ınez-Mu˜noz and P. Kane, “Vacuolar and plasma membrane proton pumps collaborate to achieve cytosolic pH homeostasis in yeast,”The Journal of Biological Chemistry, vol. 283, no. 29, pp. 20309–20319, 2008.
[46] J. Ding, X. Huang, L. Zhang, N. Zhao, D. Yang, and K. Zhang, “Tolerance and stress response to ethanol in the yeast Saccha-romyces cerevisiae,”Applied Microbiology and Biotechnology, vol. 85, no. 2, pp. 253–263, 2009.
[47] N. P. Mira, M. Palma, J. F. Guerreiro, and I. S´a-Correia, “Genome-wide identification ofSaccharomyces cerevisiaegenes required for tolerance to acetic acid,”Microbial Cell Factories, vol. 9, article 79, 2010.
[48] M. Bollo, S. Bonansea, and E. E. Machado, “Involvement of Na+/H+exchanger in the calcium signaling in epimastigotes of Trypanosoma cruzi,”FEBS Letters, vol. 580, no. 11, pp. 2686– 2690, 2006.
[49] J. C. Kapteyn, B. Ter Riet, E. Vink et al., “Low external ph induces HOG1-dependent changes in the organization of the Saccharomyces cerevisiaecell wall,”Molecular Microbiology, vol. 39, no. 2, pp. 469–479, 2001.
Submit your manuscripts at
http://www.hindawi.com
Hindawi Publishing Corporation
http://www.hindawi.com Volume 2014 Anatomy
Research International
Peptides
Hindawi Publishing Corporation
http://www.hindawi.com Volume 2014
Hindawi Publishing Corporation http://www.hindawi.com
International Journal of
Volume 2014
Zoology
Hindawi Publishing Corporation
http://www.hindawi.com Volume 2014
Molecular Biology International
Genomics
International Journal of
Hindawi Publishing Corporation
http://www.hindawi.com Volume 2014
The Scientific
World Journal
Hindawi Publishing Corporation
http://www.hindawi.com Volume 2014
Hindawi Publishing Corporation
http://www.hindawi.com Volume 2014
Bioinformatics
Advances inMarine Biology
Journal ofHindawi Publishing Corporation
http://www.hindawi.com Volume 2014 Hindawi Publishing Corporation
http://www.hindawi.com Volume 2014
Signal Transduction
Journal of Hindawi Publishing Corporationhttp://www.hindawi.com Volume 2014 BioMed
Research International
Evolutionary Biology
International Journal of
Hindawi Publishing Corporation
http://www.hindawi.com Volume 2014
Hindawi Publishing Corporation
http://www.hindawi.com Volume 2014
Biochemistry Research International
Archaea
Hindawi Publishing Corporation
http://www.hindawi.com Volume 2014
Hindawi Publishing Corporation
http://www.hindawi.com Volume 2014
Genetics
Research International
Hindawi Publishing Corporation
http://www.hindawi.com Volume 2014
Advances in
Virology
Hindawi Publishing Corporation http://www.hindawi.com
Nucleic Acids
Journal ofVolume 2014
Stem Cells
International
Hindawi Publishing Corporation
http://www.hindawi.com Volume 2014
Hindawi Publishing Corporation
http://www.hindawi.com Volume 2014
Enzyme
Research
Hindawi Publishing Corporation
http://www.hindawi.com Volume 2014
International Journal of