Original
Received 3/11/2010 Accepted 26/6/2012 (005123)
1 Faculty of Food Engineering, State University of Campinas – UNICAMP
2 Centre of Food Chemistry and Applied Nutrition, Institute of Food Technology – ITAL, Av. Brazil 2880, CEP 13070-178, Campinas, SP, Brazil, e-mail: [email protected] *Corresponding author
Evaluation of quality of butter from different provenance
Avaliação da qualidade de manteigas de diferentes procedências
Maria Fernanda Donato GONÇALVES1, Sueli Regina BAGGIO2*
1 Introduction
Dietary milk fats, on account of their higher content of saturated fatty acids, have long been associated with a variety of human diseases; however, recent studies have focused on the healthy components of milk fats, including conjugated linoleic acid (CLA) (GURSOY et al., 2003). CLAs represent a mixture of positional and geometric isomers of octadecadienoic acid with conjugated double bounds. Theoretically, a number of CLA isomers that differ in the positions of the double bound pairs (e.g., 7-9, 8-10, 9-11, 10-12 and so forth) are possible. Additional differences can exist in the configuration of the double bond so that cis-trans, trans-cis, cis-cis, or trans-trans configurations are all possible (BAUMAN et al., 2001). The major isomer of CLA in milk fat is cis-9, trans-11, and it represents 80-90 g.100 g–1 of the total CLA (WERNER; LUEDECKE; SHULTZ, 1992; BAUMAN et al., 2001). CLA is produced in ruminants as a first intermediate in biohydrogenaration of dietary linoleic acid isomerase from the rumen bacteria Butyrivibrio fibrisolvens
(PARIZA; HA, 1990). Consequently, CLA is found primarily in animal products, and the principal dietary sources are ruminant and dairy fats. It has been shown that CLA isomers have different physiological effects such as reduction in body fat
accretion, antidiabetic effects, reduction in the development of atherosclerosis, enhanced bone mineralization, anticarcinogenic effects, cholesterol-depressing, antioxidative, growth-promoting properties, and modulation of immune system (WERNER; LUEDECKE; SHULTZ, 1992; BAUMAN et al., 2001; PARIZA; HA, 1990; GURSOY et al., 2003).
Milk fat is one of the most complex fatty acid compositions of all common fats, and it is composed of about 98 g.100 g–1 triglycerides. It contains numerous fatty acids (FA), mainly saturated (66 g.100 g–1), but also monounsaturated (38 g.100 g–1) and polyunsaturated fatty acids (4 g.100 g–1) (CARDAK; YETISMEYEN; BRUCKNER, 2003). Fatty acid composition, such as polyunsaturated to saturated fatty acid ratio, affects the relationship of dietary fat and serum cholesterol (DASHTI et al., 2003). Trans fatty acids are naturally found in low concentrations in dairy products because of the biohydrogenation process in the rumen, but they may also be formed during the processing of dairy products at high temperatures such as baking or frying. Trans fatty acids have been associated with biological and toxicological effects such as coronary heart disease and disturbances of the metabolism
Resumo
As amostras de manteigas foram avaliadas através das análises de ácidos graxos livres, índice de peróxidos, colesterol e composição em ácidos graxos. Foram analisadas 66 amostras, sendo 36 de procedência brasileira, 18 francesas e 12 argentinas. As amostras brasileiras foram provenientes dos Estados do Rio Grande do Sul, Paraná, São Paulo, Minas Gerais e Goiás. As amostras foram avaliadas quanto aos teores de ácidos graxos livres, índices de peróxidos, lipídeos totais, colesterol e composição em ácidos graxos livre. Os teores de ácidos graxos livres variaram de 0,16 a 0,46 g.100 g–1 e os índices de peróxidos de 0,35 a 1,80 meq.kg–1. Os teores de colesterol variaram de 192,8 to 226,3 g.100
g–1 e os lipídios totais de 81,8 a 86,8 g.100 g–1.Os teores de ácidos graxos saturados, monoinsaturados e poli-insaturados variaram de 43,86
a 52,74, de 21,65 a 23,34 e de 2,11 a 2,89 g.100 g–1, respectivamente. Os teores de CLA variaram de 0,56 a 0,86 g.100 g–1 e os isômeros trans
de 2,18 a 3,81 g.100 g–1.
Palavras-chave: colesterol; lipídios; ácidos graxos; CLA; manteiga.
Abstract
Butter samples were evaluated for free fatty acids, peroxide value, cholesterol, and fatty acid composition focusing on the trans isomer and conjugated linoleic acid (CLA). Sixty six samples were analyzed. Thirty six were collected in Brazil, eighteen in France, and twelve in Argentina. Samples were evaluated by free fatty acids, peroxide value, total lipid, cholesterol and fatty acid composition. The free fatty acid content varied from 0.16 to 0.46 g.100 g–1 and the peroxides value levels from 0.35 to 1.80 meq.kg–1. The cholesterol content varied from 192.8 to
226.3 g.100 g–1 and the total lipid content varied from 81.8 to 86.8 g.100 g–1. The levels of saturated, monounsaturated, and polyunsaturated
fatty acids varied from 43.86 to 52.74, from 21.65 to 23.34, and from 2.11 to 2.89 g.100 g–1, respectively. The conjugated linoleic acid (CLA)
content varied from 0.56 to 0.86 g.100 g–1 and the levels of total trans isomer varied from 2.18 to 3.81 g.100 g–1.
Keywords: cholesterol; lipids; fatty acids; CLA; butter.
butter brands as 10AB and 11AB. All of the analyzed butter brands were extra type and salty. The samples were acquired from supermarkets in the city of Campinas, State of Sao Paulo, Brazil.
2.2 Methods
Determination of free fatty acids
Free fatty acids were determined according to the AOCS method Ca 5a-40 (AMERICAN..., 2004a).
Determination of peroxide value
Peroxide value was determined according to the AOCS method Cd 8b-90 (AMERICAN..., 2004b).
Determination of total lipids
The total lipids were extracted with petroleum ether by centrifugation, according to the official method ISO Norm TC 34/SC 5 (INTERNATIONAL..., 2000).
Determination of cholesterol
The cholesterol was determined according to the method described by Mazalli, Saldanha and Bragagnolo (2003). The method consists of direct saponification in alcoholic KOH followed by extraction of the unsaponifiable fraction with hexane and determination of cholesterol using a gas chromatograph (HP, model 6890, Santa Clara, California, USA) equipped with auto sampler, flame ionization detector, and split injector (split ratio 1:50). Chromatography was performed using a fused silica capillary column HP-5MS (30 m, 0.25 mm d.i., 0.25 µm film thickness) (Agilent, Santa Clara, California, USA). The initial column temperature was 160 °C for 1 minute, and then it was programmed to increase at 10 °C.min–1 to 300 °C; the injector temperature was set at 270 °C and the detector temperature at 300 °C. The carrier gas was helium at a flow rate of 1 mL.min–1, and nitrogen was used as the make-up gas at 30 mL.min–1. The injection volume was 1 µL. The cholesterol was identified by comparison of the retention times of the sample with that of the standard (Sigma Chemical Company (St. Louis, MO, USA) and by spiking.
Quantification of cholesterol was performed by internal standardization using 5α-cholestano (Sigma Chemical Company, St. Louis, MO, USA) as internal standard.
Determination of the fatty acid composition
The dried lipid extract was esterified with a solution of ammonium chloride and sulphuric acid in methanol (HARTMAN; LAGO, 1973). Fatty acid methyl esters were separated in a gas chromatograph (Varian, model 3900, Palo Alto, California, USA) equipped with auto sampler (CP-8410); injector split,(split ratio 1:75); fused silica capillary column (100 m × 0.25 mm i.d., 0.20 µm film thickness) (CP-SIL 88, Chrompack, Middelburg, The Netherlands); and flame ionization detector. The initial column temperature was 120 °C of the essential fatty acids in the fetus, which could affect
intrauterine human growth (KUMAR; SINGHAL, 1991). Dairy products are among the main sources of dietary cholesterol. Cholesterol is the dominant sterol of milk (>95 g.100 g–1 of total sterol) (COLLINS; McSWEENEY; WILKINSON, 2003). The association between plasma cholesterol and atherosclerosis has been a topic of intense research for many decades and is still a major field of investigation. This situation emphasizes the importance of the determination of cholesterol in food of animal origin, including milk and dairy products. Any factor likely to raise plasma cholesterol is generally considered to be unfavorable although the role of dietary cholesterol on human health has not been yet elucidated (FLETOURIS et al., 1998).
Butter is traditionally produced from cream of cow milk. According to Codex Alimentarius and Brazilian legislation, salted butter has to present at least of 80 g.100 g–1 fat content (CODEX ALIMENTARIUS, 1971; BRASIL, 1996).
There may be factors that influence the fatty acid composition of milk fat, such as the feeding of cows (BANKS; MUIR, 1981; BLACK, 1985; CLAPPERTON; BANKS, 1985), genetic factors (GRUMMER, 1991; HARGROVE; MBAH; ROSEMBERG, 1981), seasonal factors (HINRICHS; HEINEMAN; KESSLER, 1992; JUÁREZ; ALONSO; RAMOS, 1983), and regional factors (WERNER; LUEDECKE; SHULTZ, 1992; O’SHEA et al., 1998).
The national dairy industry needs to improve its quality control to compete with the countries of MERCOSUL and the EU because with the globalization of the economy, only those who offer high quality, affordable, and safe products to consumers will survive (AUGUSTA; SANTANA, 1998). These authors evaluated the quality of the extra butter with salt, both domestic and imported, marketed in the State of Rio de Janeiro. The samples were analyzed for acidity, peroxide value, iodine value, moisture content, chloride content of sodium, and fatty acid composition by gas chromatography. The results were compared with the current Brazilian legislation to check compliance.
The objective of this research was to evaluate butter of different provenance by measuring free fatty acids, peroxide value, cholesterol, and fatty acid composition, with emphasis on the conjugated linoleic acid (CLA).
2 Materials and methods
2.1 Material
commercialized extra type butters in Rio de Janeiro state, Brazil. There was a significant difference between the peroxide value contents found them and those found in the present study. It was evidenced that all brands of butter analyzed by Augusta and Santana (1998) presented higher peroxide values than those obtained in this study and those established by the Brazilian legislation, reaching 3.37 meq.kg–1.
Table 2 shows the cholesterol and total lipid contents in the butter samples of the different brands. The cholesterol and total lipid contents were significantly different. The cholesterol contents varied from 192.8 ± 25 (brand 5BB) to 226.3 ± 25 mg.100 g–1 (brand 10AB). Seçkin et al. (2005) studied some Turkish dairy products and found cholesterol contents in butters varying from 251.27 to 369.04 mg.100 g–1. Souci, Fachman and Kraut (2000) found higher cholesterol contents varying from 180 to 295 mg.100 g–1. Comparing the cholesterol contents found in this study with those reported by USDA (UNITED..., 2009) (215 mg.100 g–1) for salty butters brands, only the brands 7FB and 10AB had higher cholesterol contents. The French and Argentinean brands 7FB and 10AB, respectively, presented similar cholesterol values, as well as the Brazilian brands 2BB, 4BB, 5BB, and 6BB and the French brand 9FB and the brands 1BB, 3BB (Brazilian), 8FB (French), and 11AB (Argentinean). It can be observed from the high standard deviation that the brands of butter had great variation in the cholesterol contents between the batches evaluated; the standard deviations values found ranged from 21.5 (brand 11AB) to 44.7 (brand 2BB).
The total lipid contents varied from 81.8 ± 2.6 (brand 7FB) to 86.8 ± 4.6 g.100 g–1 (brand 3BB). The same can be observed for total lipid, contents which presented higher variations between the batches of brands 3BB and 4BB. The variations of the cholesterol and total lipid contents found among the batches of butter analyzed can be related with the breed, age, and diet of the cows. The total lipid contents found in the present study are within the limits established by the Codex Alimentarius and Brazilian legislation, which establishes the minimum of 80% (m.m–1) fat content for salty butter (CODEX ALIMENTARIUS, for 5 minutes and then programmed to increase at 5 °C.min–1 to
235 °C; the injector temperature was set at 270 °C; the detector temperature at 300 °C; and the injection volume was 1 µL. The carrier gas was hydrogen at a flow rate of 1 mL.min–1, and nitrogen was used as the make-up gas at 30 mL.min–1. The fatty acids were identified by comparison of the retention times of the sample with those of the standards and by spiking. A total of 37 saturated, monounsaturated, and polyunsaturated fatty acid standards (Sulpeco TM 37 FAME Mix 47885-U, U.S.A.) and conjugated linoleic acid standards (Sigma Chemical Company, St. Louis, MO, USA) were used to verify the identity and the accuracy of the method.Quantification was performed as area percentages, and the results were expressed in g.100 g–1 of sample.
2.3 Statistic analysis.
The results were submitted to analysis of variance (ANOVA). Tukey’s test was used to compare the means at a 5% significance level using the software Statistic for Windows 5.5 (StatSoft Inc., OK, USA).
3 Results and discussion
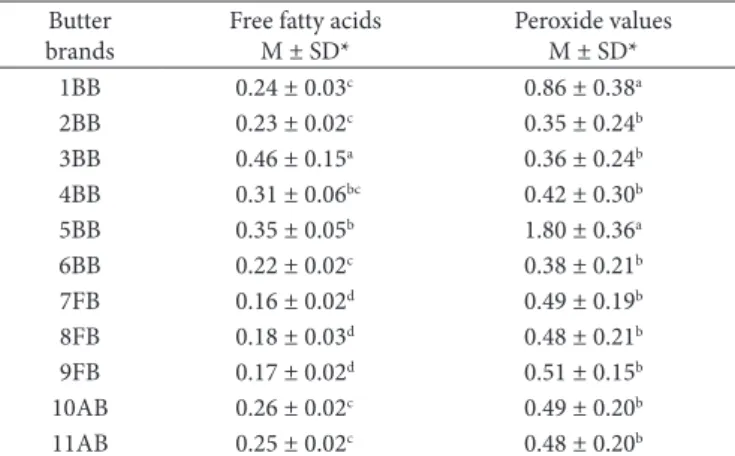
Table 1 shows the free fatty acids and peroxide value contents in the different brands of butter samples. The free fatty acids content were significantly different varying from 0.16 ± 0.02 (brand 7FB) to 0.46 ± 0.15 (brand 3BB). The peroxide value contents presented a variation of 0.35 ± 0.24 (brand 2BB) to 1.80 ± 0.36 meq.kg–1 (brand 5BB), being significantly different. The increased contents found in brand 5BB can be related with the type of packaging since this sample is the only one that was packaged in a plastic container without a protective cover, different from the others which were wrapped with aluminum foil, and covered with plastic film wrapping.
Of the brands of butter studied, only brand 5BB presented higher peroxide value content in relation to the maximum limit (1 meq.kg–1) established by the Brazilian legislation (BRASIL, 1996). Augusta and Santana (1998) evaluated the quality of
Table 1. Free fatty acids (g.100 g–1) and peroxide values (meq.kg–1)
contents of the different brands of butter.
Butter brands
Free fatty acids M ± SD*
Peroxide values M ± SD* 1BB 0.24 ± 0.03c 0.86 ± 0.38a 2BB 0.23 ± 0.02c 0.35 ± 0.24b 3BB 0.46 ± 0.15a 0.36 ± 0.24b 4BB 0.31 ± 0.06bc 0.42 ± 0.30b 5BB 0.35 ± 0.05b 1.80 ± 0.36a 6BB 0.22 ± 0.02c 0.38 ± 0.21b 7FB 0.16 ± 0.02d 0.49 ± 0.19b 8FB 0.18 ± 0.03d 0.48 ± 0.21b 9FB 0.17 ± 0.02d 0.51 ± 0.15b 10AB 0.26 ± 0.02c 0.49 ± 0.20b 11AB 0.25 ± 0.02c 0.48 ± 0.20b *Means and standard deviations of 66 samples in triplicate. Values in the same column with the same letter are not significantly different at the 5% level for the brands.
Table 2. Cholesterol (mg.100 g–1) and total lipid (g.100 g–1) contents
of the different brands of butter.
Butter brands
Cholesterol M ± SD*
cis-9, 12) is one of the major monounsaturated fatty acids, varying from 18.39 to 21.01 g.100 g–1. Brand 1BB showed lower monounsaturated fatty acid contents (21.65 g.100 g–1), while the highest content was found in brand 10AB (23.34 g.100 g–1). The concentrations of polyunsaturated fatty acids varied from 2.11 (brand 7FB) to 2.89 g.100 g–1 (brand 10AB).
Alonso, Braña e Bada (2004) studied the composition of fatty acids of milk fat and found values of saturated and unsaturated fatty acids varying from 67.17 to 70.54 g.100 g–1 and of 29.46 and 32.83 g.100 g–1, respectively, higher than the contents found in the present study. Seçkin et al. (2005) found saturated, monounsaturated, and polyunsaturated fatty acids contents in butters from 71.25, 27.70 and 0.38 g.100 g–1, respectively.
In terms of biological activity, cis-9, trans-11 octadecadienoic acid has been considered the most important CLA isomer since this isomeric derivative was the predominant isomer incorporated into the phospholipids of mouse forestomachs, rat livers, and mammary tumours (WERNER; LUEDECKE; 1971; BRASIL, 1996). The USDA (UNITED..., 2009) table shows
lipid contents for salty butters of 81.11 g.100 g–1, which is lower than that found in the present study. Seçkin et al. (2005) found a small variation between the total lipid contents, from 82 to 83 g.100 g–1. Souci, Fachman and Kraut (2000) found similar values of total lipids, varying from 82 to 86 g.100 g–1.
Tables 3, 4 and 5 present the fatty acid compositions (g.100 g–1) in the different brands analyzed. For the saturated fatty acids, the most abundant in the dairy products investigated were palmitic acid (C16:0), stearic acid (C18:0), and myristic acid (C14:0). Palmitic acid is one of the major saturated fatty acids; it raises serum cholesterol, while stearic acid does not (GRUNDY, 1997). Palmitic acid was found to have the highest level of saturated fatty acid in all samples. Generally, the butters analyzed had higher amounts of palmitic acid. Short-chain fatty acids, which are present in milk fat and diary, were found. The fatty acid composition showed no significant difference between the eleven brands analyzed. Brand 1BB showed lower saturated fatty acid contents (43.86 g.100 g–1), while the highest value was found in brand 7FB (52.74 g.100 g–1). Oleic acid (C18:1
Table 3. Fattyacid composition (g.100 g–1) of the different brands of butter.
Fatty acids
Brand 1BB M ± SD*
Brand 2BB M ± SD*
Brand 3BB M ± SD*
Brand 4BB M ± SD*
C4:0 0.67 ± 0.12a 0.69 ± 0.08a 0.58 ± 0.13a 0.67 ± 0.09a
C6:0 0.91 ± 0.13a 0.79 ± 0.09a 0.77 ± 0.09a 0.79 ± 0.08a
C8:0 0.68 ± 0.01a 0.60 ± 0.06a 0.59 ± 0.07a 0.57 ± 0.09a
C10:0 0.68 ± 0.09a 1.46 ± 0.11a 1.45 ± 0.20a 1.41 ± 0.20a
C11:0 0.17 ± 0.03a 0.12 ± 0.37a 0.13 ± 0.04a 0.14 ± 0.03a
C12:0 1.56 ± 0.79a 1.92 ± 0.40a 1.96 ± 0.24a 1.88 ± 0.25a
C13:0 0.09 ± 0.01a 0.04 ± 0.01a 0.08 ± 0.00a 0.08 ± 0.00a
C14:0 7.57 ± 0.70a 7.71 ± 0.73a 7.84 ± 0.40a 7.76 ± 0.55a
C14:1 0.71 ± 0.08a 0.58 ± 0.04a 0.60 ± 0.03a 0.72 ± 0.06a
C15:0 0.83 ± 0.08a 0.88 ± 0.09a 0.85 ± 0.03a 0.94 ± 0.02a
C16:0 23.77 ± 2.75a 24.11 ± 3.34a 24.60 ± 1.13a 25.01 ± 0.98a
C16:1 1.35 ± 0.16a 1.32 ± 0.14a 1.34 ± 0.02a 1.47 ± 0.14a
C17:0 0.58 ± 0.06a 0.62 ± 0.09a 0.60 ± 0.04a 0.70 ± 0.03a
C17:1 1.03 ± 0.95a 0.21 ± 0.09a 0.22 ± 0.02a 0.24 ± 0.01a
C18:0 6.18 ± 4.23a 11.34 ± 1.13a 11.09 ± 0.46a 10.31 ± 0.57a
C18:1n9 (trans-9, 12) 3.42 ± 1.75a 2.64 ± 0.47a 2.75 ± 0.27a 2.50 ± 0.17a C18:1n9 (cis-9, 12) 18.39 ± 2.84a 20.48 ± 1.69a 20.24 ± 0.63a 20.33 ± 0.54a C18:2n6 (trans-9, 12) 0.39 ± 0.38a 0.38 ± 0.07a 0.43 ± 0.15a 0.36 ± 0.05a C18:2n6 (cis-9, 12) 1.40 ± 0.61a 1.51 ± 0.11a 1.22 ± 0.11a 1.22 ± 0.13a
C20:0 0.14 ± 0.06a 0.15 ± 0.04a 0.15 ± 0.01a 0.15 ± 0.00a
C20:1 0.17 ± 0.02a 0.16 ± 0.07a 0.14 ± 0.03a 0.18 ± 0.01a
C18:3n3 (cis-9, 12, 15) 0.23 ± 0.08a 0.24 ± 0.06a 0.23 ± 0.04a 0.23 ± 0.07a CLA (cis-9, trans-11 isomer) 0.58 ± 0.18a 0.72 ± 0.11a 0.78 ± 0.08a 0.82 ± 0.18a
C22:0 0.03 ± 0.01a nd 0.03 ± 0.01a 0.04 ± 0.01a
C20:4n6 (cis-5, 8, 11, 14) 0.06 ± 0.02a 0.16 ± 0.04a 0.04 ± 0.01a 0.04 ± 0.01a
Saturated 43.86 50.43 50.72 50.45
Monounsaturated 21.65 22.75 22.54 22.94
Polyunsaturated 2.27 2.63 2.27 2.31
Total n6 2.04 2.39 2.04 2.08
Total n3 0.23 0.24 0.23 0.23
Total trans isomer 3.81 3.02 3.18 2.86
*Meansand standard deviations of 66 samples in quadruplicate. Values in the same line with the same letterare not significantly differentat the 5% level for the brands. CLA = Conjugated
found trans-isomers contents varying from 0 g.100 g–1 (zero) to 0.29 g.100 g–1 with 0.18 g.100 g–1 total fatty acid mean value. These values were lower than those found in this study.
Comparing the fatty acid contents obtained in this study with those reported by USDA (UNITED..., 2009), only brands 5BB and 7FB showed higher values for saturated fatty acids. All brands of butter studied presented monounsaturated fatty acid contents higher that the values reported by USDA (UNITED..., 2009) (21.02 g.100 g–1). The values of polyunsaturated fatty acids and CLA reported were, respectively, higher (3.04 g.100 g–1) and lower (0.27 g.100 g–1) than those found in the present study. Only brand 1BB butter presented values for trans isomer (3.81 g.100 g–1) higher than the those reported by USDA (UNITED..., 2009) (3.28 g.100 g–1). Souci, Fachman and Kraut (2000) found higher value for the short-chain fatty acids in comparison with those obtained in the present study, C4:0 (3.20 g.100 g–1) and C6:0 (2.09 g.100 g–1); therefore, similar values for C16:0 (22.5 g.100 g–1), C18:1n-9 (18.5 g.100 g–1), and C18:1n-9t (2.80 g.100 g–1).
SHULTZ, 1992). Therefore, the cis-9, trans-11 octadecadienoic acid was detected in this study. The concentrations of CLA varied from 0.56 (brand 7FB) to 0.86 g.100 g–1 (brand 10AB). Seçkin et al. (2005) found CLA content in butter varying from 0.55 to 0.79 g.100 g–1. Alonso, Braña e Bada (2004) studied the seasonal and regional influence in Spain on the composition of fatty acids of milk fat and found CLA values varying from 0.59 to 0.79 g.100 g–1. These values are similar to those found in this study.
The linolenic acid (C18:3ω3) was the only ω3 fatty acid found in the butter samples studied, varying from 0.23 to 0.27 g.100 g–1.
The trans fatty acid isomers C18:1n9 and C18:2n6 were detected in all samples analyzed. The greatest amounts of C18:1n9t were found in brand 1BB (3.42 g.100 g–1) and the smallest in brand 7FB (1.82 g.100 g–1). The C18:2n6t contents detected varied from 0.32 in brand 5BB to 0.47 g.100 g–1 in brand 10AB. The total trans isomer varied from 2.18 g.100 g–1 (brand 7FB) to 3.81 g.100 g–1 (brand 1BB). Seçkin et al. (2005)
Table 4. Fatty acid composition (g.100 g–1) of the different brands of butter.
Fatty acids
Brand 5BB M ± SD*
Brand 6BB M ± SD*
Brand 7BF M ± SD*
Brand 8BF M ± SD*
C4:0 0.79 ± 0.12a 0.69 ± 0.08a 0.74 ± 0.12a 0.72 ± 0.10a
C6:0 0.86 ± 0.16a 0.79 ± 0.09a 0.88 ± 0.13a 0.86 ± 0.11a
C8:0 0.63 ± 0.09a 0.60 ± 0.06a 0.66 ± 0.11a 0.65 ± 0.09a
C10:0 1.64 ± 0.28a 1.46 ± 0.11a 1.72 ± 0.42a 1.70 ± 0.39a
C11:0 0.13 ± 0.05a 0.12 ± 0.37a 0.15 ± 0.04a 0.14 ± 0.04a
C12:0 2.19 ± 0.37a 1.92 ± 0.40a 2.32 ± 0.54a 2.30 ± 0.51a
C13:0 0.10 ± 0.04a 0.04 ± 0.01a 0.10 ± 0.01a 0.09 ± 0.01a
C14:0 8.51 ± 0.85a 7.71 ± 0.73a 8.61 ± 1.37a 8.59 ± 1.23a
C14:1 0.64 ± 0.06a 0.58 ± 0.04a 0.71 ± 0.07a 0.72 ± 0.06a
C15:0 0.93 ± 0.06a 0.88 ± 0.09a 0.95 ± 0.04a 0.94 ± 0.05a
C16:0 25.21 ± 1.38a 24.11 ± 3.34a 26.60 ± 2.66a 26.32 ± 2.51a
C16:1 1.37 ± 0.08a 1.32 ± 0.14a 1.60 ± 0.05b 1.57 ± 0.04b
C17:0 0.61 ± 0.11a 0.62 ± 0.09a 0.64 ± 0.10a 0.63 ± 0.09a
C17:1 0.21 ± 0.07a 0.21 ± 0.09a 0.22 ± 0.06a 0.22 ± 0.05a
C18:0 10.54 ± 0.61a 11.34 ± 1.13a 9.05 ± 1.18a 9.10 ± 1.20a
C18:1n9 (trans-9, 12) 2.40 ± 1.00a 2.64 ± 0.47a 1.82 ± 0.43a 1.96 ± 0.43a C18:1n9 (cis-9, 12) 19.46 ± 1.25a 20.48 ± 1.69a 19.56 ± 2.51a 19.96 ± 2.41a C18:2n6 (trans-9, 12) 0.32 ± 0.15a 0.38 ± 0.07a 0.36 ± 0.10a 0.38 ± 0.08a C18:2n6 (cis-9, 12) 1.34 ± 0.78a 1.51 ± 0.11a 1.29 ± 0.07a 1.45 ± 0.08a
C20:0 0.13 ± 0.02a 0.15 ± 0.04a 0.29 ± 0.46a 0.25 ± 0.10a
C20:1 0.11 ± 0.03a 0.16 ± 0.07a 0.13 ± 0.03a 0.14 ± 0.03a
C18:3n3 (cis-9, 12, 15) 0.26 ± 0.06a 0.24 ± 0.06a 0.26 ± 0.07a 0.25 ± 0.05a CLA (cis-9, trans-11 isomer) 0.67 ± 0.21a 0.72 ± 0.11a 0.56 ± 0.19a 0.62 ± 0.19a
C22:0 nd nd 0.03 ± 0.01a 0.02 ± 0.01a
C20:4n6 (cis-5, 8, 11, 14) 0.04 ± 0.01a 0.16 ± 0.04a nd 0.12 ± 0.03a
Saturated 52.27 50.43 52.74 52.29
Monounsaturated 21.79 22.75 22.22 22.61
Polyunsaturated 2.31 2.63 2.11 2.44
Total n6 2.05 2.39 1.85 2.19
Total n3 0.26 0.24 0.26 0.25
Total trans isomer 2.72 3.02 2.18 2.34
References
ALONSO, L.; BRAÑA, J.; BADA, J. C. Seasoal and regional influences on the fatty acid composition of cow´s milk fat from Asturias, Spain.
Grasas y Aceites, v. 55, p. 169-173, 2004. http://dx.doi.org/10.3989/
gya.2004.v55.i2.163
AMERICAN OIL CHEMISTS SOCIETY – AOCS. Official methods
and recommended practices of the AOCS. 5th ed. Champaign:
AOCS, 2004a. Method Ca 5a-40.
AMERICAN OIL CHEMISTS SOCIETY – AOCS. Official methods
and recommended practices of the AOCS. 5th ed. Champaign:
AOCS, 2004b. Method Cd 8b-90.
AUGUSTA, I. M.; SANTANA, D. M. N. Avaliação da qualidade de manteigas tipo extra comercializadas no Estado do Rio de Janeiro.
Ciência e Tecnologia de Alimentos, v. 18, n. 4, p. 35-41, 1998.
http://dx.doi.org/10.1590/S0101-20611998000400003
BANKS, W.; MUIR, D. D. The compositional quality of milk. Hannah Research Institute Report, 1981.
4 Conclusions
The studied brands of butter met the requirements of the Technical Regulation of Identity and Butter Quality of the Ministry of the Agriculture in Brazil, with exception of one brand only, which presented higher peroxide value than the maximum limit established by the present legislation. The two international butter brands studied presented highest cholesterol contents. There was no great variation for the lipid total contents the composition of fatty acids. There was no significant difference between the analyzed samples showing that there was no seasonal and regional influences on the lipid fraction of the samples studied.
Acknowledgements
The authors wish to thank the Conselho Nacional de Desenvolvimento Científico e Tecnológico (CNPq) for the support.
Table 5. Fatty acid composition (g.100 g–1) of the different brands of butter.
Fatty acids
Brand 9BF M ± SD*
Brand 10AB M ± SD*
Brand M ± SD*
C4:0 0.70 ± 0.10a 0.66 ± 0.05a 0.68 ± 0.08a
C6:0 0.85 ± 0.12a 0.82 ± 0.09a 0.84 ± 0.10a
C8:0 0.64 ± 0.09a 0.59 ± 0.09a 0.62 ± 0.08a
C10:0 1.69 ± 0.40a 1.56 ± 0.27a 1.59 ± 0.37a
C11:0 0.15 ± 0.04a 0.16 ± 0.03a 0.15 ± 0.03a
C12:0 2.28 ± 0.54a 2.04 ± 0.34a 2.14 ± 0.24a
C13:0 0.10 ± 0.01a 0.10 ± 0.03a 0.10 ± 0.03a
C14:0 8.48 ± 1.20a 7.73 ± 0.86a 8.13 ± 0.56a
C14:1 0.69 ± 0.06a 0.62 ± 0.08a 0.65 ± 0.07a
C15:0 0.91 ± 0.07a 0.89 ± 0.03a 0.88 ± 0.05a
C16:0 26.28 ± 2.18a 23.10 ± 1.21a 24.80 ± 1.44a
C16:1 1.49 ± 0.06 b 1.33 ± 0.06a 1.43 ± 0.04a
C17:0 0.61 ± 0.09a 0.60 ± 0.03a 0.62 ± 0.05a
C17:1 0.22 ± 0.06a 0.23 ± 0.02a 0.24 ± 0.02a
C18:0 9.15 ± 1.11a 10.86 ± 0.86a 10.31 ± 0.97a
C18:1n9 (trans-9, 12) 2.15 ± 0.33a 2.66 ± 0.42a 2.52 ± 0.32a
C18:1n9 (cis-9, 12) 20.08 ± 1.41a 21.01 ± 1.22a 20.72 ± 1.13a
C18:2n6 (trans-9, 12) 0.39 ± 0.11a 0.47 ± 0.08a 0.45 ± 0.06a
C18:2n6 (cis-9, 12) 1.56 ± 0.17a 1.70 ± 0.11a 1.59 ± 0.13a
C20:0 0.19 ± 0.06a 0.13 ± 0.03a 0.15 ± 0.04a
C20:1 0.13 ± 0.03a 0.15 ± 0.01a 0.14 ± 0.02a
C18:3n3 (cis-9, 12, 15) 0.26 ± 0.07a 0.27 ± 0.07a 0.25 ± 0.05a
CLA (cis-9, trans-11 isomer) 0.65 ± 0.09a 0.86 ± 0.18a 0.73 ± 0.16a
C22:0 0.03 ± 0.01a 0.04 ± 0.01a 0.03 ± 0.01a
C20:4n6 (cis-5, 8, 11, 14) 0.05 ± 0.01a 0.06 ± 0.02a 0.05 ± 0.02a
Saturated 52.06 49.28 51.04
Monounsaturated 22.61 23.34 23.18
Polyunsaturated 2.52 2.89 2.62
Total n6 2.26 2.62 2.37
Total n3 0.26 0.27 0.25
Total trans isomer 2.54 3.13 2.97
HARTMAN, L.; LAGO, R. C. A. Rapid preparation of fatty acid methyl esters from lipids. Laboratory Practices, v. 22, p. 475-481, 1973. HINRICHS, J.; HEINEMAN, U.; KESSLER, H. G. Defferences in
the composition of triglycerides in summer and winter milk fat.
Milchwissenschaft, v. 47, p. 495-498, 1992.
I N T E R N A T I O N A L O R G A N I Z A T I O N F O R STANDARDIZATION - ISO. ISO Norm TC 34/SC 5: Butter - Determination of fat content (Direct method). Geneva: ISO, 2000.
KUMAR, N.; SINGHAL, O. P. Cholesterol oxides and atherosclerosis: A review. Journal of the Science of Food and Agriculture, v. 55, p. 497-510, 1991. http://dx.doi.org/10.1002/jsfa.2740550402 JUÁREZ, M.; ALONSO, L.; RAMOS, M. Lipólisis y proteolisis del
queso de Cabrales durante la maduración. Revista de Agroquimica
y Tecnología de Alimentos, v. 23, p. 541-551, 1983.
MAZALLI, M. R.; SALDANHA, T.; BRAGAGNOLO, N. Determinação de colesterol em ovos: comparação entre um método enzimático e um método por cromatografia líquida de alta eficiência. Revista
do Instituto Adolfo Lutz, v. 62, n. 1, p. 49-53, 2003.
O’SHEA, M. et al. Conjugated linoleic acid in bovine milk fat: a food-based approach to cancer chemoprevention. Trends in
Food Science & Technology, v. 9, p. 192-196, 1998. http://dx.doi.
org/10.1016/S0924-2244(98)00036-3
PARIZA, M. W.; HA, Y. L. Conjugated dienoic derivatives of linoleic acid: a new class of anticarcinogens. Medical Oncology Tumor
Pharmacology, v. 7, p. 169-171, 1990.
SEÇKIN, A. K. et al. Conjugated linoleic acid (CLA) concentration, fatty acid composition and cholesterol content of some Turkish dairy products. LWT- Food Science and Technology, v. 38, p. 909-915, 2005.
SOUCI, S. W.; FACHMAN, W.; KRAUT, H. Food composition and
nutrition tables. 6th ed. Medpharm Scientific Publishers, 2000.
p. 161-162.
UNITED STATES DEPARTMENT OF AGRICULTURE – USDA.
Nutrient Database for Standart Reference. Release 18. Nutrient
data Laboratory Home Page. 2009. Disponível em: <http://www. nal.usda.gov/fnic.foodcomp/Data>.
WERNER, S. A.; LUEDECKE, L. O.; SHULTZ, T. D. Determination of conjugated linoleic acid content and isomer distribuition in three Cheddar-type cheeses: effects of cheese cultures, processing, and aging. Journal of Agriculture and Food Chemistry, v. 40, p. 1817-1821, 1992. http://dx.doi.org/10.1021/jf00022a017 BAUMAN, D. E. et al. Biosynthesis of conjugated linoleic acid in
ruminants. Proceedings of the American Society of Animal
Science, v.41, p. 215-227, 2001. p. 1-15.
BLACK, R. G. Fatty acid composition of Victorian milk fat.
The Dairy Technologist. Gilbert Chandlerl Institute of Dairy
Technology, 1985. p. 48-52.
BRASIL. Ministério da Agricultura. Portaria nº146, de 07 de março de 1996. Aprova os Regulamentos Técnicos de Identidade e Qualidade dos Produtos Lácteos. Diário Oficial da República
Fderativa do Brasil, Brasília, DF, 11 mar. 1996.
CARDAK, A. D.; YETISMEYEN, A.; BRUCKNER, H. Quantitative comparison of camel, goat and cow milk fatty acids.
Milchwissenschaft, v. 58, n. 1-2, p. 34-36, 2003.
CLAPPERTON, J. L.; BANKS, W. Factors affecting the yield of milk and its constituents, particularly fatty acids, when dairy cows consume diets containing added fat. Journal of the Science of Food and
Agriculture, v. 36, p. 1205-1212, 1985. http://dx.doi.org/10.1002/
jsfa.2740361202
CODEX ALIMENTARIUS. Codex Standard for Butter. Codex Standard 279-1971 Fomerly Codex Stan A-1-1971. Adopted in 1971. Revision 1999. Amendment 2003, 2006. Disponível em: <http://www.codexalimentarius.net/web/index_en.jsp>. Accesso em: mar. 2009.
COLLINS, Y. F.; McSWEENEY, P. L. H.; WILKINSON, M. G. Lipolysis and free fatty acid catabolism in cheese: a review of current knowledge. International Dairy Journal, v. 13, n. 11, p. 841-866, 2003. http://dx.doi.org/10.1016/S0958-6946(03)00109-2 DASHTI, B. et al. Fatty acid profile and colesterol content of 32
selected dishes in the satate of Kuwait. Food Chemistry, v. 80, p. 377-386, 2003. http://dx.doi.org/10.1016/S0308-8146(02)00277-7 FLETOURIS, D. J. et al. Rapid determination of cholesterol in
milk and milk products by direct saponification and capillary gas chromatography. Journal of Dairy Science, v. 81, p. 2833-2840, 1998. http://dx.doi.org/10.3168/jds.S0022-0302(98)75842-4 GRUMMER, R. R. Effect of feed on the composition of milk. Journal of
Dairy Science, v. 74, p. 3244-3256, 1991. http://dx.doi.org/10.3168/
jds.S0022-0302(91)78510-X
GRUNDY, S. M. What is the desirable ratio of saturated, polyunsaturated, and monounsaturated fatty acids in the diet? American Journal of
Clinical Nutrition, v. 66, p. 988-990, 1997.
GURSOY, O. et al. Conjugated linoleic acid (CLA) content of most popular Turkish hard and soft cheeses. Milchwissenschaft, v. 58, n. 11-12, p. 622-623, 2003.
HARGROVE, G. L.; MBAH, D. A.; ROSEMBERG, J. L. Genetic and environmental influences on milk and milk component production.
Journal of Dairy Science, v. 64, p. 1593-1597, 1981. http://dx.doi.