Repositório ISCTE-IUL
Deposited in Repositório ISCTE-IUL:
2019-03-21Deposited version:
Post-printPeer-review status of attached file:
Peer-reviewedCitation for published item:
Costa, P. M., Bento, N. & Marques, V. (2017). The impact of regulation on a firm's incentives to invest in emergent smart grid technologies. Energy Journal. 38 (2), 149-174
Further information on publisher's website:
10.5547/01956574.38.2.pcosPublisher's copyright statement:
This is the peer reviewed version of the following article: Costa, P. M., Bento, N. & Marques, V. (2017). The impact of regulation on a firm's incentives to invest in emergent smart grid technologies. Energy Journal. 38 (2), 149-174, which has been published in final form at
https://dx.doi.org/10.5547/01956574.38.2.pcos. This article may be used for non-commercial purposes in accordance with the Publisher's Terms and Conditions for self-archiving.
Use policy
Creative Commons CC BY 4.0
The full-text may be used and/or reproduced, and given to third parties in any format or medium, without prior permission or charge, for personal research or study, educational, or not-for-profit purposes provided that:
• a full bibliographic reference is made to the original source • a link is made to the metadata record in the Repository • the full-text is not changed in any way
The full-text must not be sold in any format or medium without the formal permission of the copyright holders.
Serviços de Informação e Documentação, Instituto Universitário de Lisboa (ISCTE-IUL) Av. das Forças Armadas, Edifício II, 1649-026 Lisboa Portugal
Phone: +(351) 217 903 024 | e-mail: administrador.repositorio@iscte-iul.pt https://repositorio.iscte-iul.pt
1
The Impact of Regulation on a Firm's Incentives to Invest
in Emergent Smart Grid Technologies
Paulo Moisés Costa
a,*, Nuno Bento
b, Vítor Marques
ca Escola Superior de Tecnologia e Gestão and Center for Studies in Education,Technologies and Health (CI&DETS), Instituto Politécnico de Viseu, Campus Politécnico de Repeses, 3500 Viseu, Portugal and "INESC TEC – INESC Technology and Science (formerly INESC Porto), Rua Dr. Roberto Frias, Porto, Portugal
b Sustainability Science Program, Kennedy School of Government, Harvard University, Mailbox 117, 79 JFK Street, Cambridge, MA 02138 United States; Instituto Universitário de Lisboa (ISCTE-IUL), DINÂMIA’CET-IUL, Av. das Forças Armadas, 1649-026 Lisboa, Portugal
c Entidade Reguladora dos Serviços Energéticos - ERSE, Rua Dom Cristóvão da Gama, n.º 1, 1400-113, Lisboa Portugal. * Corresponding author. Tel.: (351) 232480524; Fax: (351) 232424651; Email: paulomoises@estv.ipv.pt (P. Moisés Costa)
Disclaimer: The results and comments presented in this paper are entirely the authors’ responsibility and should not be in any way associated to the official opinions of ERSE or other institution.
Abstract
This paper analyzes the implementation of new technologies in network industries through the
development of a suitable regulatory scheme. The analysis focuses on Smart Grid (SG) technologies which,
among others benefits, could save operational costs and reduce the need for further conventional
investments in the grid. In spite of the benefits that may result from their implementation, the adoption
of SGs by network operators can be hampered by the uncertainties surrounding actual performances. A
decision model has been developed to assess the firms’ incentives to invest in “smart” technologies under
different regulatory schemes. The model also enables testing the impact of uncertainties on the reduction
of operational costs, and of conventional investments. Under certain circumstances, it may be justified to
support the development and early deployment of emerging innovations that have a high potential to
ameliorate the efficiency of the electricity system, but whose adoption face many uncertainties.
Keywords: Incentive regulation; Infrastructure; Investment; Smart grids.
2
1. Introduction
The adoption of innovations in energy network industries, a historically conservative business performed in a monopoly environment, can be hindered by the technological risk associated to new technologies. Smart Grids (SGs) are an example of such innovations, which can save on operational costs and defer the need for further investments in electrical networks. Power systems are currently challenged by the increasing penetration of distributed energy resources such as: distributed generation (DG), distributed storage, electric vehicles and active demand response (Ruester et al., 2013; Gómez et al., 2011). The integration of such distributed resources is gradually shifting passive distribution systems towards more active and smarter systems, in which distribution system operators (DSOs) become increasingly important (CEER, 2015). The implementation of SGs can contribute decisively towards facilitating the transformation of the distribution network, specifically in what refers to the absorption of larger quantities of intermittent local energy resources and in the management of the electricity demand (Frias et al., 2009).
The concept of SG encompasses a set of technologies that raise the intelligence of the networks, such as smart meters at the consumer level or instruments for the capture, transmission and storage of data, as well as control devices at the level of the transmission and distribution networks (CEER, 2014; European Commission, 2012a).
Among other benefits, SGs would contribute to improve the quality of the service, as well as to promote the emergence of new business models, namely related to demand-side management and dynamic pricing of electricity (Bergaentzlé et al., 2014; Bergaentzlé and Clastres, 2013; Faruqui et al., 2014; Faruqui and Sergici, 2010; Greening, 2010). The control of non-technical energy losses (e.g. electricity thefts) is another potential benefit of this technology, which may be an important advantage even in western countries (Lo Schiavo et al., 2013). Hence, the adoption of such technologies can help European countries in their pursuit of the objectives on climate change, renewable energy penetration and energy efficiency (Pollitt, 2012; Clastres, 2011).
Despite the potential benefits, SGs are still surrounded by many technical, economic and institutional challenges that slow down their deployment (Chao, 2012). Most of these technologies are already in a pre-commercialization stage, presenting some technological risk1 (Komor et al., 2014). Investment in SGs can also be quite complex because it requires the coordination of complementary projects, such as the deployment of devices in millions of houses and
1 Uncertainty and risk are used as synonyms throughout this paper, although we acknowledge that there is a difference between
these two terms. The typical classification uses the terminology of Knight (1921) who mainly distinguishes risk and uncertainty by the possibility of the former to quantify the levels of uncertainty.
3
upgrading an extensive electrical network (Agrell and Bogetoft, 2011). Thus, the transformation of the entire system is likely to take several years, if not decades, according to previous experiences with transitions in energy systems (see Grubler, 2012) and a number of specific studies on SGs (European Commission, 2012b; Faruqui et al., 2010).
The performances of these new technologies, particularly related to the reduction of costs, are still unknown in many cases.2 It is difficult to estimate the impact that SGs will have on operational costs, as well as on deferring large capital investments in the grid through the increase of distributed generation, demand response, energy efficiency and storage (Poudineh and Jamasb, 2014).3 The rhythm of development of these distributed energy resources also has an effect in the value of the new “smarter” infrastructure. For instance, demand response (DR) can help system operators to integrate increasing intermittent generation as well as to flatten the load diagram of the networks, allowing to defer the need for costly investments in the expansion of the electrical system (Jeon et al, 2015a, 2015b; Moslehi and Kumar, 2010). A number of markets in the U.S. are already negotiating DR, and in some cases this is becoming a significant market resource (Rahimi and Ipakchi, 2010).4 Still, it is difficult to predict the evolution of active demand management, which typically requires the installation of smart meters.5 Additionally, the benefits from investing in SGs might not be fully appropriated by the agent who bears the cost.6 For example, the implementation of SGs in distribution networks can produce positive externalities for the entire electricity system, such as the interconnection of more distributed generation (Anaya and Pollitt, 2015a) and active participation of demand. This may collide with DSO interests (Agrell and Bogetoft, 2011), unless there is an incentive such as the smart connection incentive for the DSO to connect more DG (cf. Anaya and Pollitt, 2005b) or even a regulatory reform that turn the DSO into a distributed system platform provider with increasing control over distributed energy resources like in the New York’s “Reforming the Energy Vision” (REV) approach.7
2 As Joskow (2012, p.7) alerts: “Readers should be warned in advance that there is often more hope than evidence about both the
cost and value of smart grid opportunities and that except in a few areas there exists relatively little serious economic analysis of costs and benefits.”
3
Other potential benefits of the investment in smart grids have the characteristics of externalities and public goods that are more difficult to quantify, e.g.: reductions of losses and of CO2 emissions, enabler of the diffusion of new end-use innovations like
electric vehicles and other ancillary services.
4
In May 2014, 11GW of “negawatts” were transitioned at the PJM (America’s largest wholesale electricity market), replacing capacity that would otherwise have to be produced by conventional power plants. The revenue generated from this scheme, based on demand response and efficiency savings, was estimated at $16 billion in 2014 (The Economist, 2015).
5
Léautier (2014) analyzes the benefits of the deployment of smart meters in terms of the gains for consumers by switching to real time pricing. Using data from the French power market, the estimated net surplus for a vast majority of the consumers (peak demand lower than 6 kVA) is no more than 1€/year for low demand elasticity, 4€/year for high elasticity. This finding raises serious questions on the economic value of rolling out smart meters to all the residential customers.
6See a discussion on the distribution of SG’s benefits and costs in Meeus et al. (2010). 7
4
In order to overcome inertia and start implementing “smart” technologies in the networks, a suitable regulatory scheme is necessary, including mechanisms capable of stimulating investment. This comes at a time when “incentive regulation” mechanisms have replaced “cost of service” or “rate of return” regulation of networks in many countries (Vogelsang, 2012, Joskow, 2008).
The effect of “incentive regulation"on investments in infrastructure and innovation has been the object of a growing literature (Crew and Kleindorfer, 2002; Guthrie, 2006; Vogelsang, 2012; Joskow 2008, 2014). Some authors argue that “incentive regulation” has a positive impact in promoting innovation because it provides a suitable framework for costs reduction and efficiency improvements (Armstrong et al., 1994; Littlechild, 2006). Others, point out the negative effects in terms of innovative activities like research and development (R&D), for which a cost-based regulation would provide more stability to promote uncertain investments (Kahn et al., 1999). The sparse empirical literature on the electricity sector shows evidence of a decline in R&D expenditures after the establishment of a price-cap regulation (Jamasb and Pollitt, 2008; Joskow, 2008). However, the debate on the effect of cost-based versus price-based regulation in the rate of technological change requires further research (Jamasb and Pollitt, 2015, 2008; Bauknecht, 2011; Armstrong and Sappington, 2006).
The novelty with SGs, compared to previous investments in network innovations, is the more disembodied character of the technology that relies heavily on software and information and communication technologies (ICT). The investment in such technologies may result in a lower regulatory asset base (RAB), reducing the regulated firm’s incentives to adopt these technologies (Lo Schiavo et al., 2013; Pérez-Arriaga, 2010; Joskow, 2008).8 Thus, it raises important questions as the regulated firm may be more concerned with the eventual reduction of its allowed expenses in the future than with the operational gains from the adoption of these innovations. This issue is likely to be amplified by the risks typically associated with the adoption of new types of technologies, for which the costs are highly uncertain and demand response is hard to predict (Vogelsang, 2012; Evans and Guthrie, 2006).
The present analysis contributes to the literature by examining the changes in a firm’s economic incentives to invest in new “smart” technologies for electricity networks under different types of regulation. Grid operators, on the one hand, seek to maximize their allowed revenues, which within a context of a natural monopoly also determine its profitability. The regulator, on the other hand, aims to reduce the costs of regulated activities, as well as to ameliorate
8 Even though regulatory efficiency targets are applied to total expenditures which include investment costs, the value of the RAB
5
the quality of the service. Hence, the investment in emergent smart grid technologies in the network can be incentivized as a mean to achieve these goals in the future.
This paper progresses over a previous decision model developed by the authors (Marques et al., 2014), based on foreseen discounted cash flows like in Guthrie (2006), by explicitly dealing with the uncertainties surrounding the expected performances of an immature technology. Specifically, the model evaluates the economic incentives for the firm to undertake projects with the potential to reduce both capital and operational costs (other benefits with externalities and public goods nature are not considered in the present version of the model).
The analysis is further refined in order to understand how uncertainties on the reduction of both operational costs and conventional capital can affect investment in SGs. A new tool is therefore proposed that can be used by both regulators and firms to analyze the attractiveness of a wide range of investments in new technologies with the characteristics of SGs.
The remainder of the article is organized as follows. Section 2 examines the regulative obstacles faced by the investment in SGs. Section 3 describes the decision model that is used to find the most suitable regulatory scheme regarding the adoption of “smart” technologies in the grid. Section 4 analyzes the effect of technological uncertainty in the firm’s incentives to invest. Finally, Section 5 concludes with a discussion of the main findings and limits, and presents some implications for the policy.
2. Why should regulation evolve?
There is an increasing agreement in the literature that current regulation is unlikely to meet the new challenges raised by “smart” technologies (Lo Schiavo et al., 2013). This might be explained by three main orders of reasons.
Firstly, the more immaterial and less-capital intensive nature of SGs may be unattractive for network operators, who would prefer to invest in assets that enlarge their RAB (Pérez-Arriaga, 2010). Evidence of little incentives for the DSO to invest in SGs instead of conventional “copper and iron” investments was found in the cases of Germany (Nykamp et al., 2012) and Austria (Prüggler & Bremberger, 2011). The cost structure is expected to change with the deployment of SGs – towards a more significant weight of operational expenditures in overall costs - which has to be taken into account in the calculation of grid tariffs in the future (CEER, 2015). In addition, the performance indicators that monitor and reward system’s operators for reliability of service are also likely to evolve to grasp the new
6
constraints of the system (e.g. higher share of distributed generation) (Cossent, 2013). This creates more uncertainties for the regulated firm in terms of the evolution of costs and revenues in the future.
Secondly, the investment in SGs is surrounded by many uncertainties, namely regarding investment costs and the actual performances of such technologies. For instance, the new services permitted by the technology - e.g. automation, remote control, dynamic pricing - will have an impact that is hard to forecast. In addition, the majority of the investments are irreversible, increasing the risk of slow penetration and low capacity utilization in initial years (Evans and Guthrie, 2006). Therefore, the uncertainty on the potential benefits and costs of these innovations calls for some explicit support from the regulator (Cossent et al., 2013; Frias et al., 2009). In practice, innovation has been supported in different ways through the adoption of input-based incentives (e.g. including R&D and demonstration costs in the RAB, enlarging the time before requiring efficiency gain) or output-based incentives (e.g. definition of targets for innovation measures). Lo Schiavo et al. (2013) present the measures implemented in Italy to promote the roll-out of smart meters and other innovations in the grid, comprising mandatory roll-out of smart meters with investments recognized in the metering tariff and remunerated with a higher interest rate. Müller (2011) compares the cases of the United Kingdom, Norway and the Netherlands. The case of the United Kingdom has received special attention because of its focus on outputs with the introduction of the RIIO model (i.e. revenues being dependent on a formula that comprises the introduction of innovations, performance increases and delivery of the required output). Meeus and Saguan (2011) review the case of Scotland where the UK’s Innovation Funding Incentive (IFI)9 was used to deploy nearly mature technologies, such as active network management technologies in the Orkney Isles. Finally, Marques et al. (2014) analyze the case of Portugal, where a premium on the rate of return was coupled with efficiency targets to remunerate operational costs (OPEX) of innovative investments over the 2012-2014 regulatory period. The first results show that the scheme was unable to increase investment in such assets and reveal the difficulty of balancing more stringent efficiency requirements in order to incentivize network investments with practical obstacles faced when implementing SGs.
Thirdly, the complexity of smart technologies requires the coordination of the decisions of many actors and the internalization of potential benefits (i.e. externalities) for the electricity system. Agrell et al. (2013) sustain that some of the investments in SGs are clearly complementary and require a coordinated implementation. For instance, the
9 More specifically, under the Registered Power Zone (RPZ) mechanism which in 2010 has been substituted by Low Carbon
7
adoption of automated load controls would need the installation of several components (i.e. demand side management technologies and services, adequate (smart) metering and information transmission) in order to be effective. The economic literature has a large range of studies on technology adoption in case of strong network externalities and, specifically, on situations featured by private incentives that differ from social incentives (Katz and Shapiro, 1985; Economides, 1996). Actors, particularly the network operators, can be reluctant to adopt a new superior technology fearing they will be isolated in their choice and bear most of the costs of incompatibility with the established infrastructure (Farrell and Klemperer, 2006). This provokes an “excess of inertia” in the transition towards a better technology (Farrell and Saloner, 1985, 1986).10 Hence, early adoption has typically inherent public good that should be incentivized in order to deploy innovative solutions – although these measures can conflict with the allocative efficiency objective that is becoming a critical issue for regulators due to increasing energy prices.
The barriers and uncertainties surrounding the implementation of SGs call for an explicit support of the initial investments (Lo Schiavo et al., 2013; Pérez-Arriaga, 2010). Regulation should, therefore, evolve in order to incentivize the deployment of these technologies without creating economic rents. An important and not straightforward issue is related to the decision about the part of the SG investments that should be included in the regulatory sphere, i.e., whose cost is recovered through the system charge payed by consumers. Some regulatory authorities argue that investments that can be performed by the market should not be included in the protected regulatory sphere (CEER, 2015). In some cases that includes the deployment of smart meters like in Germany (BNetzA, 2011), or the connection of distributed generation like in the UK (Anaya and Pollitt, 2015a, 2015b). Another issue is the sharing of the system charges, including the cost with the deployment of new SG innovations, among the grid users. In many instances, pricing schemes may not be currently adapted to the public good nature of some smart grid investments leading to cross-subsidization between network users. For instance, Jeon et al. (2015) found that the owners of storage technologies such as thermal storage and Plug-in Hybrid Electric Vehicles (PHEV) – which can save system costs by helping to manage the peaks periods – pay more system charges under a cost sharing based on the proportion to load served. The reform of the pricing scheme is however left aside of this paper in order to focus on the incentives to invest in emergent smart innovations for the grid. This paper provides a tool that can be used by both regulators and network operators to assess the effect of different regulatory designs on the investments included in the regulatory sphere.
10 The opposite effect (i.e. excess of momentum) can also happen when the private incentives for technological change are higher
than social incentives and the transition to the new standard is made too rapidly that creates stranded costs associated with the older infrastructure (Farrell and Saloner, 1986).
8
3. Theoretical framework and model
3.1 Literature review
The effect of regulation on investment decisions has been the object of growing literature.11 The seminal paper of Harvey Averch and Leland Johnson (Averch and Johnson, 1962) shows that a typical rate of return regulation provides few incentives for a regulated firm to improve its productive efficiency, and leads to overinvestment because the firm’s decisions are driven by the allowed return on investments rather than on long run marginal costs. Vogelsang (2012) noted that this (overinvestment) effect only holds for an allowed rate of return between the cost of capital and the monopoly rate. This conceptualization provided the theoretical basis for the general movement of change from a traditional rate of return regulation to incentive regulation in several sectors (e.g. telecommunication, energy) in the past three decades (Crew and Kleindorfer, 2002; Vogelsang, 2002; Joskow, 2014).
The theoretical literature suggests that regulation impacts a firm’s investment decisions differently, depending on the type of projects. Cabral and Riordan (1989) demonstrated that incentive regulation has a positive effect in cost-reducing investments. Biglaiser and Riordan (2000) concluded that this effect would depend on the length of the regulatory cycle and is more likely to occur in the early years of a new cycle. Other studies found that this relationship is subject to the level of the price-cap, meaning that a low price-cap would provide little incentive for cost-reducing investments (Nagel and Rammerstorfer, 2008; Roques and Savvas, 2009).12 On the other hand, rate of return regulation can provide stronger incentives to invest in new infrastructures by guaranteeing the return on the asset base, which considerably reduces the risks faced by the firm, and thus, the costs of capital. Incentive regulation provides weaker incentives in these terms, mainly due to regulatory opportunism, since the regulatory period is normally shorter than the economic life of the infrastructures (Evans and Guthrie, 2006; Gilbert and Newbery, 1994) – although SGs can include assets like ICT technologies that have a shorter lifetime than conventional investments
.
Thus, the implications of rate of return and incentive regulations on investment would depend on the way that regulators execute them in practice and on the level of regulatory commitment (Vogelsang, 2012).11 For reviews of the literature on regulation and investment, see: Vogelsang (2012) and Guthrie (2006). Joskow (2008, 2014)
provides a survey of the implementation of incentive regulation in the energy industry.
12 The two last studies use real-option approach which typically increases the “value of wait” with the irreversibility and
9
The empirical evidence on the relationship between regulation and investment is sparse and mainly focused on the telecom sector. Greenstein et al. (1995) and Ai and Sappington (2002) show that incentive regulation accelerated the modernization of U.S. telecom networks, but the largest part of the investments was for cost-reducing purposes. More recently, Cambini and Rondi (2010) show that, in European energy utilities, the investment rates in cost reduction are greater under incentive regulation than under rate of return regulation. However, the authors only focus on the five largest European economies and for the period between 1997 and 2007. This coincides with the early development of incentive regulation in Europe.
Finally, the literature points out the particular effects of different forms of regulation for innovative network investments. The lack of experience with the new technology and the uncertainties on both costs and utilization, increase the risk of the investment, lowering the expected investment returns. In these cases, the typical price constraints of an incentive regulation are likely to truncate the distribution of uncertain investment outcomes, which reduces the attractiveness of the investment (Vogelsang, 2012). This effect can be studied in more detail with the help of a decision model that explicitly takes into account different regulatory schemes.
3.2 The model
The present paper aims to improve the understanding about the investment in new cost saving technologies (featuring technological risk) for the electricity networks, under different types of regulation. The proposed decision model extends Guthrie’s model (Guthrie, 2006), which analyzes the impact of regulatory schemes on the firm’s decision to make irreversible investments in CAPEX that may decrease OPEX. The original model shows that the choice between pure cost plus and pure incentive regulations can be described using two variables: i) the proportion γ of the investment expenditure that is accrued on the firm’s RAB after the next price review, T; and ii) the proportion α of the cost savings that is transferred to consumers after T. Thus, when γ = α = 0, the regulatory scheme is a pure incentive regulation approach, whereas when γ = α = 1 the regulatory scheme is a pure cost of service regulation. In this framework, a firm will not invest in a “socially optimal” cost reducing project when α > γ, i.e. when the share of operational gains that revert to consumers is higher that the percentage of the investment that accrues to the RAB.
Let us now refine this model in order to provide an analytical tool that is capable of dissecting the economic incentives of a regulated firm to adopt new technologies like SG technologies, which can reduce both OPEX and future CAPEX. The deduction of such a general model, that recreates a typical input based regulatory framework applied to
10
natural monopolies, was presented by the authors in a separate paper (Marques et al., 2014). The main features of this model are highlighted in the following paragraphs. The scope of the analysis is then further enriched by explicitly examining the impact of technological uncertainty on decision making.
The present value of an investment of this kind, when the first price review has occurred in period T, is:
-I + ∑
∆+ ∑
∆+ ∑
-∆ - ∆ =−!
"#+
∆$%&1 −
'% () +
∆*%+&1 −
%() +
,% (!
"#− ∆!
$ (1)where all the parameters included in the model are summarized in Table 1. Table 1. List of parameters
Parameter Description
T is the period until the next regulatory review (in years)
α is the proportion of the cost savings that is transferred to consumers after T
γ is the proportion of the investment expenditure that is accrued on the firm’s RAB (i.e. regulatory asset base) after T
ΔC is the decrease in operational costs ISG is the amount invested in SG technology
ΔIc is the reduction of conventional investment due to SG investment
r is the firm’s cost of capital
rIsg is the regulated remuneration rate for investment in SG, as so r = δr , where / is a measure of the rate
premium
rIc is the regulated remuneration rate for conventional investment
Β is the operational cost avoided expressed in terms of the percentage of the initial SG investment ρ is the capital cost avoided expressed in terms of the percentage of the initial SG investment
In this case, a firm will invest when:
∆0 + ∆!
$+ &
%, *123∆*+ 3 '∆$ ∆*+% (
) ≥ 5!
"# (2)Hence, the motivation of the firm to invest is positively affected by the reduction of operating costs, i.e. higher operational gains ∆C.On the contrary, the investment decision is negatively affected by: i) the share of costs saving that are transferred to consumers, α ; and ii) the cost of capital, r (notice that γ ≤ 1).
11
The effect on the firm’s incentives during different regulatory periods, T, is not straightforward and further depends on technical and regulatory variables. If the value
58
!9:− ∆!; − <∆0 + ∆!; is positive, the incentive to invest decreases with (longer) T because the losses for the firm with the reduction of the CAPEX in the allowed revenues are larger than its gains with the reduction of the OPEX. Conversely, if58
!9:− ∆!; − <∆0 + ∆!; assumes a negative value, new investments become more attractive with elongated regulatory periods. In practice, the second case is more likely to take place since SG technologies have the potential to substantially reduce operational costs (i.e. positive and large ∆0). That is:!
9:≤
<∆0+∆!58 0+ ∆!
0 or∆0 ≥
5
,' !"#− ∆!$−
∆*<+(3) which says that incentives increase with T whenever operational savings permitted by the adoption of new technologies are large, even when the displacement of conventional investments is relatively high, holding everything else constant. Similarly, the impact of ∆!$ on an investor’s decision depends on whether the reduction in conventional investment is greater than the expenditure in SGs. Considering ∆!$ ≤ !"# , the firm’s motivation to invest increases with 8. In contrast, if ∆!$> !"#, the motivation to invest decreases with 8. In practice, the latter is likely to happen since the avoided investment in “copper and iron” may be larger than the expenditure in making the grid more “intelligent”. Hence, Marques et al. (2014) show that, whenever SGs investments avoid the need for expensive conventional investments, a pure incentive regulation (α = γ = 0 and
A = +∞
) applied in CAPEX and OPEX is the most suitable regulatory scheme. Under a price cap regulation, the firm would only invest in SGs if the perpetual rent of the avoided costs is larger than the initial investment. This result is similar to the expected behavior of any company in a deregulated context.In practice, the application of an incentive regulation generally has two main drawbacks (Joskow, 2008; Carrington et al., 2002): economic rents and deterioration of the service. Literature presents some strategies to deal with these problems. On the one hand, the choice of higher efficiency requirements can reinforce the support to SGs with little redistribution distortions (Cossent et al., 2013). On the other hand, the quality of the service can be guaranteed through a better redefinition of the performance standards, namely by setting greater incentives and penalties in a process of gradual increase of the quality targets. This is likely to lead the regulated firm to make additional efforts without
12
deteriorating the service (Armstrong and Sappington, 2006; Sappington, 2005). Therefore, efficiency obligations and performance regulation could address both allocative and quality degradation problems, while creating a favorable context for the investment in SGs.
Nevertheless, this theoretical model still ignores that the adoption of innovative solutions is a risky process for the company. In these terms, a pure incentive regulation might reveal itself inadequate to promote innovative investments in infrastructure due to the uncertainties surrounding new technologies (Vogelsang, 2012; Baucknecht, 2011; Kahn, et al., 1999).
Therefore, the initial model is refined to specifically include the effect of technological uncertainty, particularly in terms of the delivered performances, on the cost of capital. This is analyzed by allowing the possibility of using different interest rates for less mature innovations. It is assumed that the investment in risky projects, such as SGs, may justify a higher remuneration rate (rIsg) compared to the regulated remuneration of conventional investments (rIc)
and to the weighted average cost of capital (WACC) of the company’s assets (r). The effect of technological risk on delivering the expected performances is further formalized through indexing the model parameters (∆0 BCD ∆!$ to the value of the initial investment and then allowing for variations in the values in order to express the range of possible outcomes that can influence the economics of the project (see Section 4). Thus, the new formulation can be applied to projects with different profiles (i.e. of avoided OPEX and CAPEX) and enables a more solid analysis of the different sources of incertitude under scarce information.
The expression (1) can be rewritten as:
(
)
(
)
(
) (
)
(
)
∑
∑
∑
∞ + = = = + ∆ − + ∆ − + + ∆ + + ∆ + − 1 1 1 1 1 1 1 t T t C Ic SG ISG T t T t t C t SG r C I r I r r I r C I γ α (4)After some mathematical development, the expression (4) becomes:
(
)
(
)
(
)
(
ISG SG IC C)
SG T T C T r I r I rI r r I r C − ∆ − + + + − ∆ + + − ∆ 1 1 1 1 1 1 α γ (5) Therefore, the firm will adopt the new technology if:
(
)
T C(
)
T(
)
T(
rISGISG rIC IC)
rISG r r I r C − ∆ ≥ + + + − ∆ + + − ∆ 1 1 1 1 1 1 α γ (6)13
Technological uncertainty can be defined as the risk of smart technologies not delivering the expected outcomes in terms of capital costs (CAPEX) and of operational costs (OPEX).13 In fact, the disembodied character of SGs – by relying more on information and communication technologies – has the potential to save operational costs, as well as to avoid some conventional investments and/or extend their economic life (Poudineh and Jamasb, 2014).
Different SG projects tend to present distinct impacts on OPEX and CAPEX, which may be expressed as a percentage of the initial investment, i.e.
∆0 = E!
"# and∆!
$= F!
"# , respectively. So, replacing these expressions in equation (6) yields:E + F +
, %G123H%G+%(3'I3H− 5 ≥ 0
(7)This equation can be simplified by defining r = δr and assuming (for the moment) that no premium is given to conventional investments above the firm’s cost of capital (i.e. r = r), thus:
E + F +
%, J3H 3'I3H%(
− 5 ≥ 0
(8)Equation (8) shows the complete version of the model, including the influence of technological risk on the investment decisions of the regulated firm. The model shows that the profitability of the investments in SGs is actually influenced by three main groups of variables: i) the firm’s cost of capital (r); ii) regulatory dependent parameters T, γ, δ; and iii) performance-based parameters β, ρ . The firm’s cost of capital is indirectly affected by the other two set of parameters through the impact of these variables on the risk of the project. The regulatory parameters depend on the type of regulation in force and are known in advance by investors, considering the case of a stable regulatory context. However, the actual performance parameters of the new technology are impossible to known exactly ex ante and can only be predicted with some degree of accuracy.
In these terms, from the network operator’s viewpoint, the major sources of uncertainty surrounding the investment in SGs deal with parameters β (relative OPEX reduction) and ρ (relative CAPEX reduction), whose values depend on the actual numbers of ∆I , ∆C and I . An important issue in this context, namely concerning the uncertainty on the
13 Other risks are of course important, such as environmental or security (e.g. data processing), but the analysis to the economic
14
values of ∆I and ∆C, is the actual influence of SG technologies on the network’s peak load evolution and on the wear and tear of some grid assets, as discussed on section 4 of the paper.
Ideally, from the society’s point of view, the gains for the firm shall not exceed the present value of the externalities (ε) derived from the investment. Therefore, the regulator should further supervise the right-hand side of equation 8 – namely by managing the amount of the investment costs to be supported by the firm via γ - in order to prevent it to become higher than the present value of the externalities, i.e.,
0 ≤ E + F +
%, J3H 3'I3H%(− 5 ≤
N %%.Expression (8) can also be used to assess the impact of uncertainty in β and ρ on the profitability of new projects under different regulatory settings. For that reason, the equation can be re-written in the following terms:
8 ≥
'I H %3I3H% J3H %( (9)This expression shows the combination of pairs (β, ρ) that makes investment in SGs interesting, ceteris paribus, from the viewpoint of the regulated company. It is now possible to analyze the interplay between regulatory and performance variables, within the same framework, in order to help the decisions of both the regulator and the network operator.
4. Application of the decision model: the effect of changes in the variables that affect the returns of SG investments
4.1 Effect of uncertainties on performance-based parameters (β and ρ)
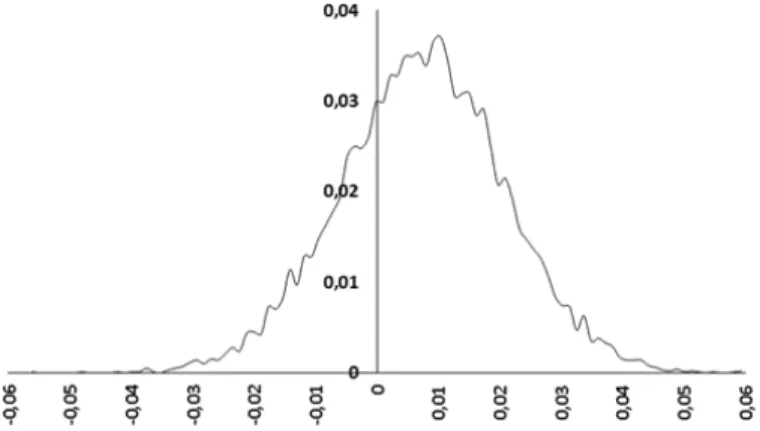
The model can assess the effect of uncertainty on the expected outcomes of SGs investments in terms of both β (OPEX reduction) and ρ (CAPEX reduction). One possible strategy consists in assuming probability distributions describing the expected behavior of β and ρ in equations (8) and (9). Appendix 1 shows an example of the distribution of results derived from a Monte-Carlo simulation for a set of assumed values, which can then permit further risk analysis14.
14The use of a probabilistic approach is compatible with the definition of coherent risk measures (that is measures complying
with the following 4 properties: translation invariance, subadditivity, positive homogeneity, and monotonicity (Artzner et al, 1999; Conejo et al, 2010)) such as Value-at-Risk and Conditional Value-at-Risk. A useful description of those methodologies can be found at (Conejo et al, 2010).
15
However, in practice, it may be difficult and sometimes even impossible to build the above mentioned probability distributions of the parameters due to a lack of data or even because of the non-probabilistic nature of the events. In these cases a possibilistic model15 can be used instead.This approach is capable to capture the judgments based on the accumulated knowledge and experience (Choobineh, and Behrens, 1992). Alternatively to the possibilistic approach, interval analysis can be applied when empirical information is not abundant (Jerrel, 1994; Choobineh, and Behrens, 1992).
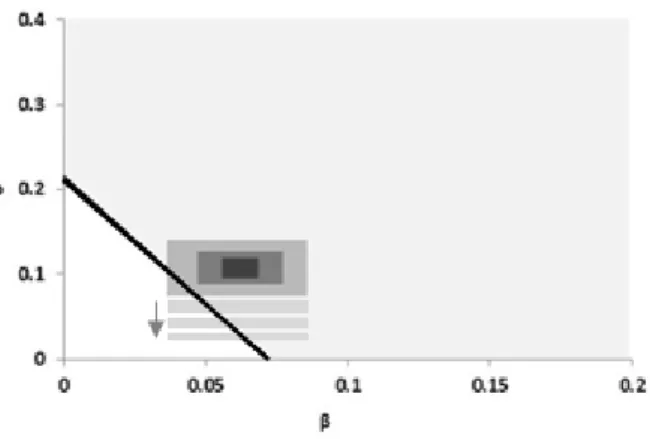
In this paper, we apply interval analysis to account for the uncertainties on the actual values of both β and ρ.16 Note that the Figure 1 presents the intervals containing the expected values for these parameters. Each parameter varies between two plausible points, yielding a region with a rectangular shape. However, the shape of this region depends on the relation between the two parameters and, thus, it can assume different forms. The rectangles shown in Figure 1 corresponds to the case of no correlation between β and ρ.17 The different levels of uncertainty are shown by considering rectangles of different sizes, with larger ones admitting more possible combinations of (E, ρ) and so increasing levels of uncertainty.
The shadow area in Figure 1 shows the E, F pairs that result in profitable opportunities for investment in SGs under the assumptions underlined in the figure’s caption (that is, the shadow area shows the E, F pairs that verify equation (8)). It is important to emphasize that the Figure 1 do not shows the magnitude of the left side of equation (8) for each pair (β,ρ), but only if this side is positive (the investment is attractive) or negative (the investment is not attractive). A three-dimensional graph would allow to see the mentioned magnitude, but the legibility of the results would be more difficult (therefore, a two-dimensional representation was adopted in this paper).18
15 The possibilistic models, based on fuzzy set theory, are particularly useful in the absence of a known outcome distribution for
the uncertain parameters (Sheen, 2005; Dimitrovski and Matos, 2000; Dubois and Prade, 1980; Zadeh, 1965). This work is left for future researches.
16Note that the use of intervals is also compatible with the definition of a coherent risk measure - complying with the required
properties of translation invariance, subadditivity, positive homogeneity, and Monotonicity (cf. Conejo et al, 2010) - by adopting a methodology as the one proposed, for instance, in Dedu and Şerban (2015).
17When the correlation coefficient between β and ρ is not null and tends to 1.0, the possible values will converge to the diagonal
line that crosses the center of the rectangle (increasing from the left to the right). This diagonal replaces the admissible region when the correlation is exactly 1.0. If the possible outcome follows a normal distribution in both parameters, the relevant area would concentrate in the vicinity of the mean point of that diagonal. The same reasoning applies when the correlation coefficient is -1.0, instead. In this case, the diagonal is in the inverse position (decreasing from the left to right).
18Note that, for the case of the largest rectangle on Figure 1, with β∈[0.04,0.08] and ρϵ[0.05,0.1], the application of the arithmetic
of intervals on the left side of expression (8) results in [-0.0106, 0.0294]. This interval contains all the magnitudes of the left side of expression (8) obtained for all the possible combinations of pairs (β,ρ). The lower limit of the interval corresponds to the pair (β=0.04, ρ=0.05) and the upper limit to the pair (β=0.08, ρ=0.1).
16
Realistic values are assumed for the regulatory parameters, which are characterized by: 4-year revisions, distribution of cost decreases (α = 40%) and acceptance of expenditures accrued to the firm’s RAB (γ = 50% , and an interest rate associated to the investment in SGs equal to the firm’s overall financing rate (r=8% and δ=1)
.
The results show that, for the assumed regulatory framework, the implementation of a SG project is always attractive whenever expected reductions on annual OPEX are higher than a threshold value (i.e. 7.2%) in terms of the original investment (I ). For projects that entail savings on relative annual OPEX (i.e. E) that are lower than this value, the firm will require additional reductions in conventional (capital) investments (i.e. a positive ρ). Finally, the effect of uncertainty on technological parameters is assessed by comparing the impact of the boxes with different sizes. As expected, the figure shows that the possibility of financial losses for the network operator increases for larger uncertainty on these parameters, as illustrated by the part of the rectangle that remains outside the attractive zone (shaded area).Fig. 1. Investment opportunities (shaded area) and uncertainty effect under a specific regulatory regime characterized by: T=4; α = 40% ; γ = 50%; r=8% and δ=1.
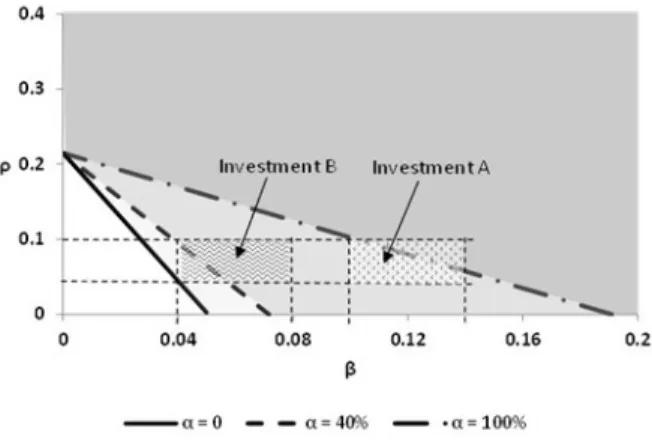
The characteristics of the SG project are also important and can affect its attractiveness in the presence of technological uncertainties. Figure 2 exhibits two different projects characterized by the same expected reduction in conventional investments (i.e., ρ), but different ranges of savings in operational costs (i.e., β). For instance, investment
A would correspond to the implementation of technologies like “telemetering”, which have a great potential of OPEX reductions, whereas investment B can be characterized by the installation of innovations, such as distribution automation devices, which may reduce costs but to a lower extent than in the previous case. Note that the results of Figure 2 were obtained for the same regulatory regime as in Figure 1 (i.e. characterized by T=4, < = 40%, 8 = 50%,
17
r=8%, and δ=1). The consideration of different technological characteristics in the analysis may increase the possibility of financial losses investments with lower operational performances (i.e., investment B). Alternatively, one could consider two projects with similar levels of E but distinct range of values for ρ that would provide a similar result. This example shows that, everything else being equal, projects with inferior performance records may become unattractive under a more risky environment. This may even threaten the implementation of the superior technology in case the two investments are complementary, e.g. installing the demand-side management mechanisms without adequate metering and information transmission equipment is of little use. Therefore, the analysis demonstrates that the attractiveness of the investment depends on the profiles of the projects, as well as on technological performances (i.e., the size of the intervals that represent the uncertainty on β and ρ parameters). This includes the case of technologies whose performances depend on the development of an active demand, as analyzed in the next section. In sum, the more uncertain the outcomes of the new technology, the lower the opportunities for SG investment.
Fig. 2. Comparison of investment opportunities under a specific regulatory regime characterized by: T=4; α = 40% ; γ = 50%; r=8% and δ=1.
4.1.1. Demand participation and incentives to invest
We now analyze the uncertainty surrounding the initial utilization of the new smart functionalities in terms of demand participation and its impact on the investment in SGs. The implementation of smart technologies improves flexibility and efficiency of system operation through the integration of more distributed energy resources (DER) and particularly a more active participation of demand. Active demand response stems from the ability for customers to
18
reduce their consumption and trade their non-consumed kWh in the market through aggregators (Crampes and Léautier, 2015; Roos et al, 2014).19
The benefits of a higher participation of demand for the electricity system are potentially manifold (Jeon, 2015a, 2015b). Active demand may delay the need for costly expansions and upgrades of the system by attenuating the peaks of consumption (Gelazanskas and Gamage, 2014). In addition to “peak shaving”, the adoption of technologies that allow a higher involvement of demand may influence the wear and tear of some grid assets, reducing the level of the network maintenance and, consequently, the level of operational expenditures (Farag et al., 2012).
However, the evolution of demand response can be difficult to predict (Siano, 2014) and this uncertainty can be so important (at least in the short term) that prevents the adoption of the technology. The system operator may delay the adoption because of fears of a low utilization of the new assets, particularly during the early years. Such low capacity utilization creates stranded (fixed) costs that could be difficult to recover, especially under an incentive regulation.
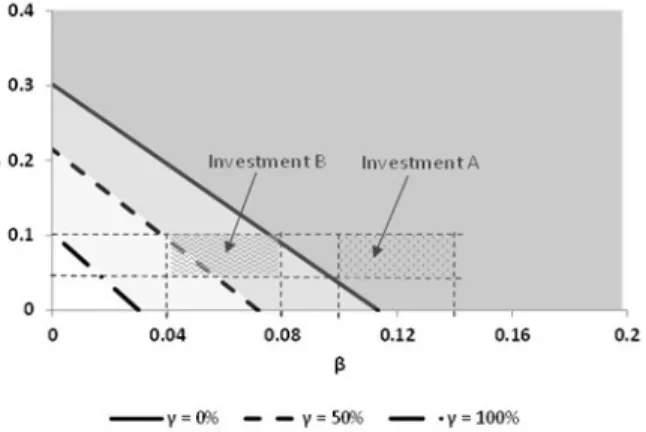
In the case of technologies enabling a more active demand, the risk of a low demand participation amplifies the uncertainties on technology performances. Figure 3 shows the effect of a slow development of active demand in the incentives to invest (i.e. part of the box included in the shaded area). The uncertainty on active demand constrains the potential of the new technologies to reduce capital expenditures in conventional assets (ρ) – see arrow. In an extreme case, where all costs were stranded, ρ assumes negative values. The opposite effect would be marked by an active demand that evolves faster than expected through a “bandwagon effect”. But a prudent investor weights more heavily the potential for losses derived from a slower than expected evolution of demand response. In sum, the unknown evolution of active demand adds to the technological uncertainties contributing to delay the introduction of emerging smart innovations in the system.
19 Active demand comprises different situations such as “demand response” and “demand management”. In the latter, the
consumer agrees to be disconnected in the moment of higher demand in the electricity system in exchange of a lower price. In the former, the consumer decides when to reduce the consumption as a reaction to an increase in power prices or in curtailment incentives (Crampes and Léautier, 2015). In the remaining of the article active demand is used in a broader sense to include all sorts of demand flexibility schemes permitted by new technologies.
19
Fig. 3. Demand uncertainty impact on investment opportunities (i.e. part of the box inside the shaded area) under a specific regulatory regime characterized by: T=4; α = 40% ; γ = 50%; r=8% and δ=1.
4.2 Effect of changes on the regulatory parameters (T, α and γ)
In addition to the uncertainty on performance-based parameters E, F , the values assumed by the regulatory parameters (T, α, γ, T, r) also have an impact on the firm’s decisions. In this section, the influence of T, α and γ parameters is assessed, while the influence of δ and r is scrutinized in the following section.
The length of the regulatory cycle is an important variable in the regulation process, since resetting more frequently can increase the risks faced by the firm (Evans and Guthrie, 2006, see also the results of the theoretical model in section 4). Figure 5 investigates the impact of the length of time between revisions (T) on the profitability of projects, by assuming different periods (T=0, T=4 and T=∞) and holding all else constant. The results were obtained assuming a regulatory regime characterized, as above, by: = 40%, 8 = 50% , r=8% and δ=1. Note that the values T=0 and T=∞ correspond to the limit situations of instantaneous revision and without revision. As expected, the attractiveness of the projects increases with the duration of the time period between regulatory revisions (i.e. the “profitable area” expands for higher values of T), as less frequent revisions lower the firm’s risks of losing the gains realized with investments in cost reduction. In contrast, the shorter the length of time between revisions, the lower the range of attractive projects (i.e., the E, F pairs). Note that, from T=0 to T=4, investment B becomes at risk, assuming that no other variable changes.
20
Fig. 4. Comparison of the set of investment opportunities (shaded area) under a different time scheduled revision process: T=0 (instantaneous), T=4 and T=∞ (without revision). It is assumed that α=40%,γ=50%, r=8% and δ=1.
The model presented in this paper can also be used to extract conclusions as to the minimum savings in operational expenditures required for investments in SGs under T=0 (i.e. instantaneous revision). The implementation of a SG project is always unattractive whenever the expected reductions on annual OPEX in terms of the original investment (U. W. E are below a certain value (in this case, 6.7%), regardless of the value of F. 20 In contrast, for T=∞ (i.e. no revision process), the attractiveness of the project is no longer influenced by both γ (i.e., the share of the investment expenditure that is accrued to the firm’s RAB) and α (i.e., the proportion of cost savings that is transferred to consumers), since the firms can retain all the benefits resulting from SG investment. In such circumstances, the expression (8) becomes E + F − 5 ≥ 0, meaning that profitability of the investment only depends on the size of the avoided costs (i.e. operational and conventional capital costs).
Similarly, the model can analyze the levels of cost reductions transferred to consumers and of investment expenditures accepted by the regulator that incentivize investments. The effect of changes in regulatory parameters α and γ on the firm’s decision is presented in Figure 5 and Figure 6 respectively, assuming T=4, r=8%, and δ=1. Figure 5 confirms the expected outcome that higher values of α reduces the set of E, F pairs that are attractive for the investment in SGs. The increase of the part of cost savings transferred to consumers (i.e., α) must be compensated by a greater reduction on conventional investments in order to keep the investment profitable for the firm. What is more,
20 Some particularities occur for T=0 (i.e. instantaneous revision), when a specific investment will only be attractive if F <,3
,
(or, for F > 0, 8 > 1, meaning that a SG project that replaces conventional capital expenditure is only undertaken if the regulator accepts to increase the RAB more than proportionally to the effective capital expenditure, i.e. the regulator provides a clear incentive to the investment).
21
the simulations show that even the efficient projects that reduce operational costs may become unattractive for higher values of α – confirming the results from the previous analysis of the theoretical model. In contrast, the increase of γ expands the range of profitable projects. Figure 6 shows that even the projects with lower reductions on OPEX become attractive with higher proportions of the investment expenditure that accrues on the firm’s RAB (i.e., γ), as expected.
Comparing the effect of changes in α and γ (Figures 5-6), it seems that the former has a stronger impact on the profitability of SG investments than the latter for the regulatory parameters assumed in these simulations. The extent of this effect in practice will, however, depend on various factors, namely on the relative weight of CAPEX and OPEX, as well as on the firm’s cost of capital and the CAPEX remuneration (i.e., δ).21
Fig. 5. Comparison of the set of investment opportunities (shaded area) under different values of α (i.e., the proportion of the cost savings that is transferred to consumers after T) when T=4, γ=50%, r=8%, and δ=1.
21In formal terms, 8 has a greater effect than α if the value of its partial derivative in Equation 8 is higher than that of α, i.e.:
Y
Y,&E + F +
%, J3H 3'I 3H
%( − 5) >Y'Y&E + F +%, J3H 3'I 3H%( − 5) <=> E > 5 F − T <=>
5 < H 3JI , ZU[WC E , 5, F BCD T > 0 => F > T
That is, the condition verifies if the relative CAPEX reduction (F is higher than the rate premium (T due to the investment in SG. Given that, in practice, T ≥ 1 (T = 1 corresponds to a situation of no rate premium), the influence of 8 is greater than α only if the investment in SG (!"# displaces more than proportionally conventional investments, i.e. !\> !"# .
22
Fig. 6. Comparison of the set of investment opportunities (shaded area) under different values of γ (i.e., share of the investment expenditure that is accrued on the firm’s RAB) when T=4, α=40%, r=8% and δ=1.
4.3. The impact of the specific risk of innovative projects (δ)
The adoption of more risky innovations tends to increase the firm’s WACC because investors are likely to demand higher returns to invest in new technologies. Under such circumstances, the regulated company may be given a higher remuneration rate (rISG > r), i.e. the regulator concedes a premium over the rates used to remunerate conventional
investments (δ>1) in order to compensate the firm for the implementation of innovative technologies.
The relationship between regulatory parameters and attractiveness of the investment under uncertainty is investigated in Figure 7 and Figure 8. Equation (9) can better evaluate the set of regulatory parameters that turn profitable projects characterized by a certain performance in terms of avoided costs (i.e. CAPEX and OPEX). Figure 7 shows the effect of a 25% increase in the remuneration rate of SG (rSG) from 8 to 10 percent (i.e. from δ=1 to δ=1.25),
assuming T=4, α=40%, γ=50% and r=8%. As expected, the higher rate expands the range of profitable investments. Indeed, for the same values of ρ (i.e., displacement of conventional investments) the frontier is enlarged to lower values of β (i.e., reduction of operational costs).
23
Fig. 7. Impact of an increase in the regulated interest rate to compensate for project specific risk, when assuming
T=4, α = 40%, γ=50%, r=8%.
The effect of different values δ in the regulatory pairs
(γ;α)
that make the adoption of a SG project attractive is shown in Figure 7. In this case, E and F are fixed and have both the same value 5%, ceteris paribus. The results confirm what is expected under a typical regulatory framework characterized by a revision process with a limited length: the greater the risk premium attributed to the investment in a certain technology, the greater the regulated firm’s incentive to invest.More relevant, the figure reveals a clear trade-off between several regulatory instruments (α, γ, δ). The increase of the premium rates (δ) reduces the minimum required level of both the expenditure that must accrue to the RAB (γ) and the firm’s proportion in operation gains (α) in order to incentivize the firm to implement the technology. Likewise, the acceptance of a larger part of the investment expenditure (higher γ), together with a higher share of the firm in the cost savings (α), ceteris paribus, reduces the need to increase the remuneration rates.
This illustrates the flexibility of the typical regulatory process that stems from the possibility of intervening in multiple parameters in order to create a more suitable context to foster investments in SGs.
24
Fig. 8. Impact of an increase in the regulated interest rate to compensate for project specific risk in the case of a regulatory regime characterized by T=4, E = 5%, F = 5%.
5. Discussion and policy implications
This paper aims to contribute to understanding the factors that affect investment in new technologies in regulated network industries. A decision model is developed to assess the economic incentives of the investment in SG projects. In particular, it takes into account different regulatory schemes as well as uncertainties surrounding the performance of the projects (in terms of the actual impact on costs). This study departs from the assumption that SGs could take a significant role in the modernization of the electricity system, and thus the importance of investigating suitable regulatory frameworks to encourage these investments. The model can be used by network regulators to set a regulatory regime that promotes the firm’s adoption of new emergent technologies.
The results obtained from a number of simulations are consistent with the literature in terms of the expected effects of changes in core regulatory variables. They show that the investment in new “smart” technologies for the infrastructure is more attractive with increases in the part of the expenditures that accrues to the RAB (γ), as well as in the risk premium attributed to the technology (δ). Conversely, the investor reacts negatively to increments on the share of cost savings that must pass to consumers (α). The model also confirms that technological uncertainty is an important barrier for the implementation of SGs.
The consideration of technological uncertainty in the analysis reduces the set of investment opportunities because of the increase in the risk of financial losses. The investments can be delayed by the effect of the uncertain impacts on capital cost avoidance and operational cost savings. These uncertainties may lower with the experience and learning derived from both R&D and deployment. Hence, there can be a justification for public support, especially for more
25
upstream transformational activities (e.g. R&D, pilot projects and initial limited deployment) that reduce technical uncertainties and accelerate commercialization of the less mature concepts. However, this early support policy is different than promoting expensive large scale deployment of technologies that have low learning premium (Nordhaus, 2014).
Other risks were also identified that can affect the gains from the investment in SGs. For example, it is very difficult to predict the development of distributed energy resources, such as active demand response which can flatten the load diagram of the networks and, consequently, differ large capital investments. The effect of uncertainty in the utilization of the new services provided by SGs should be assessed more thoroughly in future researches.
Further implications can be derived from the results of the simulations with different regulatory parameters. In contrast to the general perception that a less risky regulated rate of return is a more effective instrument to stimulate the adoption of innovations featuring high uncertainties - by reducing the economic risk of the project and, thus, its cost of capital - the paper unveils the existence of different mechanisms that are capable of fostering investments. Under an incentive regulation, for instance, the enlargement of the period between reviews can promote investment in SGs by reducing the risk of regulatory opportunism (see also Evans and Guthrie, 2006; Gilbert and Newbery, 1994). This underlines the importance of regulatory stability to incentivize new investments in infrastructure (Vogelsang, 2012).22 However, in the case where operational savings are lower than capital avoidance, the results show that the incentive to invest in SGs decreases with the length of the regulatory period. This is often the case with assets such as new information and communication technologies (ICT) that have a shorter lifespan in comparison with conventional “copper and iron” investments (CEER, 2015). More importantly, the results seems to indicate that incentive regulation can have a positive effect in the investment. Changes in the firm’s share in cost savings (α) tend to have a stronger impact on investment incentives than changes in the part of the investment accepted in the RAB (γ). However, this result depends on the technology characteristics such as the relative weight of CAPEX and the potential to displace conventional capital expenditures.
Additionally, interactions between regulatory instruments provide more flexibility to promote investment in SGs. In effect, the regulator can change several parameters at the same time to create a more favorable framework for the adoption of new technologies. For instance, the percentage of the investment accepted for the RAB should increase
22
Another possibility is regulatory holidays, which is similar to the extension of the regulatory period. However, the possibility of a temporary monopoly can incentivize the network operator to delay further investments (cf. Vogelsang, 2012).
26
and/or the proportion of cost savings that goes to consumers decrease if the remuneration rate is not great enough to compensate the firm for the higher risks of the project.
Nevertheless, incentives should be balanced against the externalities of the investment for the system and the level of uncertainty that blocks technology’s implementation. In extreme cases, the full commitment to accept all the expenses and costs of a new investment with uncertain benefits will constraint regulatory reviews in the future and pass all the risks of a costly project to customers. This may be unacceptable for several regulators who seek to preserve a fair risk-allocation to customers. Therefore, the regulator needs to find a compromise between credibility to investors and fairness to customers.
In practice, the design of a well-balanced regulatory framework faces a problem of asymmetric (and access to) information. The regulator is constrained by the available information on both the regulated network and the potential of these innovations. Thus, it is important to know how a substantial amount of information can be acquired. Two possibilities can be considered.23 On the one hand, the regulator can actively seek information on the possibilities of the new technologies. For example: by closely monitoring the respect of the obligations (and related costs) regarding the provision of information, performances and quality of service; by sponsoring the elaboration of studies, visions and roadmaps on the implementation of smart grids; and by mandating outsourcing or competitive tendering for the implementation of network innovations. On the other hand, the regulator can enact self-regulatory schemes to facilitate the coordination between potential providers and users of the new infrastructures and, thus, allow private initiatives. Littlechild (2012) proposes such framework for new investments in transmission networks, for which the salient point is “to discover or design the incentive-maximizing and risk-sharing contractual arrangements”.24
The analysis of the regulation of the investment in new grid technologies in Italy and the UK - countries that have been leading the investment in SGs in Europe - as well as in some states in the United States provide some helpful illustrations of these two approaches.
23Typically the regulator can know more about the costs of the firm through the application of a menu of contracts (Cossent,
2013). Even though this approach has proved effective to deal with the problems of asymmetric information and moral hazard in traditional regulation, it may be unable to cope with the type of uncertainties (e.g. technological, on the development of active demand) involving smart grids.
24Haney and Pollitt (2013) discuss the results of a survey of regulators for the study of electricity transmission benchmarking.
Negotiated settlements appear as an emerging new regulatory approach which might reduce the use of benchmarking. In addition, the emergence of smart grids makes the comparisons between different networks more difficult. Thus, the definition, by the regulator, of specific parameters, such as the regulatory rate and revenue sharing, becomes even more important within this new paradigm.