Atmos. Chem. Phys., 10, 1577–1584, 2010 www.atmos-chem-phys.net/10/1577/2010/ © Author(s) 2010. This work is distributed under the Creative Commons Attribution 3.0 License.
Atmospheric
Chemistry
and Physics
27-day variation in cloud amount in the Western Pacific warm pool
region and relationship to the solar cycle
Y. Takahashi1, Y. Okazaki2, M. Sato1, H. Miyahara3, K. Sakanoi4, P. K. Hong5, and N. Hoshino2
1Department of Cosmosciences, Hokkaido University, Hokkaido, Japan 2Department of Geophysics, Tohoku University, Tohoku, Japan
3Instuitute for Cosmic Ray Research, The University of Tokyo, Tokyo, Japan 4Department of Natural Sciences, Komazawa University, Komazawa, Japan
5Department of Complexity Science and Engineering, The University of Tokyo, Tokyo, Japan Received: 5 April 2009 – Published in Atmos. Chem. Phys. Discuss.: 16 July 2009
Revised: 23 December 2009 – Accepted: 11 January 2010 – Published: 15 February 2010
Abstract. Although linkages between solar activity and the earth’s climate have been suggested and the 11-year cycle in solar activity evident in sunspot numbers is the most exam-ined example of periodicity in previous studies, no quantita-tive evidence indicating a relationship for tropospheric phe-nomena has been found for a short period. Based on FFT analysis for OLR (Outgoing Longwave Radiation) compared with the F10.7 index, we clearly demonstrate a 27-day varia-tion in the cloud amount in the region of the Western Pacific warm pool, which is only seen in the maximum years of 11-year solar activity. The average spectrum in such 11-years also shows an enhancement in the range of the MJO (Madden-Julian Oscillation) period. Although there exist some ex-planations for possible mechanisms, the exact cause is un-known. Therefore, the proposed connection between 27-day cloud variation and solar cycle in the WPWP region is still a hypothesis and various kinds of varification based on other meteorological and solar parameters are strongly required.
1 Introduction
Linkages between solar activity and the earth’s climate have been suggested in previous studies. The 11-year cycle in so-lar activity evident in sunspot numbers is the most examined example of periodicity, and it is clearly recognized in vari-ations in the thermal structure and dynamical motion of the
Correspondence to:Y. Takahashi (yukihiro@ep.sci.hokudai.ac.jp)
stratospheric atmosphere (Haigh, 1994; Kodera, 1995; Shin-dell et al., 1999). Synchronization between the flux of galac-tic cosmic rays and cloud amount has also been reported in terms of the solar cycle (Svensmark, 1998). In a subse-quent paper by Marsh and Svensmark (2003), the proposed effect is attributed to low-level clouds. Also in the longer time scale, the synchronization between the cosmic rays and cloud amount is discussed by Miyahara (2008). But it should be noted that there exist some sceptical standpoints toward the solar effect, such as Damon and Laut (2004). Varia-tions in the stratosphere related to the period of apparent solar rotation have also been suggested (Nastrom and Bel-mont, 1978; Hood, 1984); however, for such a short period, no quantitative evidence exists to indicate a relationship be-tween solar activity and tropospheric phenomena. Here we focus on cloud amount variation with ∼1 month periodic-ity using Outgoing Longwave Radiation (OLR) and examine the modulation of the periodicity, paying attention to 11-year solar cycle.
2 Analysis and results
1578 Y. Takahashi et al.: 27-day variation in cloud amount in the Western Pacific warm pool region
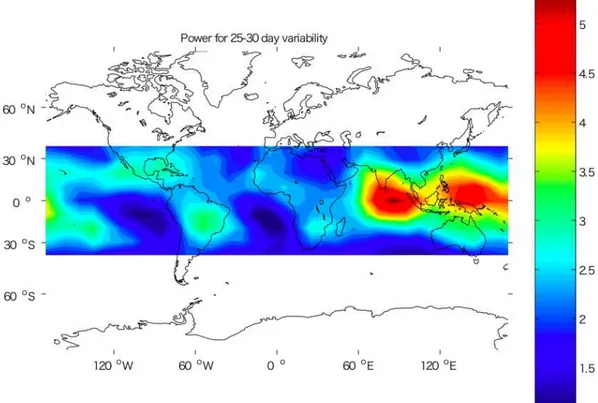
Fig. 1.Map of the spectral power of OLR in the period of 25–29 day.
about the cycle of solar rotation (27 days), for the low lati-tude region. Apparently two regions, that is, the eastern part of the Indian Ocean and the central part of the Western Pa-cific Warm Pool (WPWP) centred at 140◦E, 10◦N, show
sig-nificant enhancement. The WPWP, which shows the broader enhanced area in the power spectrum, is known to show the highest sea surface temperature in any ocean and strong at-mospheric convective activity. In the present study, as the first step, we conducted a spectral analysis for WPWP area to investigate this periodicity in detail for the OLR variation. The OLR was spatially integrated over the longitudes 130◦
to 150◦and the latitudes 0◦ to 10◦ (2.5◦-square grid). The
period of analysis is from 1980 to 2003, covering almost two and a half 11-year solar cycles. After removing long-term variations using a high-pass filter (cut-off period of 180 days), we calculated the power spectra of individual yearly data using the Fourier transform method with a Han-ning filter. The yearly power spectra are smoothed with a running mean of 3 data points. The amplitude of solar pa-rameters with 27-day period depends on the phase of the 11-year solar cycle and is generally larger at the solar maximum. If 27-day fluctuations of solar activity affect cloud amount, we would expect the response of cloud amount to vary with the phase of the 11-year solar cycle. We then categorized the analysis period into solar maximum and minimum peri-ods using a 1-year unit. We used the 10.7 cm solar radio flux
(F10.7) as a proxy of the degree of solar activity. Figure 2 shows variations in F10.7 for the period from 1980 to 2003. For the first two peaks, we define those years with smoothed F10.7 values of more than 180 (red lines) as solar maximum years (Max1 and Max2). For the third peak, the threshold is lowered to 160 (Max3). Those years with smoothed F10.7 values of less than 100 are defined as solar minimum years (Min1 and Min2). Consequently, five periods are determined according to the above procedure.
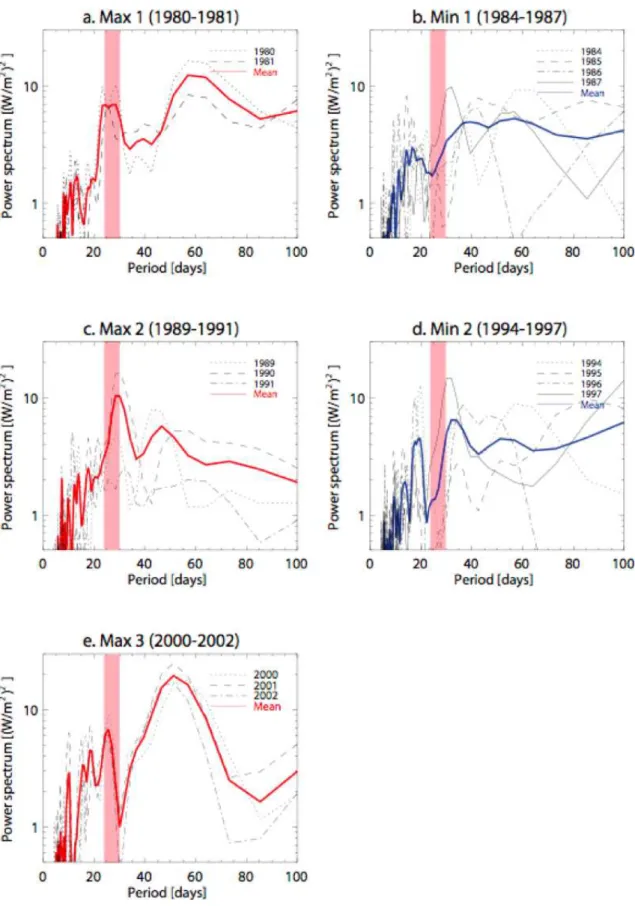
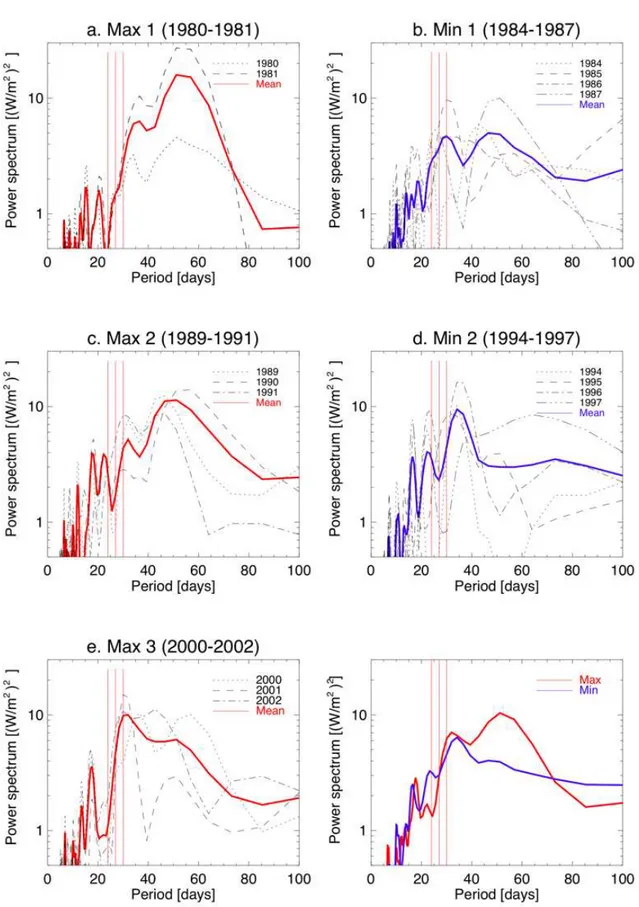
Figure 3a to e show the yearly power spectra of OLR for each solar activity period. The yearly spectra for solar maxi-mum years (black lines in Fig. 3a, c, and e) are characterized by two peaks with ranges of 24–30 days (vertical red bars) and 40–60 days, except for 1991. Consequently, the two peaks are clearly evident in the average spectra (red lines). One possible reason for the lack of clear periodicity in 1991 is that incoming solar radiation in 1991 was reduced follow-ing the eruption of Mt. Pinatubo durfollow-ing June of that year. Therefore, the spectrum for 1991 is excluded from the aver-age spectrum. During the solar minimum years, the range of 24–30 days is devoid of remarkable peaks (black lines in Fig. 3b and d) and the spectrum features for periods of greater than∼30-day show large yearly variations, especially in terms of period.
Y. Takahashi et al.: 27-day variation in cloud amount in the Western Pacific warm pool region 1579
Fig. 2. Variations in F10.7 for the period from 1980 to 2003. Grey and black lines denote daily mean and 2-year running average values, respectively. Horizontal red and blue bars at the base of the figure indicate the solar maximum and minimum years categorized in this study, respectively.
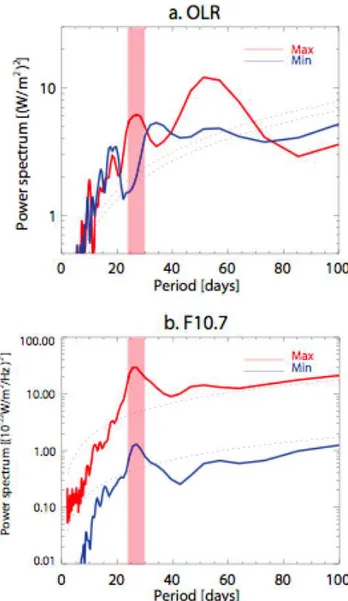
(minimum) years. The spectrum for 1991 is excluded, as de-scribed above. Figure 4b shows averaged spectra for F10.7 that were calculated in the same manner as those for OLR. It is evident from Fig. 4b that the amplitude of solar 27-day periodicity during maximum years (red line) is clearly greater than that during minimum years (blue line) by about 30 times. The shapes of the two average spectra in Fig. 4a are clearly different. Periodicities of∼27 and∼50 days are prominent in the solar maximum years (red lines), while no clear peaks appear in the range of 24–30 days in the solar minimum years (blue lines). Regarding to the error estima-tion for Fig. 4, we calculated the standard deviaestima-tion of all years presented here as about 2 (W/m2) from all the data of selected intervals in the present analysis, which suggests sufficient difference between maximum and minimum years about the peaks at∼27-day and∼50-day.
The above results can be summarized in terms of the fol-lowing two new findings. First, the behaviour of variations in cloud amount depends on the phase of the 11-year solar cy-cle. Second, one of the two periodicities in solar maximum years has the almost same value as the cycle of solar rotation: 27 days. This suggests that the 27-day cycle in variations in solar activity controls variations in the cloud amount.
3 Discussion
We performed the same spectral analysis for other equatorial areas (results not shown) and found that the area in which
the OLR always shows 27-day periodicity in solar maximum years is most prominent in the WPWP. This area may there-fore be a kind of “accepting region” for solar activity with 27-day periodicity. Considering this fact as well as the large amplitude of 27-day periodicity, an investigation of the char-acteristics of WPWP may provide the key to understand the mechanism that generates the observed 27-day periodicity in cloud amount and world climate variation, as well as those of Indian Ocean.
1580 Y. Takahashi et al.: 27-day variation in cloud amount in the Western Pacific warm pool region
Y. Takahashi et al.: 27-day variation in cloud amount in the Western Pacific warm pool region 1581 for the relationship between the solar parameter and cloud
amount would be the mechanism related to the global circuit model, which could be modulated both by GCR and geo-magnetic activities originated by solar wind variation. Mod-ulation of the global electric circuit currents changes the dis-tribution of highly charged aerosols, which may strongly in-fluence cloud precipitation. This process is named as “elec-troscavenging” (Tinsley, 2000). WPWP is one of the most cloudy section of the sea in the world, meaning the most sensitive to the electroscavenging. At this stage we cannot exclude the effect of UV radiation via heating of the strato-sphere, the effects of slight changes of total solar irradiance (TSI) and other ideas for physical connections between solar activity and cloud amount. Note again that these hypoth-esises should be examined quantitatively based on detailed and careful analysis, which is beyond the scope of this pa-per. There have been some extensive frequency analyses of the MJO already such as Whitcher et al. (2000) and sugges-tions for possible mechanisms for them. The review of the MJO of Madden and Julian (1994) reported on a 26-day pe-riod in the MJO for 1980–1985, and the broadband nature of the oscillation. They also report on studies which attribute the change in the period of the oscillation to warm water and El Nino. We consider that, at this moment, we cannot rule out any kinds of reasonable hypothesis for the “apparent” coincidence with solar activity. However, the intension of the present paper is to report the clear relationship between the peak around 27-day and 11-year solar activity for about 30 years, suggesting some possible linkage mechanisms. We confirmed this relationship is still valid for 2006–2008 (not shown here). In regards to lunar tide, which has almost same periodicity, we have not found any clear phase relationship to the OLR variations so far. Also we may need to consider some complicated processes from solar input to the behav-ior of OLR and, therefore, we believe that the next step for examination of our hypothesis is to investigate the phase rela-tionship between OLR and other meteorological parameters in/near WPWP.
We should pay attention to the accuracies and limitations of OLR analysis. It is taken from narrowband radiances and polar-orbiting satellites, which may cause an aliasing effect due to orbital sampling of polar-orbiting satellites. However, if the 27-day period is an aliasing of shorter period variations, we need to discuss the 11-year solar activity dependence of this shorter periodicity, which may sound more unreal-istic. Generally speaking, OLR is mainly modulated by high clouds and is not very sensitive to low clouds. Therefore, the result of this paper may indicate a response of high-level clouds to solar variability, in contrast to Marsh and Svens-mark (2000) who suggest a link with low-level cloud amount. But we need further careful analysis in the near future.
Though the apparent periodicity in the averaged spectrum for solar minimum years (Fig. 4a) is 35 days, the period-icity shows some yearly variations in the range of 20 and 35 days. If the 27-day periodicity in cloud amount during
Fig. 4. (a)Averaged power spectra of OLR for the maximum (red) and minimum (blue) years. Dotted lines represent 1-s significance levels for the two averaged spectra calculated from the standard de-viation of the data. The vertical red bar represents the period be-tween 24 and 30 days.(b)As for (a) but for F10.7.
1582 Y. Takahashi et al.: 27-day variation in cloud amount in the Western Pacific warm pool region
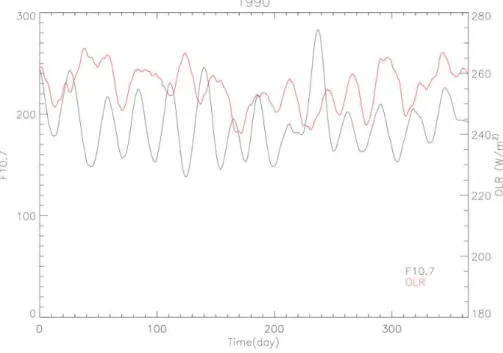
Fig. 5.Time variations of OLR in WPWP (red line) and F10.7 (black line) for 1990. The data is smoothed for 10-day running window.
one example, the temporal variation of OLR and F10.7 in 1990 is shown in Fig. 5. This fact seems to support the idea that the internal periodicity is synchronized with weak exter-nal force.
In the work by Gleisner and Thejll (2003) a significant 11-year signal in the tropospheric thickness (upper and lower) for all tropical latitudes except the central and eastern Pacific was found, consistent with the present work. However, they did not find a significant response to the solar cycle in the vertical velocity in the WPWP region. This inconsistence could be attributed to the difference in spatial resolution.
The investigation of the Indian Ocean region, in which the OLR spectrum shows another maximum for∼27-day, could put some additional information into the relationships be-tween the∼27 day OLR variations and MJO frequencies. The analysis for this region must be essential since MJO starts there. We examined this region in the same way as the WPWP and found that there sometimes exists a 27-day peak but the relationship with regards to 11-year solar activ-ity is not so clear and constant, compared to WPWP. Also the strong enhancement as seen in Fig. 1 is caused not only by the local peak around 27-day, but sometimes caused by the enhancement over the broad range of period. In other words, Indian Ocean makes large amplitude modulations at every periods, resulting in enhancement of Fig. 1 also at about 27-day. Figure 6 shows the results of FFT analysis done for Indian Ocean in the same way as Figs. 3 and 4. Still there is no doubt that the Indian Ocean is one of the most important regions to investigate 27-day periodicity of OLR, and spetial attention should be paid in future analysis.
We should be careful about the possibility of beating ef-fect and harmonics of MJO of the longer period, which may produce an apparent peak at∼27-day. As seen in Fig. 3c, the peak in the 24–30 day range could be larger than the power in the longer period range. Also, as seen in Fig. 3a and e, no double-peaked structure is found in the MJO range, which can make a beat periodicity. The widths of MJO enhance-ments in Fig. 3a and e are much broader than 27-day peak, which may not cause the sharp peak around 27-day. There-fore, we think the peak at∼27-day is real phenomenon.
A periodicity of 40–60 days is also prominent and rela-tively stable in solar maximum years compared to minimum years. This periodicity lies within the range of the Madden-Julian Oscillation (MJO) (Madden and Madden-Julian, 1971, 1972). This result implies some direct or indirect interaction be-tween the occurrences of the 27-day and stable MJO peri-odicities. However, detailed and careful analyses, paying at-tention to the regional and temporal variations, are required to examine this possibility.
Y. Takahashi et al.: 27-day variation in cloud amount in the Western Pacific warm pool region 1583
1584 Y. Takahashi et al.: 27-day variation in cloud amount in the Western Pacific warm pool region periodicity could modulate the period of climate parameter
variation such as about one month variation of OLR, which has much larger amplitude in a short period, and then this modulation of period in climate parameter induces the longer period variation, as a structure of the time hierarchy.
4 Conclusions
We made simple frequency analysis for cloud amount based on OLR data of 25 years, focusing on the relationship be-tween short-term (∼1 month) changes and the 11-year so-lar cycle. It was found that the∼27-day variation of OLR is prominent in WPWP in solar maximum years. This fact suggests a possibility that the solar rotation influences the variations of the cloud amount in that area. Taking into ac-count the fact that the apparent periodicity of cloud amount in the averaged spectrum for solar minimum years exists at ∼35 days, which is clearly longer than 27 days, the possibil-ity of synchronization with a weak external source should be examined. The averaged spectrum of OLR variation in so-lar maximum years also shows a significant enhancement in the period range of 40–60 days, which corresponds to MJO periods, indicating some possible connection between them. Though some physical mechanisms to explain the solar ac-tivity effect on cloud amount variation could be proposed, careful and multidirectional approaches are strongly desired in the near future.
Acknowledgements. The interpolated OLR data were provided by the NOAA/OAR/ESRL PSD. The F10.7 data were acquired by the Dominion Radio Astrophysical Observatory. This work was supported by Grant-in-aid for scientific research No. 119002002.
Edited by: J. Curtius
References
Damon, P. E. and Laut, P.: Pattern of strange errors plagues so-lar activity and terrestrial climate data, Eos Trans. AGU, 85(39), doi:10.1029/2004EO390005, 2004.
Gleisner, H. and Thejll, P.: Patterns of tropospheric re-sponse to solar variability, Geophys. Res. Lett., 30(13), 1711, doi:10.1029/2003GL017129, 2003.
Haigh, J. D.: The role of stratospheric ozone in modulating the solar radiative forcing of climate, Nature, 370, 544–546, 1994. Hood, L. L.: The temporal behaviour of upper stratospheric ozone
at low latitudes – Evidence from Nimbus 4 BUV data for short-term responses to solar ultraviolet variability, J. Geophys. Res. 89, 9557–9568, 1984.
Kirkby, J.: Cosmic rays and climate, Surv. Geophys., 28, 333–375, doi:10.1007/s10712-008-9030-6, 2007.
Kodera, K.: On the origin and nature of the interannual variability of the winter stratospheric circulation in the northern hemisphere, J. Geophys. Res., 100, 14077–14087, 1995.
Liebmann, B. and Smith, C. A.: Description of a complete (interpo-lated) outgoing longwave radiation dataset, B. Am. Meteor. Soc., 77, 1275–1277, 1996.
Madden, R. A. and Julian, P. R.: Detection of a 40–50 day oscilla-tion in the zonal wind in the tropical Pacific, J. Atmos. Sci., 28, 702–708, 1971.
Madden, R. A. and Julian, P. R.: Description of global-scale circu-lation cells in the tropics with a 40–50 day period, J. Atmos. Sci. 29, 1109–1120, 1972.
Madden, R. A., and Julian, P. R.: Observations of the 40–50-Day Tropical Oscillation, Mon. Weather Rev., 122, 814–837, 1994. Marsh, N. and Svensmark, H.: Galactic cosmic ray and El Ni˜no –
Southern Oscillation trends in International Satellite Cloud Cli-matology Project D2 low-cloud properties, J. Geophys. Res., 108(D6), 4195, doi:10.1029/2001JD001264, 2003.
Miyahara, H., Yokoyama, Y., and Masuda, K.: Possible link be-tween multi-decadal climate cycles and periodic reversals of so-lar magnetic field poso-larity, Earth Planet. Sci. Lett., 272, 290–295, 2008.
Nastrom, G. D. and Belmont, A. D.: Preliminary results on 27-day solar rotation variation in stratospheric zonal winds, Geophys. Res. Lett. 5, 665–668, 1978.
Shindell, D., Rind, D., Balachandran, N., Lean, J., and Lonergan, P.: Solar cycle variability, ozone, and climate, Science, 284, 305– 308, 1999.
Svensmark, H.: Influence of cosmic rays on Earth’s climate, Phys. Rev. Lett., 81, 5027–5030, 1998.
Tinsley, B. A., Rohrbaugh, R. P., Hei, M., and Beard, K. V.: Effects of image charges on the scavenging of aerosol particles by cloud droplets and on droplet charging and possible ice nucleation pro-cesses, Atmos. Res., 57, 2118–2134, 2000.