Abstract— In this article, the relationship between the Statistical Analysis Plan (SAP) and the associated ADaM Datasets is explored. An introduction to the creation of metadata based on the SAP is provided. Advice is offered regarding the key elements that a SAP must include in order to streamline the development of tables, listings and figures (TLFs) and ensure that they meet FDA guidelines. Examples are provided to demonstrate the process used for the development of ADaM datasets, metadata of longitudinal clinical trials, as well as handling of incomplete continuous clinical data.
Index Terms — Statistical Analysis Plan, STDM, ADaM, Metadata, Clinical Study Submission
I. LIST OF ABBREVIATIONS
The following abbreviations are used in this manuscript:
Abbre-viation
Explanation Abbre-viation
Explanation
ABLFL Analysis baseline level flag
LOCF Last Observation Carried Forward ADaM Analysis Data Model MedDRA Medical Dictionary for
Regulatory Activities ADaMIG ADaM Implementation
Guide
PARAM Parameter
ADSL Subject Level dataset PARAMCD Parameter code ADAE Analysis dataset for
adverse events
SAP Statistical Analysis Plan
AE Adverse events SAS Statistical Analysis System
ANCOVA Analysis of covariance SDTM Study Data Tabulation Model
ATPT The analysis timepoint SOC System Organ Class BOCF Baseline Carried
Forward
TLF Tables, Listings and Figures
CDER Center for Drug Evaluation and Research
TEAE Treatment-emergent AE
CDISC Clinical Data Interchange Standards Consortium
TRTA Actual treatment group
DM Demographics Domain Model
TRTP Planned treatment group
EX Exposure domains WOCF Worst Observation Carried Forward FDA Food and Drug
Administration
XML Extensible Markup Language
ITT Intent-to-treat
II. INTRODUCTION
OTH the Study Data Tabulation Model (SDTM) and Analysis Data Model (ADaM) standards [1] were designed to support submission by a sponsor to the FDA. They are applicable to a wide range of drug development activities in addition to regulatory submissions. The statistical analysis plan (SAP) is written to provide details of procedures for the statistical analysis of
Manuscript received June 12, 2012; revised July 7, 2012.
Hal Li, Principal Biostatistician, Octagon Research Solutions, Inc. 585 East Swedesford Road, Wayne, PA 19087, USA (Phone: 610 535-6500-EXT 5829 | Fax: 610 535-6515 | Email : [email protected]).
Jeff Davidson, is with Octagon Research Solutions, Inc. (Phone: 610 535-6500-EXT 5554 | Email : [email protected]).
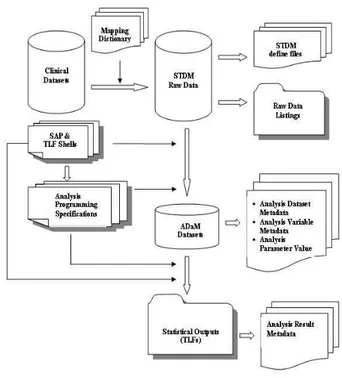
the primary and secondary variables and other key information collected in the clinical trial. The SAP serves as a guideline when creating the ADaM datasets. The process for converting the clinical data to ADaM and creating the clinical study report is represented in Figure 1.
Often, we find that there are gaps between the SAP and the creation of ADaM datasets. One example for that will be the definition for the intent-to-treat (ITT) population. Many define the ITT population as the subjects who take the study medication and have at least one post-baseline visit. In STDM or ADaM, there isn’t a dataset for study visit. The SAP needs to specify how the post-baseline visit date will be identified for each affected variable. In many cases, the SAP fails to provide enough description in the method sections to create ADaM analysis result metadata.
III. BASICS OF THE STATISTICAL ANALYSIS PLAN (SAP) The statistical analysis plan (SAP) is written to provide detailed procedures for executing the statistical analysis of the primary and secondary efficacy variables, safety variables, demography, disease characteristics and medications. A SAP typically contains the following:
Study design
Efficacy objectives (depending upon the phase, this may not be included),
Schedule of assessments, Population definitions,
Bridging Statistical Analysis Plan and ADaM
Datasets and Metadata for Submission
Hal Li, Jeff Davidson
B
Definition of baseline values, Analysis covariates,
Handling of missing data,
Handling of multiple records per visit, Safety objectives,
Definition of treatment-emergent AEs, Definition of prior/concurrent medications, Handling of partial dates for AEs and medications Assumption checking method.
A SAP should include the Table Listing and Figure (TLF) shells. These may be attached to the SAP, or may be contained in a separate file. The shells provide a clear and thorough understanding of what is going to be summarized or analyzed. Examples of the key information included in the shells are as follows:
• Subject-level variables and visit-level variables to be included in the analysis
• Summary by treatment, sequence, period, or visit • Variables that appear on one or multiple tables • Variables collected on the same CRF panel. • Derived variables and identifiers.
IV. BASICS OF ADAMDATASETS
A. Basics of ADaM
The FDA strongly recommends to submission of data in SDTM format and submission of analysis datasets in the ADaM format. Analysis datasets are datasets that support the results presented in the study report and SAP specified analyses. The latest ADaM Implementation Guide (ADaMIG) [2] should be followed when creating the ADaM datasets. In summary, there are seven fundamental principles for ADaM as summarized by Becker (2010) [3]:
Standardize delivery to regulatory agencies
Provide clear documentation of the content, source and quality of the analysis datasets
Provide clear documentation of the results of a clinical trial (statistical methods, transformations, assumptions, derivations, imputations)
Provide a “roadmap” of how metadata, programs and documentation translate the Statistical Analysis Plan (SAP) to the statistical results
ADaM datasets should be usable by current tools (e.g. SAS® or SAS macro libraries)
Provide XML metadata for future analysis tool development
Analysis-ready or “one proc away”: This means ADaM datasets incorporate derived and collected data (from various SDTM domains, other ADaM datasets, or any combination thereof) into one dataset that permits analysis with little or no additional programming
The variables from a clinical trial are used to create multiple ADaM datasets containing a few variables in each with many rows. For a submission, each clinical trial contributes as many datasets as are necessary to support the analytics being included. These multiple datasets are called Basic Data Structure (BDS) datasets. In addition to BDS datasets, there is another dataset required called the Subject
Level dataset (ADSL). ADSL is uniquely defined to contain all of the variables needed to describe each subject’s involvement in a clinical trial. The basic ADaM structures involve the ADSL, multiple BDS datasets and some datasets in other formats.
B. Basics of ADSL
The basic ADSL contains the variables that define the study, subject number, basic descriptors, study sequences and treatments for each subject in the dataset. It is a subject-level dataset.
To create this basic ADSL dataset, it is necessary to review the following sections in SAP to understand how the analysis was planned: Population definitions, Schedule of assessments, Definition of baseline values, Analysis covariates and Definition of prior/concurrent medications. The Demographics Domain Model (DM) and Exposure (EX) domains from the SDTM model are typically required. Other variables that are typically used include the population flags and treatment start/end dates. Many of the Subject-level variables and variables that appear on multiple tables will be included in the ADSL.
A complete list of the standard variables required in the ADSL dataset is provided in the ADaMIG. In addition to the basic study site and subject identifiers, the ADSL must contain subject demographics, demographic grouping (e.g. age groups), if those are needed for any of the analysis outputs. There should also be a population flag defined for each study population. At least one study population should be defined, and the study population flags should not be blank for any subjects in the dataset.
Treatment arm variables will be included in the ADSL dataset. For a single period study, a single variable representing the planned treatment group (TRTP), as well as a variable representing the actual treatment group (TRTA) is required. For a crossover study, a variable representing the planned treatment sequence, and variables representing the planned and actual treatment for each period of the study are required.
The final set of required variables in ADSL consists of study dates: date of randomization, date of first exposure to study treatment, and date of last exposure to study treatment. If the study is designed as a crossover study, create variables representing the dates of the first and last exposures to study treatment for each period. It may also be necessary to create variables representing the starting and ending dates of each period, if those are different from the first and last exposure dates for the period.
C. Basics of Data Structure (BDS)
(e.g., the subject identification) or describe and trace the derivation (e.g., DTYPE) or support the analysis (e.g., treatment variables, covariates). It may be derived from all classes of SDTM domains, other ADaM datasets and combination of those. The four basic components of a BDS are the subject identification, study visit, the data value, and descriptors of that data – parameter (PARAM and PARAMCD). The parameter variable is designed to contain the full description of the analysis. This describes what is being provided in either the AVAL (for numeric) or AVALC (for character) results. This dataset should also include other types of variables that define the parameter. One of the variables should define whether the parameter is actual or is derived and what type of derivation occurred.
An application of BDS is analysis data for the primary and secondary endpoints. The SAP should provide the planned analysis that will be needed for producing the reports on these data. For the treatment comparison, treatment variables are necessary in BDS. If the BDS is based on a specific time point, each result is going to be assigned to a treatment (TRTP or TRTA) at that time point.
For longitudinal studies, endpoints are collected at multiple time points during a clinical trial. This should be described in the Study design section of the SAP (specifically in the Schedule of Assessments). The analysis timepoint (ATPT) variable can be used to assign specific time points when the data are collected. There are also APHASE, APERIOD and AVISIT variables available for providing additional timepoint definitions.
It is necessary to identify which variables from the SDTM datasets are going to be used. For each unique measurement value being carried forward from STDM, create a unique PARAM and PARAMCD value to be used in this dataset. For numeric variables, assign their values to AVAL. By including these variables, reviewer is provided with the source data used for any calculation. There should be a one-to-one correspondence between the values of PARAM and PARAMCD. Often, BDS contains variables for capturing both the baseline and change from baseline values. Pertaining to the record that is used for calculating the baseline value, the ABLFL value should be added with a value of ‘Y’.
D. Special Considerations of Data Structure (BDS) - Unscheduled visit
Often subjects show up on unscheduled visits or they miss visits during the trial. Because of this, the SAP usually contains rules for handling multiple visits within a specific time period for selected study visits. For cases when multiple visits occur during a specific time point, an analysis flag should be added to the dataset designating which record is used for reporting. Note that the ADaMIG recommends keeping all of the records and visits in the original SDTM dataset in the analysis dataset to make it easier for the reviewer to trace analysis records back to their source.
E. Special Considerations of Data Structure (BDS) - Missing data imputation
In some longitudinal studies, the SAP will discuss how to handle missing data. The common approaches are single imputation and multiple imputation. Examples for single imputation are Last Observation Carried Forward (LOCF), Worst Observation Carried Forward (WOCF) and Baseline Carried Forward (BOCF). For these imputed values, it is necessary to create a value for AVAL that does not exist in the STDM datasets. As a result of this, additional changes must be made. Since the imputation value is calculated rather than arising from the raw dataset, the value of PARAMTYP will be set to ‘DERIVED’. It will also be necessary to add a variable DTYPE to the dataset. When the value is derived, this DTYPE should be set to the method of derivation. For the current case, it should be set to ‘LOCF’, ‘WOCF’ or ‘BOCF’ as appropriate.
In certain cases, multiple imputation procedures are used. An example of one of these methods is provided. Dependent upon the missing data pattern and mechanisms, the Rubin (1987) [4] multiple imputation procedure may be used to replace missing values with a set of plausible values that represent the uncertainty about the most likely values to impute. Typically, five values are created for a missing value. With five imputations, one can compute five different sets of the point estimates and associated standard errors for the treatment differences on the change from baseline value. The point estimate from multiple imputations is the average of the five imputed data estimates. Five sets of data points in addition to the original raw observation in the BDS for these five imputed data values are created using this methodology. Similar to the single imputation methods,, it is necessary to set the PARAMTYP to ‘DERIVED’, add a variable DTYPE to ‘MUL-IMPUT’ and add a variable to indicate the number of the imputations associated with the value.
F. Other Data Formats
There are data types that do not fit the formats either ADSL or BDS. As an example, adverse event would be very difficult to summarize in a long format of BDS and make generating the analysis tables “Analysis-ready (one proc away)” virtually impossible. The ADaMIG does not provide the guidance regarding how to create analysis dataset for AEs (ADAE). Similar to ADAE, there are other datasets do not fit the formats either ADSL or BDS. The CDISC community is working to create custom domains for data including adverse events, concomitant medications, and medical history.
G. How to create ADAE
For AEs, it will be necessary to create a flag identifying treatment-emergent AEs (TEAEs), and possibly derived variables representing intensity, relationship to study drug, actions taken and outcome. Similar concepts also hold for medications. It will be necessary to create flags indicating whether a medication is prior or concomitant as well.
MedDRA’s (Medical Dictionary for Regulatory Activities) System Organ Class (SOC) and Preferred Term, as well as by other attributes, including severity and relationship to study drug.
The general practice for creating ADAE datasets has been to take the SDTM AE dataset, keeping the same structure of one record per subject and event, and then add any other variables required for generating the TLFs, such as a treatment-emergent flag. For traceability purposes, that is, to be able to trace the analysis dataset variables back to their original sources, it’s recommended that any SDTM variables which are not modified in the analysis datasets should retain their original variable names and labels.
V. BASICS OF METADATA
In the “CDER Common Data Standards Issues Document (Version 1.1/December 2011)”, [5] the FDA provided the following guidance for study data specification: “A critical component of data submission is the define file. A properly functioning define.xml file is an important part of the submission of standardized electronic datasets and should not be considered optional.” Analysis files are critical for the FDA to understand on a per patient basis how the specific analyses contained in the study report have been created. Analysis datasets should be derivable from the SDTM datasets, in order to enable traceability from analysis results presented in the study reports back to the original data elements collected in the case report form and represented in the SDTM datasets. There are features built into the ADaM standard that promote traceability from analysis results to ADaM datasets, and from ADaM datasets to SDTM.
Just like in SDTM, not only are the ADaM datasets required, but metadata is needed to describe what is being provided. For each submission, there are three required and one optional ADaM metadata datasets. They are:
Analysis Dataset Metadata
Analysis Variable Metadata
Analysis Parameter Value Level Metadata
Analysis Result Metadata (optional)The first two datasets are similar to SDTM in that they describe the datasets and the variables in the datasets, much like the DEFINE.xml file. The third dataset works with the parameter field for each dataset. Since each unique
parameter value in each dataset describes a result, this needs to be captured in a metadata dataset. It should provide enough details that when a reviewer looks at the data, it helps them understand how each parameter is created. The fourth dataset comes the closest to capturing the analytics from the SAP, and is recommended as an aid to the reviewer to understand how the analysis details.
A. Analysis Dataset Metadata
The analysis dataset metadata provides the first level of the metadata. Each dataset created within the ADaM structure must be documented in this metadata file. For each analysis dataset, it is necessary to provide seven pieces of
information. This includes the dataset name, a description of the analysis dataset, its location, the structure of the dataset (e.g., one record per subject, parameter and visit), the class
of the dataset, which describes the particular type of ADaM dataset, the key variables in the analysis datasets (usually USUBJID, PARAMCD and AVISIT), and the
documentation for supporting the analysis in the dataset. Currently, the only recognized classes are ADSL, BDS, or OTHER. Future versions of ADaM will define additional dataset classes. A sample analysis datasets metadata for ADEFF is given in Table 1.
B. Analysis Variable Metadata
Each of the variables in the analysis datasets needs to have associated metadata. This metadata is the closest to the “define.xml” file created for the SDTM data, and it includes such information as the dataset name, variable names, attributes, labels, types, display formats, code lists or controlled terms, and the source or derivation for the analysis dataset specifications that is customarily created for a study can serve as analysis variable metadata.
C. Analysis Parameter Value Level Metadata
Multiple analysis parameters can be saved in analysis datasets. The SAP may specify different algorithms for deriving each parameter. Each parameter may be assigned a different name, code and identification number. The analysis parameter value level metadata serves to document information about the various parameters found in an analysis datasets. The following are some key elements for the analysis parameter value level metadata:
In addition, it will be necessary to define all of the DTYPE values in the BDS dataset. If a LOCF imputation is being performed, it will be necessary to have a row in the analysis variable metadata with the parameters using the LOCF imputation defined in the parameter identifier column, ‘DTYPE’ specified as the variable name and ‘LOCF’ specified as the Codelist and Controlled Term. The actual algorithm used for determining the LOCF value can be specified in the Source or Derivation column.
D. Analysis Result Metadata
Analysis Result Metadata is not a required part of the FDA submission, but comes closest to capturing the analytics from the SAP, and is recommended as an aid to the reviewer. Its contents should be determined jointly by the reviewer and the sponsor. It may contain information regarding all of the analyses performed for a study or it may be limited to only the primary and key secondary study endpoints. It should contain, for each analysis included, the following information:
Analysis Name – A unique identifier for this analysis. (e.g. table or figure number)
Description – A text description of the contents of the display. This will normally contain more details than the title of TLFs
Reason of analysis – The rationale or authority for performing the analysis.(e.g., ‘Primary Efficacy Analysis”)
Datasets – The name of the analysis datasets used for this analysis. It may include the specific selection criteria to identify the appropriate records selected for this analysis.
Documentation – Contains the information about how the analysis was performed. This section could be a text description of the statistical method employed, or a link to other documents, such as:
o Protocol
o SAP and TLF shells
o Analysis generation program (i.e., a statistical
software program used to generate the analysis result)
As an example, in the SAP the following text was written for an efficacy analysis:
For the efficacy endpoint, the mean change in pain intensity from Baseline to Week XX will be analyzed using an analysis of covariance (ANCOVA) model with change from baseline in NRS pain intensity as the dependent variable, treatment as factor, and the baseline pain intensity score and the study site serving as a covariate. The ANCOVA analysis will utilize the following Pseudo- SAS Code for Analysis (Provided).
The table shell for this analysis is shown in Table 2. The analysis result metadata tells how tables are created and what is required for table programming. Using the previous efficacy analysis (table 14.2.x.x) as an example, a
corresponding analysis result metadata for that table could look like the presentation in Table 3.
VI. BRIDGING THE GAPS
Often we see gaps between SAP and the process of creating ADaM. In the following, some common examples are provided.
A. SAP and the shells must provide sufficient details The efficacy example provided above demonstrated that the SAP should provide the following:
The study time of the analysis How the baseline and change defined Statistical model details
Pseudo- programming code for analysis Analysis population definition
How the by-variables are defined
Often the SAP and shells are missing some of these elements.
B. Check the SAP details before creating the ADaM and STDM
As an example, TEAE flag may have been created in SDTM raw dataset. However, the definition of TEAE in SAP may apply a window (e.g. 30 days) post study medication ended. When the STDM was created, the window was not applied. To be consistent with the SAP, it may be decided to derive the TEAE flag again in ADaM and drop the same flag variable from SDTM. Yet, the traceability maybe compromised because of the existence of a TEAE flag.
VII. CONCLUSION
All documents and files illustrated in Figure 1 must be submitted to the FDA. The most successful regulatory submissions follow the path of least resistance. Finding that path, however, requires knowledge and preparation. Creating the ADaM data sets and metadata can seem quite challenging at first. However, with well written and comprehensive SAP and associated TLF shells, the basic approach described above should remove some of the mystery from the process. The following steps are important to creating the ADaM data sets and metadata. First, refer to the most updated ADaM guideline. Second, apply ADaM foundational principles. Third, check the details from the study protocol, SAP and TLF shells before creating the ADaM and associated metadata.
When writing the SAP, keep in mind the key elements a SAP needs to include in order to streamline the development of ADaM data sets and metadata tables, and the need to product the TLFs that meet FDA guidelines.
REFERENCES [1] CDISC Analysis Data Model Version 2.1.
http://www.cdisc.org/stuff/contentmgr/files/0/854651256c2654c94b0 3e6da1be6e145/misc/analysis_data_model_v2.1.pdf
[2] CDISC Analysis Data Model Implementation Guide Version 1.0.
http://www.cdisc.org/stuff/contentmgr/files/0/854651256c2654c94b0 3e6da1be6e145/misc/adam_implementation_guide_v1.0.pdf
[3] Becker, Matthew, "Insights into ADaM" PharamSUG 2010,
http://www.phuse.eu/download.aspx?type=cms&docID=1405
[4] Little, R.J.A. and Rubin, D.B. (1987), Statistical Analysis with Missing Data, New York: John Wiley & Sons, Inc.
[5] CDER Common Data Standards Issues Document (Version1.1)
Table 1: Analysis datasets metadata for ADEFF Dataset
Name
Dataset Description
Location Structure Class Key
Variables
Documentati on
ADEFF Contains values for efficacy parameters
xxxx / adeff.xpt
One record per subject per parameter per analysis visit
BDS USUBJID,
PARAMC, AVISITN
SAP section X.X.X
....
=========================================================================
Table 2: Table shell for efficacy analysisTable 14.2.x.x
Change in Pain Intensity from Baseline to Week xx Intent-to-Treat Population
Visit* Statistics Placebo
(N=XXX)
Treatment 1 (N=XXX)
Treatment 2 (N=XXX) Week 0 (Baseline)
n xxx xx xx
Mean xx.x (xx.x) xx.x (xx.x) xx.x (xx.x)
SD xx.x xx.x xx.x
Median xx.x xx.x xx.x
Min, Max xx, xx xx, xx xx, xx
Week xx ...
Week xx Change from Baseline
n xxx xx xx
Mean (SD) xx.x (xx.x) xx.x (xx.x) xx.x (xx.x)
Median xx.x xx.x xx.x
Min, Max xx, xx xx, xx xx, xx
ANCOVA Results LS Mean Change from Baseline
xx.x (xx.x) xx.x (xx.x) xx.x (xx.x)
P-value for within-group* (0.xxxx) (0.xxxx) (0.xxxx)
LS Mean Difference (95% CI) (Treatment x - Placebo)
xx.x (xx.x, xx.x) xx.x (xx.x, xx.x)
P-value 0.xxxx 0.xxxx
========================================================================
Table 3: Analysis result metadata for efficacy analysisDISPLAY NAME RESULT
Table 14.2.x.x Change in Pain Intensity from Baseline to Week xx
Pair wise treatment comparison PARAM
ANALYSIS VARIABLE
REASO N
DATASET
SELECTION CRITERIA
PARAM1 Weekly Observed Frequency Rate
PARAM1 MODEL SPECIFICATION
/*-LSMENAS from proc mixed paired-wise test-*/ proc mixed data=adeff order=internal;
by avisitn;
class sitegrpn trt1pn;
model chg=trt1pn sitegrpn baseline; lsmeans trt1pn /pdiff cl;