ISSN 1549-3652
© 2010 Science Publications
Corresponding Author: Victor O. Asekunowo, Department of General Studies,Federal University of Technology, P.M.B.704, Akure, Ondo State, Nigeria
498
Seeking an Alternative Modality to the Management of Nigeria’s Fertilizer
Subsidy Scheme-An Empirical Approach to the
Case Study of Ondo State (1976-1996)
1
Victor O. Asekunowo,
1Grace T. Olutunla and
2Adebiyi G. Daramola
1
Department of General Studies, Federal University of Technology,
P.M.B. 704, Akure, Ondo State, Nigeria
2
Department of Agricultural Economics, Federal University of Technology,
P.M.B. 704, Akure, Ondo State, Nigeria
Abstract: Problem statement: The objective of Nigeria’s fertilizer subsidy scheme was to make inorganic fertilizers readily available to farmers at affordable prices in order to boost food production in the country. Shortly into the scheme, farmers complained that fertilizers were not received at the time of need and in sufficient quantities. Approach: Using Ondo State, Nigeria as a case study, to determine; inter alia, if the farmers’ complaints were founded and if so, to design alternative ways of administering the scheme such that the lofty goals for which it was established could be realized. Methodology: Primary data were collected from 596 farmers randomly selected from the state. Secondary data were collected from purposively selected NAFCON, AISC, ADP, FPDD (now FFD) and a published book source. The primary data were analyzed with the use of descriptive statistics such as percentages and means. The secondary data were analyzed with the use of OLS and TLS regression methods. Results: The descriptive analyses showed that farmers in Ondo State did not receive their fertilizer supplies in sufficient quantities and at the time of need, despite the fact that supply surpassed adoption (demand) for most years of the study period. The inferential analyses showed that a subsidy introduced into NAFCON and other producing firms’ production processes would engender increased output and induce fertilizer prices to fall in Ondo State. Conclusion: These results showed that farmers in Ondo State did not receive their fertilizer supplies at the time of need and in sufficient quantities due to leakages and diversion of the substance from the vast bureaucratic distribution channels. As an alternative, if subsidy was administered through the producing firms’ production processes, output of fertilizers would have increased making the market supply curve of fertilizers to shift to the right. This would have also caused the price of fertilizer to fall in the state.
Key words: Fertilizer subsidy, retention price, fertilizer industry, NAFCON, quantity of fertilizers INTRODUCTION
Consequent upon a sharp decline in the rate of growth of food and fiber production especially in the late 1960s and early 1970s, successive Federal Governments in Nigeria, since the early 1970s, have instituted some agricultural programs with a view to solving this problem. The Agricultural Development Project (ADP) was established in 1975 as an input distribution and delivery system, which ensured that farmers did not have to travel more than 5-15 km to purchase needed farm inputs. Because of the importance of fertilizer amongst other inputs, it has occupied a prominent place in the national agricultural policy. Thus, purchases of inorganic fertilizers such as
Compound Fertilizer (NPK), Urea Fertilizer and Single Super phosphate Fertilizer (SSP) by the Federal Government from domestic fertilizer producers were used to supplement foreign procurement and distributed to farmers all over the Federation at heavily subsidized rates.
inefficiencies in the administration of the program in Ondo State, Nigeria from 1976-1996, to analyze the supply and demand patterns of fertilizers in Ondo State during the study period and to design market intervention aimed at removing likely inefficiencies in the present administration of the scheme. The study concludes by making recommendations.
Literature review and theoretical framework: Subsidy as a policy instrument has been used by governments worldwide to pursue different sectoral objectives. This review therefore would not be limited to subsidy as it affects production in the fertilizer industry alone but would also review production subsidies in other areas such as industrial subsidy and cotton production subsidy.
In India for instance, the government instituted a policy of input price subsidization in the fertilizer industry and then removed it during the era of deregulation and liberalization. Schumacher and Sathaye (1999) investigated the relationship between input usage, productivity and growth in the value of output in India’s fertilizer industry during the subsidization years (1973-1991) and the liberalization years (1991-1993). During the subsidization years, the difference between the retention price (mainly based on production cost) and the ceiling on the prices of fertilizers sold to the farmers was the level of input subsidization to the fertilizer industry. The study used cross state and national time series data. Kendrick and translog cost function (variants of production functions) approach were adopted. Also adopted was Solow approach which assumed a neo-classical Cobb-Douglas specification of production function with constant returns to scale, perfect competition in the market and factors being rewarded their marginal products.
Specifying the growth value of output as the dependent variable and labor, capital, energy and material inputs as the independent variables, Schumacher and Sathaye (1999) submitted that on the average, total input usage, total productivity and value of output growth annually were 9.81, 3.60 and 13.41% respectively during the subsidization years. They also found that input usage, total productivity and value of output annually were -2.18, -8.44 and -10.62% respectively during the liberalization years. The findings of the study concerning the subsidizing years seemed to confirm the submission of Lingard (2002) that subsidies will increase the use of variable production inputs. Disagreeing with these submissions, Zalla and Saad (1998) in their study on fertilizer production and marketing in Egypt found that following the elimination of subsidies (in 1992), the domestic
production of nitrogenous fertilizers increased by 3.6% per year, while the production of phosphate grew by just over 1%.
When discussing the issue of fertilizer production subsidy around the world, two eras stand out: The era of monopoly in production, purchase and distribution of fertilizers in the 1970s and the very early 1980s and the era of deregulation and liberalization which started in the mid 1980s. Considering the era of monopoly, subsidization to producers of fertilizers can be of two types: direct payment based on the per unit of fertilizers produced or input price support. The latter has been widely adopted by governments albeit with varying degree of modifications.
Subsidies to fertilizer producers have been used to stimulate domestic fertilizer production to ensure adequate and timely supply, save foreign exchange and promote economic development especially in countries with high energy cost or dependence on imported raw materials. Nitrogen production has been subsidized in India, Bangladesh, Indonesia, Mexico and Egypt whereas phosphate production has been subsidized in India, Indonesia, China, Morocco and Pakistan (IFDC, 2003b). For different studies on Phillipines, India and Egypt (David and Balisacan, 1981; Ranade and Kapur, 2001). In these countries, the production subsidies work thus: the production costs (which usually consists of the cost of feedstock, energy) are first calculated. This is referred to as the retention price. The ceiling price at which fertilizers are sold to the farmers is then subtracted from the retention price. The difference is the per unit input price subsidy paid to the producers in the fertilizer industry.
to emphasize the need to reduce transaction costs (supply side approach) involved in fertilizer distribution (IFDC, 2003a; 2003b; Nagy and Edun, 2002; Debra, 2001). Models in these studies used simple linear supply and demand equations in which supply and demand were the endogenous variables and price was the only exogenous variable. The studies suggested that an embrace of a supply-side, market friendly fertilizer distribution framework would induce the Shifting of the Supply Curve to the Right (SSCR) so that at equilibrium, the unit price of fertilizer would fall and the quantity of fertilizer supplied would rise.
The factors that engender a market friendly fertilizer distribution system and hence a reduction in the transaction cost of fertilizer distribution according to the studies are: the creation of a conducive macro policy, declaration and adherence to consistent input marketing policy, building human capital for market development, improving access to finance, developing and implementing regulatory frameworks, promoting market transparency through market information systems, promoting technology transfer activities and strengthening research capacity for promoting the private seed industry.
Gadzey et al. (2005) in trying to examine the effectiveness of industrial subsidies on manufacturing output in state of Alabama, USA used panel data across 20 counties in the state from 1970-1999 in the pooled regression. The independent variables were county subsidies, population density and the usage bill. The dependent variable was industrial output. The empirical results showed that subsidies have a positive effect on county output. Specifically, the coefficient of the subsidies variable indicated an impact of $ 6.61 per $1000 of grant.
Studies have also been carried out that showed, inter alia, the effect of subsidy on output or production. In the fall of 2002 Brazil brought a complaint about US cotton subsidies to the dispute settlement panel of the W T O. Brazil claimed that US support for cotton granted in the period 1999-2002 exceeded that level allowed under WTO agreements and therefore caused the world price of cotton to fall. Sumner (2003) used econometric model adapted from and largely based on the key supply and demand elasticity’s from the well-known and respected Food and Agricultural Policy Research Institute (FAPRI) to examine by simulation the export and world price effects of removing the six major US subsidies supporting US production and export of Upland cotton.
The simulation model used made some assumptions on the elasticity’s on the variables. These variables are the expected price yield, marketing loan
benefits yield, production flexibility contract payment, direct payments, market loss assistance payments, counter-cyclical payments, crop insurance subsidy and cost per acre were specified in the supply equation (proxied by expected revenue because it is expected that subsidies that increase the expected net revenue per acre planted would naturally increase the quantity supplied). The variables that entered into the demand equation are price minus domestic step 2 payment, price minus export step-2 payment and export credit. Based on the assumption made on the supply and demand elasticity’s, the baseline figures were derived for US cotton production, US exports, US mill use of cotton, US average price and world price when the subsidies were assumed to be in place. A policy scenario which assumed that the subsidies were removed was thereafter simulated.
Sumner (2003) submitted that removing the subsidies simultaneously would cause a fall in US exports on the average by almost 43%, would cause the US market price on the average to rise by 15.2% and would cause the world price of Upland cotton to rise on the average by about 11.6%.
Poonyth et al. (2004) assuming different elasticity’s in the computation of the baseline figures, used essentially the same variables in their supply and demand equations. The baseline figures derived were subjected to the Agricultural Trade Policy Simulation Model (ATPSM). They simulated a policy scenario that assumed the removal of cotton subsidies would reduce world price cotton between 3.1 and 4.8%. They also estimated that cotton output in non-subsidizing countries would reduce by 2%. Output was also estimated to decrease by 15% in the United States and by 32% in the EU Countries.
Shepherd (2005) used Vector Auto Regression (VAR) model in which the following variables were modeled as the endogenous variables: nominal world price of cotton, total world consumption of cotton, change in the level of total world stocks of cotton. The model then specified the lagged values of the preceding variables and subsidies as the exogenous variables. Shepherd (2005) found that the world production of cotton responded to a subsidy shock. He however found that the response of price to subsidy shock was not as robust as reported in the studies of Goreux (2004); Sumner (2003) and Poonyth et al. (2004).
MATERIALS AND METHODS
the study because they are in the main riverine areas where food crop farming is not known to be largely practiced; therefore, fertilizers are not adopted in these areas. The remaining sixteen Local Government Areas constituted the study area. However, owing to financial constraints, the sample was chosen from twelve Local Government Areas. These Local Government Areas were divided into three different climatic zones into which state could be divided i.e. the Southern zone, the Central zone and the Northern zone. The Southern zone comprised the following Local Government Areas-Irele, Okitipupa, Odigbo and Ondo West Local Government Areas; the Central zone comprised the following Local Government Areas-Akure-South, Akure-North, Idanre and Ile-Oluji/Okeigbo Local Government Areas and the Northern zone comprised the following Local Government Areas-Akoko Northwest, Akoko Southwest, Akoko Northeast and Akoko Southeast.
The target groups were from these Local Government Areas. The target groups were the farmers who have adopted fertilizers during the study period, governmental agencies within the state such as Agricultural Development Project (ADP), Agricultural Input Supply Company (AISC), governmental agencies outside the state such as the National Fertilizer Company of Nigeria (NAFCON which stopped production of fertilizers in 1999 and is now acquired by NOTORE (a chemical company) under the Nigerian Government’s policy of privatization of State Owned Enterprises. NOTORE is yet to start production of fertilizers) and the Fertilizer Procurement and Distribution Department (FPDD) now the Federal Fertilizer Department (FFD). All these agencies have valuable information which is pertinent to the study in their archives.
Samples were drawn from the twelve Local Government Areas in the three zones. Primary data were collected with the use of questionnaires administered on the target groups. A total number of eight hundred and sixteen questionnaires were sent out for administration on the farmers in the twelve Local Government Areas i.e., sixty-eight questionnaires were sent to each Local Government Area. Farmers who have adopted fertilizers during the study period were randomly selected and questions concerning whether they received their fertilizers in sufficient quantities and at the time of need, fertilizer usage and point of collection of fertilizers were asked by Enumerators. Purposive sampling was utilized to collect secondary data from the governmental agencies by the researchers. Data on the quantities of fertilizers received in Ondo state were collected from AISC and ADP. Data on the
quantities of fertilizers sent to Ondo state were collected from FPDD now FDD. Data on the income of farmers and the quantities of fertilizers consumed in Ondo state were collected from ADP. Data on the quantities of fertilizers produced and the prices of inputs used in the production process were collected from NAFCON.
Secondary data on the prices of fertilizers were collected from the Report of the Fertilizer Inventorization Study Team. Indexes were constructed on NAFCON’s fertilizer production; NAFCON’s input (equipment, replacement parts, labor, materials) usage without subsidy, NAFCON’s input usage with subsidy. The indexes were expressed in quarterly figures. The prices of fertilizers and the prices of the inputs in the base year i.e., 1976 were used as weights. According to Shao (1976) “when the weight is the number of the base year (that is, w = qo or w = po), the index is called Laspeyres index”.
The data collected on the farmers from the questionnaires were descriptively analyzed. The indexes constructed on NAFCON’s production of fertilizers, NAFCON’s input usage with or without subsidy were fitted into Ordinary Least Squares (OLS) regression models and econometrically analyzed. The data collected on the quantities of fertilizers produced without subsidy and supplied to Ondo state by NAFCON, the quantities of fertilizers produced with subsidy and supplied to Ondo state by NAFCON, the prices and quantity demanded of fertilizers in Ondo state were fitted into Two-Stage Least Squares (TLS) regression models and econometrically analyzed: Model (A):
n o n o
i
o o o o
Q P q p
Log Log U
Q P q p
∑ ∑
= ∂ + θ +
∑ ∑ (1)
Where: n o
o o Q P Log
Q P
∑
∑ = Weighted quantity index of fertilizers
produced by NAFCON ∂ = Intercept term
θ = Estimator of weighted index of input usage by NAFCON without subsidy variable
n o
o o q p q p
∑
∑ = Weighted index of input usage by
NAFCON without subsidy variable (inputs are labor, equipment replacement parts, materials)
Model (B):
n o n o
i
o o o o
Q P q P (1 s)
Log Log U
Q P q p
+
∑ ∑
= ∂ + θ +
∑ ∑ (2)
n o n o s n o
i
o o o o o o
Q P q P q P
Log Log Log U
Q P q P q P
∑ ∑ ∑
⇒ = ∂ + θ + λ +
∑ ∑ ∑ (3)
Where: n o
o o Q P Log
Q P
∑
∑ = Weighted index of fertilizers produced
by NAFCON ∂ = Intercept term
θ = Estimator or coefficient of weighted inputs without subsidy
Log n o o o q P (1 s)
q p +
∑
⇒ ∑
Log n o o o q P q p
∑
∑ = Index of input usage without subsidy
Log s n o o o q P q p
∑
∑ = Index of input usage induced by
subsidy: Model(Ci):
fso o 1 m 1t
Q = β + βP +U (4a)
fdo o 1 m 2 t
Q = α + αP +U (4b)
o, ,1 o 0 and 1 0
β β α > α <
Where:
Qfso = Quantity of fertilizers shipped to Ondo state and assumed produced without subsidy
βo = Intercept term of supply equation β1 = Estimator
Pm = Price of fertilizer in supply and demand equations
U1t = Stochastic disturbance term
Qfdo = Quantity of fertilizers used (adopted) by farmers in Ondo State
αo = Intercept term of demand equation
α1 = Estimator of average price of fertilizers in demand equation
U2t = Stochastic disturbance term
The equations in model (Ci) are dependent in that any disturbance caused by U1t such as strikes, tariffs, exchange rate fluctuations would affect Pm in both equations. Likewise, a disturbance caused by U2t like increase in income of farmers, increase in hectares of
land cultivated by farmers would affect Pm in both equations. Consequently, Pm should be regarded as an endogenous variable just like Qfso and Qfdo in this system of structural equations. According to Gujarati (1987), “a regression of Q on Pm would violate an important assumption of the classical linear regression model, namely, the assumption of no correlation between the explanatory variable (s) and the disturbance term”. In his view, if this is ignored, “the least-squares estimators are not only biased but also inconsistent; that is, as the sample size increases indefinitely, estimators do not converge to their true (population) values (Gujarati, 1987).
As a way out of this, two new variables, Pm-1 (lagged one value of the average price of fertilizers) and I (the average income of farmers) were introduced into the structural linear supply and demand functions respectively. Model (Ci) then becomes:
Model (Cii):
fso o 1 m 2 m 1 1t
Q = β + βP + βP − +U (5a)
fdo o 1 m 2 2t
Q = α + αP + α +I U (5b)
From this new system of equations, reduced form equations could be derived in which Q and Pm (endogenous) variables are expressed in terms of pre-determined (exogenous) variables I and Pm-1:
m 0 1 m 1 2 t
P = ∏ +∏ P − + ∏ +I V (6)
3 4 m 1 5 t
Q= ∏ +∏ P − + ∏ +I W (7)
Where:
0 0 0
1 1 α − β ∏ =
β − α (8)
2 1
1 1 α ∏ =
β − α (9)
2 2
1 1 −β ∏ =
β − α (10)
2t 1t t
1 1
U U
V = −
β − α (11)
0 1 1 0 3
1 1 α β − α β ∏ =
β − α (12)
1 2 4
1 1 α α ∏ =
1 2 5
1 1 −α β ∏ =
β − α (14)
1 2t t 1t t
1 1
U U
W =α − α
β − α (15)
From the six reduced-form equations
(
∏ ∏ ∏ ∏ ∏0, 1, 2, 3, 4and∏5)
six structural coefficients or estimators ( , ,β β β α α0 1 2, 0, 1andα2)can be indirectly estimated:
Model (Di):
O
fss 0 1 m 1t
Q = β + βs P +U (16a)
O
fd 0 1 m 2 t
Q = α + αP +U (16b)
Note that factor s is attached to the intercept term which is expected to cause the supply curve (Qfsso) to shift to the right to intersect a stationary demand curve (Qfdo). Assumption here is that the fertilizers shipped to Ondo State are produced with a subsidy.
Again, because the system of equations in (Di) are dependent which may lead to biased and inconsistent estimators, the lagged value of average price of fertilizers (Pm-1) and average income of farmers (I) are introduced. Model (Di) becomes:
Model (Dii):
fsso 0 1 m 2 m 1 1t
Q = β + βs P + βP − +U (17a)
O
fd 0 1 m 2 2 t
Q = α + αP +a I+U (17b)
From this, reduced form equations are derived in which Q and Pm (endogenous) variables are expressed in terms of pre-determined (exogenous) variables I and Pm-1:
m 0 1 m 1 2 t
P = ∏ +∏ P − + ∏ +I V (18)
3 4 m 1 5 t
Q= ∏ +∏ P − + ∏ +I W (19)
Where:
0 0 0
1 1 α − β ∏ =
β − α (20)
2 1
1 1 α ∏ =
β − α (21)
2 2
1 1 −β ∏ =
β − α (22)
2t 1t t
1 1
U U
V = −
β − α (23)
0 1 1 0 3
1 1 s α β − α β ∏ =
β − α (24)
1 2 4
1 1 α α ∏ =
β − α (25)
1 2 5
1 1 −α β ∏ =
β − α (26)
1 2t 1 1t t
1 1
U U
W =α − α
β − α (27)
From the six reduced form equations,
(
∏ ∏ ∏ ∏ ∏0, 1, 2, 3, 4and∏5)
six estimators(
β β β α αo, ,1 2, o, 1andα2)
can be indirectly estimated.RESULTS
The empirical findings consist of two parts: descriptive statistics findings and inferential statistics findings.
Descriptive statistics results: Out of the 816 questionnaires sent out through the enumerators, 596 of them were completed. About 596 was therefore the sample size. 220 of the questionnaires were returned by the Enumerators uncompleted. The reason being that in the course of the interview between the Enumerators and some respondents, the Enumerators discovered that such respondents could not be included in the study because they did not use fertilizers during the study period. The mean value of the response rate in the three zones was 73%. The questionnaire taken to Agricultural Input Supply Company (AISC), Akure, National Fertilizer Company of Nigeria (NAFCON), Fertilizer Procurement and Distribution Department (FPDD) Abuja now Federal Fertilizer Department (FFD), Abuja and ADP, Akure by the researchers were completed and promptly returned to the researchers. So, the response rate of these organizations was 100%.
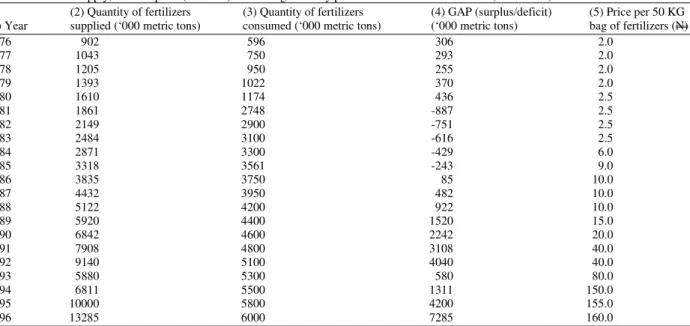
Table 1: Fertilizer supply, Consumption (Demand) and average subsidy price of fertilizers in Ondo State (1976-1996)
(2) Quantity of fertilizers (3) Quantity of fertilizers (4) GAP (surplus/deficit) (5) Price per 50 KG (1) Year supplied (‘000 metric tons) consumed (‘000 metric tons) (‘000 metric tons) bag of fertilizers (N)
1976 902 596 306 2.0
1977 1043 750 293 2.0
1978 1205 950 255 2.0
1979 1393 1022 370 2.0
1980 1610 1174 436 2.5
1981 1861 2748 -887 2.5
1982 2149 2900 -751 2.5
1983 2484 3100 -616 2.5
1984 2871 3300 -429 6.0
1985 3318 3561 -243 9.0
1986 3835 3750 85 10.0
1987 4432 3950 482 10.0
1988 5122 4200 922 10.0
1989 5920 4400 1520 15.0
1990 6842 4600 2242 20.0
1991 7908 4800 3108 40.0
1992 9140 5100 4040 40.0
1993 5880 5300 580 80.0
1994 6811 5500 1311 150.0
1995 10000 5800 4200 155.0
1996 13285 6000 7285 160.0
Sources: Column (2): FPDD and AISC Data Files; Column (3): ADP Data Files; Column (4): Computed by authors; Column (5): Ayoola et al. (2002). Towards a fertilizer regulatory and quality assurance system for Nigeria: An inventorization of the fertilizer sector, Federal Fertilizer Department (FFD), Federal Ministry of Agriculture and Rural Development, Abuja, p. xxiv of table of content
One of the key issues addressed by the questionnaires was the issue of the availability of fertilizers to farmers. About 72.33% of the farmers reported not receiving their fertilizers in sufficient quantities in the three zones, while 27.67% of the farmers reported receiving their fertilizers in sufficient quantities. 66% of the farmers in the three zones reported not receiving their fertilizers at the time of need while 34% reported receiving their fertilizers at the time of need.
Table 1 shows that the excess of supply of fertilizers over demand or consumption was on the average about 1715 metric tons per year while the excess of demand over supply was on the average about 585 metric tons annually.
Inferential statistics results: This sub-section presents the regression results of NAFCON’s output of fertilizers without subsidy, the effect of subsidy on NAFCON’s output of fertilizers with subsidy, the effect of NAFCON’S fertilizer output without subsidy on the quantity and price of fertilizers in Ondo State, the effect of NAFCON’s output of fertilizers with subsidy on the quantity and price of fertilizers in Ondo State.
The choice of double log functional form in all the regression models in Table 2 over all other functional forms was premised on the fact that double log functional forms yielded better estimates. All the regression models were treated for first order positive serial autocorrelation with the use of Cochrane-Orcutt iteration procedure.
Models (A) and (B) are OLS regressions to show the effect of subsidy introduced at the plant level in form of input price support on the production of fertilizers by NAFCON. First, in model (A), the index of production of fertilizers by NAFCON was regressed on input index without subsidy. Second, in model (B), the index of production of fertilizers by NAFCON was regressed on input index without subsidy and index of input usage induced by the introduction of a subsidy. The subsidy rate was a 50% across-the-board input price support. The justification for this was that this was the subsidy rate granted on fertilizer subsidy by the Federal Government of Nigeria during the period of observation of NAFCON’s production process.
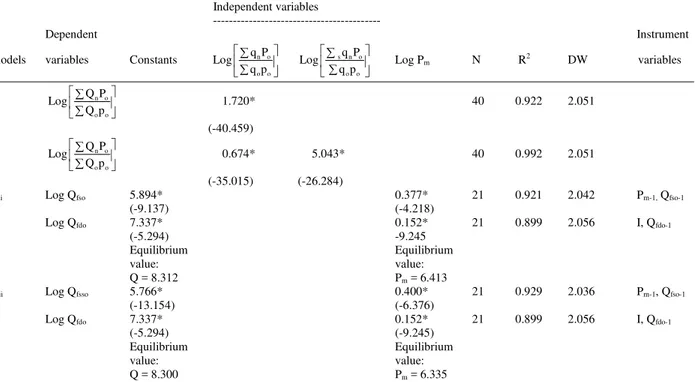
Table 2: Ordinary least squares and two-stage least squares regression results Independent variables
---
Dependent Instrument
Models variables Constants n o o o
q P Log
q p
∑
∑
s n o o o
q P Log
q p
∑
∑
Log Pm N R
2 DW variables
A n o
o o
Q P Log
Q p
∑
∑
1.720* 40 0.922 2.051
(-40.459)
B n o
o o
Q P Log
Q p
∑
∑
0.674* 5.043* 40 0.992 2.051
(-35.015) (-26.284)
Cii Log Qfso 5.894* 0.377* 21 0.921 2.042 Pm-1, Qfso-1
(-9.137) (-4.218)
Log Qfdo 7.337* 0.152* 21 0.899 2.056 I, Qfdo-1
(-5.294) -9.245
Equilibrium Equilibrium
value: value:
Q = 8.312 Pm = 6.413
Dii Log Qfsso 5.766* 0.400* 21 0.929 2.036 Pm-1, Qfso-1
(-13.154) (-6.376)
Log Qfdo 7.337* 0.152* 21 0.899 2.056 I, Qfdo-1
(-5.294) (-9.245)
Equilibrium Equilibrium
value: value:
Q = 8.300 Pm = 6.335
Note: (i) *: Significant at 5% level; (ii) t ratios in parentheses; (iii) Computed by authors
Model (Cii) is a two-stage least squares regression of quantity of fertilizers supplied to Ondo State without subsidy and quantity adopted (demanded) of fertilizers in Ondo State on the price of fertilizers in Ondo State. It must be noted that the value of the intercept term in the supply equation is 5.894. When the two equations are set equal to each other, the value of Pm is 6.413 and the value of Q is 8.312.
Model (Dii) is also a two stage least squares regression of quantity of fertilizers supplied to Ondo State with subsidy and quantity adopted (demanded) of fertilizers in Ondo State on the price of fertilizers in Ondo State. It must be noted that the value of the intercept term in the supply equation decreased to 5.766 due to the fact that the variable Qfso was multiplied by a scalar (s = 5.043%) which was what the empirical result in model (B) suggested i.e., the supply curve in model (A) was to shift to the right due to the input price support (subsidy). The demand equation remains the same and when the two equations are set equal to each other, Pm is 6.335 and Q is 8.300.
The empirical results show that due to the introduction of a subsidy into the production process of NAFCON, more fertilizers are produced which caused the market supply curve of fertilizers in Ondo State to shift to the right causing the price of fertilizers at equilibrium in Ondo State to reduce while the quantity of fertilizers remains relatively unchanged.
DISCUSSION
From the findings from this study, it has been shown that the majority of the farmers in Ondo State who used fertilizers did not get the subsidized substance in sufficient quantities and at the time of need. This was so despite the fact that evidence shows that the supply of fertilizers consistently surpassed adoption (demand) during the study period.
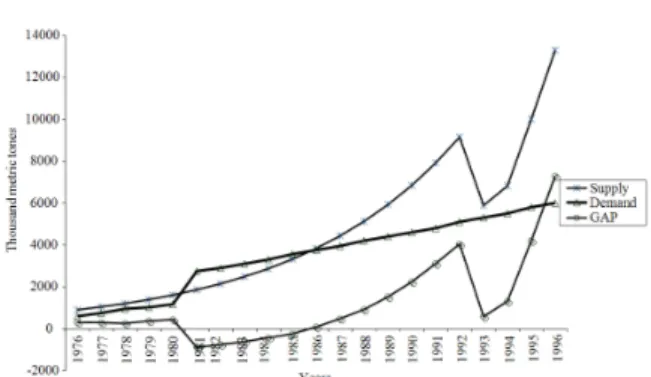
Figure 1 shows that except for about 5 years of the study period i.e., from 1981-1985; supply of fertilizers constantly surpassed adoption (demand).The reason may be due to the fact that in 1979, the Green Revolution Program was introduced. Under this program, farmers were encouraged to adopt fertilizers and this probably spurred an increase in the adoption of fertilizers by farmers in Ondo State in the several years that immediately followed the introduction of the program.
Fig. 1: Trend in fertilizers supply, adoption (demand) and supply/adoption (demand) GAP in Ondo State (1976-1996)
Hence, the National Fertilizer Company of Nigeria (NAFCON) was founded in 1988. The ensuing increase in domestic production may have widened the supply/demand gap.
Findings from this study have also shown that instead of allowing the farmers to enjoy subsidy when they take delivery of the subsidized substance at the ADP/AISC, the subsidy can be introduced at the plant level i.e., by subsidizing NAFCON’s production of fertilizers. This will cause the supply curve of fertilizers to shift to the right due to the increased output induced by the subsidy. This will cause the market price of fertilizers to reduce in Ondo State while the quantities of fertilizers available in the market in Ondo State remain relatively unchanged as shown in Table 1. A calculation of the price elasticity of demand of fertilizers from the beginning to the end of the study period in Table 1 showed a coefficient of elasticity of 0.011 which was close to zero.
CONCLUSION
From the findings of this study, it can be concluded that during the study period, farmers in Ondo State adopted subsidized fertilizers. The fertilizers were distributed to the farmers through a long web of bureaucratic network. This network unwittingly encouraged the leakage or diversion of the fertilizers. This leakage or diversion prevented the fertilizers from getting to the farmers at the time of need and insufficient quantities. These violated the principle of inclusion i.e., the subsidy was not specific or not well targeted causing the intended beneficiaries to be excluded.
When the issue of an alternative way of administering the program was considered, it was discovered that introducing the subsidy via the production process of NAFCON would engender
increased output of fertilizers (NPK and Urea). The increased output would cause the prices of the fertilizers to decrease in Ondo State. However, the quantities of fertilizers adopted would remain relatively unchanged because of the inelastic nature of the farmers’ adoption or demand schedule for fertilizers in Ondo State.
The following are therefore recommended: the fertilizer prices in Nigeria should continue to be subsidized, but the modality of targeting must change such that the intended beneficiaries are not excluded.
The distribution logistics as it exists presently must be scrapped. The vast bureaucratic network through which fertilizers are distributed to the farmers must be totally by-passed. In its place, a system of distribution that is market-based must be instituted. This can be realized when the subsidy is introduced at the plant level. This will lead to increased output of fertilizer by NAFCON. A positive economic externality derivable from this is that fertilizers would be made available to farmers in Ondo State at reduced prices. However, the quantities of fertilizers available due to this reduction may not change because of the inelastic nature of farmers’ fertilizers adoption or demand schedule in Ondo State. In order to make the schedule less inelastic, it is recommended that the Federal Government of Nigeria adopts a policy of an across-the-board subsidization of all fertilizer producing firms. This would encourage entrepreneurs to venture into fertilizer production thereby causing many firms of varying sizes to compete in the fertilizer industry i.e., creation of an industry that is monopolistically competitive. In return, all benefiting firms must submit themselves to the regulatory framework of the government in terms of internal management (productivity, due process in purchases) and quality control.
REFERENCES
Ayoola, G.B., V.O. Chude and A.H. Abdulsalam, 2002. Towards a fertilizer regulatory and quality assurance system for Nigeria. Federal Ministry of Agriculture and Rural Development.
David, C.C. and A.M. Balisacan, 1981. An analysis of fertilizer policies in the Philippines. Philippine J.
Dev., 8: 21-37.
http://ideas.repec.org/a/phd/pjdevt/jpd_1981_vol._ viii_nos._1&2-b.html
Debra, K., 2001. Agricultural subsidies in sub-Saharan Africa: A reflection. IFDC Africa Division. Gadzey, A., H. Thompson and O.A. Yeboah, 2005.
Goreux, L., 2004. Prejudice caused by industrialized countries subsidies to cotton sectors in Western and Central Africa. WTO.
Gujarati, D.N., 1987. Basic Econometrics. 1st Edn. McGraw-Hill, Auckland, ISBN: 10: 0070251827, pp: 462.
IFDC, 2003a. An action plan for developing agricultural input markets in Uganda. IFDC. http://pdf.usaid.gov/pdf_docs/PNACT958.pdf IFDC, 2003b. Input subsidies and agricultural
development: Issues and options for developing and transitional economies. IFDC. http://governmentpaid.com/input-subsidies-and- agricultural-development-issues-and-options-for-developing-and-transitional-economies
IFDC, 2005. Developing Agricultural input markets in
Nigeria (DAIMINA). IFDC.
http://pdf.usaid.gov/pdf_docs/PDACD463.pdf Lingard, J., 2002. Agricultural subsidies and
environmental change. Wiley.
Nagy, J.G. and O. Edun, 2002. Assessment of Nigerian government fertilizer policy and suggested alternative market-friendly policies, international fertilizer development centre. Muscle Shoals, Alabama.
Poonyth, D., A. Sarris, R. Sharma and S. Shui, 2004. Modeling the impact of cotton subsidies: The key
analytical issues. FAO.
ftp://ftp.fao.org/docrep/fao/007/j2731e/j2731e00.pdf Ranade, A. and G. Kapur, 2001. Sector report:
Pharmaceutical industry. ABNAMRO.
Robin, S., R .Wolcott and C.E. Quintela, 2003. Perverse subsidies and the implications for biodiversity: A review of recent findings and the status of policy reforms. Proceeding of the 5th World Parks Congress: Sustainable Finance Stream, Sept. 2003, Durban, South Africa, pp: 1-11. http://www.conservationfinance.org/guide/WPC/W PC_documents/Overview_PanB_Wolcott_v2.pdf Schumacher, K. and J. Sathaye, 1999. India’s fertilizer
industry: Productivity and energy efficiency. Environmental Energy Technologies Division. http://ies.lbl.gov/iespubs/41846.pdf
Shao, P.S., 1976. Statistics for Business and Economics. 13rd Edn., Macmillan Publishing Company, Columbus, Ohio, ISBN: 10; 067508640X, pp: 832.
Shepherd, B., 2005. The impact of US subsidies on the world cotton market: A reassessment. EconWPA. http://ideas.repec.org/p/wpa/wuwpit/0511012.html Sumner, D.A., 2003. The impacts of US cotton subsidies on cotton prices and quantities: Simulation analysis for the WTO dispute. WTO. http://www.ncsu.edu/project/arepublication/Effects _US_Cotton_Subsidies.pdf