Circuitry of Subjects with Major Depressive Disorder
Anne J. Blood1,3,5, Dan V. Iosifescu1,6, Nikos Makris1,4, Roy H. Perlis1,2, David N. Kennedy4,5, Darin D. Dougherty1, Byoung Woo Kim1,3, Myung Joo Lee1,3, Shirley Wu1, Sang Lee1,3, Jesse Calhoun1,3, Steven M. Hodge1,3,4, Maurizio Fava1,2, Bruce R. Rosen3, Jordan W. Smoller1,2, Gregory P. Gasic1,3, Hans C.
Breiter1,3* for the Phenotype Genotype Project on Addiction and Mood Disorders
1Depression Clinic and Research Program, Mood and Motor Control Laboratory, Addiction Research Program, Laboratory of Neuroimaging and Genetics, Department of Psychiatry, Massachusetts General Hospital and Harvard Medical School, Boston, Massachusetts, United States of America,2Psychiatric and Neurodevelopmental Genetics Unit and Center for Human Genetic Research, Massachusetts General Hospital and Harvard Medical School, Boston, Massachusetts, United States of America,3Motivation and Emotion Neuroscience Collaboration (MENC) and Athinoula A. Martinos Center for Biomedical Imaging, Department of Radiology, Massachusetts General Hospital and Harvard Medical School, Boston, Massachusetts, United States of America,4Center for Morphometric Analysis and Center for Integrative Informatics, Massachusetts General Hospital and Harvard Medical School, Boston, Massachusetts, United States of America,5Department of Neurology, Massachusetts General Hospital and Harvard Medical School, Boston, Massachusetts, United States of America,6Mount Sinai School of Medicine, New York, New York, United States of America
Abstract
Background:Previous studies of major depressive disorder (MDD) have focused on abnormalities in the prefrontal cortex and medial temporal regions. There has been little investigation in MDD of midbrain and subcortical regions central to reward/aversion function, such as the ventral tegmental area/substantia nigra (VTA/SN), and medial forebrain bundle (MFB).
Methodology/Principal Findings:We investigated the microstructural integrity of this circuitry using diffusion tensor imaging (DTI) in 22 MDD subjects and compared them with 22 matched healthy control subjects. Fractional anisotropy (FA) values were increased in the right VT and reduced in dorsolateral prefrontal white matter in MDD subjects. Follow-up analysis suggested two distinct subgroups of MDD patients, which exhibited non-overlapping abnormalities in reward/aversion circuitry. The MDD subgroup with abnormal FA values in VT exhibited significantly greater trait anxiety than the subgroup with normal FA values in VT, but the subgroups did not differ in levels of anhedonia, sadness, or overall depression severity.
Conclusions/Significance:These findings suggest that MDD may be associated with abnormal microstructure in brain reward/aversion regions, and that there may be at least two subtypes of microstructural abnormalities which each impact core symptoms of depression.
Citation:Blood AJ, Iosifescu DV, Makris N, Perlis RH, Kennedy DN, et al. (2010) Microstructural Abnormalities in Subcortical Reward Circuitry of Subjects with Major Depressive Disorder. PLoS ONE 5(11): e13945. doi:10.1371/journal.pone.0013945
Editor:Alessandro Bartolomucci, University of Minnesota, United States of America
ReceivedMay 13, 2010;AcceptedSeptember 16, 2010;PublishedNovember 29, 2010
Copyright:ß2010 Blood et al. This is an open-access article distributed under the terms of the Creative Commons Attribution License, which permits unrestricted use, distribution, and reproduction in any medium, provided the original author and source are credited.
Competing Interests:The authors have included all potential competing interests as follows. This does not alter the authors’ adherence to all the PLoS ONE policies on sharing data and materials. Dr. Iosifescu has received research support from Aspect Medical Systems, Forest Laboratories and Janssen Pharmaceutica; he has been a consultant for Forest Laboratories, Gerson Lehrman Group and Pfizer, Inc., and he has been a Speaker for Cephalon, Inc., Eli Lilly and Co., Forest Laboratories and Pfizer, Inc. Dr. Dougherty currently has research support and does consulting with honoraria for Medtronic, Eli Lilly, Brand Ideas, and McNeil, does consulting with honoraria for Reed Elsevier, and has research support from Cyberonics. In the past (more than one year ago), he has had research support and done consulting with honoraria for Northstar Neuroscience, has done consulting with honoraria for Jazz Pharmaceuticals, Wyeth, Bristol Myers Squibb, Trancept Pharmaceuticals, Cyberonics, JK Associates, Inc., American Psychiatric Publishing, Inc., Advocate Health and Hosp. Corp., DHHS/NIH, Leering Swann LLC, Oxford University Press, Professional Practice Group/Psychiatry Syracuse, and Y&R Inc. DBA Sudler & Henessy, and has had research support from Forest and Cephalon. Dr. Rosen is an MRI and PET research sponsor for Siemens. Dr. Fava has received research support from Abbott Laboratories, Alkermes, Aspect Medical Systems, Astra-Zeneca, BioResearch, BrainCells, Inc., Bristol-Myers Squibb Company, Cephalon, Clinical Trial Solutions, LLC, Eli Lilly and Company, Forest Pharmaceuticals Inc., Ganeden, GlaxoSmithKline, J and J Pharmaceuticals, Lichtwer Pharma GmbH, Lorex Pharmaceuticals, NARSAD, NCCAM, NIDA, NIMH, Novartis, Organon Inc., PamLab, LLC, Pfizer Inc, Pharmavite, Roche, Sanofi-Aventis, Shire, Solvay Pharmaceuticals, Inc., Synthelabo, Wyeth-Ayerst Laboratories. He also reported performing advising/consultation with Abbott Laboratories, Amarin, Aspect Medical Systems, Astra-Zeneca, Auspex Pharmaceuticals, Bayer AG, Best Practice Project Management, Inc, BioMarin Pharmaceuticals, Inc.,Biovail Pharmaceuticals, Inc., BrainCells, Inc, Bristol-Myers Squibb Company, Cephalon, Clinical Trials Solutions, LLC, CNS Response, Compellis, Cypress Pharmaceuticals, Dov Pharmaceuticals, Eisai, Inc., Eli Lilly and Company, EPIX Pharmaceuticals, Euthymics Bioscience, Inc., Fabre-Kramer, Pharmaceuticals, Inc., Forest Pharmaceuticals Inc., GlaxoSmithKline, Grunenthal GmBH, Janssen Pharmaceutica, Jazz Pharmaceuticals, J and J Pharmaceuticals, Knoll Pharmaceutical Company, Labopharm, Lorex Pharmaceuticals, Lundbeck, MedAvante Inc., Merck, Methylation Sciences, Neuronetics, Novartis, Nutrition 21, Organon Inc., PamLab, LLC, Pfizer Inc, PharmaStar, Pharmavite, Precision Human Biolaboratory, PsychoGenics, Psylin Neurosciences, Inc., Ridge Diagnostics, Inc., Roche, Sanofi-Aventis, Sepracor, Schering-Plough, Solvay Pharmaceuticals, Inc., Somaxon, Somerset Pharmaceuticals, Synthelabo, Takeda, Tetragenex, TransForm Pharmaceuticals, Inc., Transcept Pharmaceuticals, Vanda Pharmaceuticals Inc, Wyeth-Ayerst Laboratories. He reported performing speaking/publishing for Adamed, Co., Advanced Meeting Partners, American Psychiatric Association, American Society of Clinical Psychopharmacology, Astra-Zeneca, Belvoir, Boehringer-Ingelheim, Bristol-Myers Squibb Company, Cephalon, Eli Lilly and Company, Forest Pharmaceuticals Inc., GlaxoSmithKline, Imedex, Novartis, Organon Inc., Pfizer Inc, PharmaStar, MGH Psychiatry Academy/ Primedia, MGH Psychiatry Academy/Reed-Elsevier, UBC, Wyeth-Ayerst Laboratories. He reported having equity holdings in Compellis, receiveing royalty/patent or other income from SPCD and for a combination of azapirones and bupropion in MDD, and copyright royalties for the MGH CPFQ, SFI, ATRQ, DESS, and SAFER. Drs. Blood, Makris, Perlis, Kennedy, Smoller, Gasic, and Breiter have no relevant financial interest in this manuscript. Byoung Woo Kim, Myung Joo Lee, Shirley Wu, Sang Lee, Jesse Calhoun, and Steven Hodge also have no relevant financial interest in this manuscript.
* E-mail: [email protected]
Introduction
It has been proposed that major depressive disorder (MDD) may result from dysfunction of brain reward/aversion circuit-ry[1,2,3,4,5,6,7]. Hypothesized in 1999 as a general schema for processing both positive and negative features of potential ‘‘goal-objects’’ or states [8], a generalized reward/aversion system that processes the salience of stimuli across a continuum of aversion and reward was described in multiple publications between 1996 and 2001 [9,10,11,12,13]. This work identified an extended set of brain regions as variably processing a continuum between positive and negative valence and intensity information, along with category and incidence information from goal-objects. These observations have been extensively replicated [14,15,16,17,18] and synopsized [19,20,21]. The recent report of a law-like relationship between patterns of approach and avoidance behavior to rewarding and aversive stimuli further argues that the systems processing this information do not function independently of one another [22].
The possibility that abnormalities in this reward/aversion circuitry underlie many psychiatric conditions, including MDD, was further schematized by multiple investigators [1,6,23,24]. Animal models of MDD strongly support this thesis and have hypothesized dopaminergic midbrain nuclei and the medial forebrain bundle (MFB) to be involved with the illness [7,25]; these subcortical regions are at the core of the animal literature that first identified reward circuitry [26,27,28,29,30]. In humans with MDD, there has recently been detection of functional abnormalities in these subcortical regions [2,31,32], in addition to well-established abnormalities in target regions receiving subcor-tical projections [33,34,35,36,37,38,39,40,41,42,43,44,45,46,47]. However, there has not yet been an evaluation of microstructural integrity in the midbrain nuclei or MFB.
The current study aimed to evaluate microstructural integrity of subcortical brain reward/aversion circuitry in cohorts of subjects with and without MDD, using approaches that maximized detection sensitivity in subcortical regions. Our primary hypotheses focused on evaluating brain microstructure in the midbrain ventral tegmental area/substantia nigra (VTA/SN), the medial forebrain bundle (MFB), and the amygdalofugal pathway (AFP). Our secondary a priorihypotheses were based on a general evaluation of the broad set of reward/aversion circuitry implicated in MDD [8,48].
We designed the study to take into consideration potential heterogeneity within the MDD cohort [33,37,49,50,51,52,53, 54,55,56,57], given that this is a potential confound in group designs [58]. Such an approach may not only improve methods, but may also lead to identification of subgroups of MDD. We hypothesized there would be microstructural heterogeneity in our cohort that could not be predicteda prioriby functional imaging abnormalities or symptom profiles since MDD has been hypothesized to be a systems-level disorder, and it is possible that microstructural abnormalities at different points in a distributed circuit could all lead to similar abnormalities in behavior/mood. To address this, we allowed the DTI data itself to drive potential segregation across patients.
Methods
Subjects
All subjects signed written informed consent prior to participa-tion in this study, and the study was approved by the Instituparticipa-tional Review Board of Massachusetts General Hospital (Partners Human Research Committee). All experiments were conducted in accordance with the principles of the Declaration of Helsinki.
mgh.harvard.edu)]. The 22 MDD subjects were drawn from a larger cohort of individuals with MDD (n = 47) because they met quality assurance criteria, including (a) minimal residual motion artifacts after motion correction of DTI images, (b) absence of MR susceptibility artifacts, and (c) availability of control subjects which met the strict matching criteria described above, and who also had DTI data without motion or susceptibility artifacts.
MDD subjects were excluded if they met DSM-IV criteria for primary psychotic disorders, bipolar disorder, eating disorders, substance abuse disorders, generalized anxiety disorder, panic disorder, PTSD or OCD by SCID interview (current or lifetime); healthy volunteers were excluded if they met DSM-IV criteria for any Axis I psychiatric disorder by SCID interview.
Additional exclusion criteria for both MDD subjects and healthy volunteers were: 1) currently suicidal or at risk for suicide in the judgment of the investigator; 2) pregnant women; 3) carrying a medical device incompatible with MRI (e.g., metal implants such as surgical clips or pacemakers) or significant claustrophobia or weight that would make MRI unfeasible; 4) serious medical illness including a known history of HIV-1+status; 5) Subjects with insulin dependent diabetes mellitus (IDDM) or subjects with noninsulin dependent diabetes mellitus (NIDDM) and abnormal Hemoglobin A1C; 6) severe respiratory compromise; 7) history of head trauma with neurological sequelae, including multiple concussions and/or history of stroke; 8) history of seizure disorder, delirium, dementia, or mental disorders due to general medical conditions; 9) clinical or laboratory evidence of uncontrolled hypothyroidism or hyperthyroidism; and 10) subjects which, in the opinion of the Management Group running the PGP, were not able to participate safely in this study. In addition, subjects in the larger PGP study were screened for Hepatitis C (by Hepatitis C+titer); no subjects included in this study tested positive for Hepatitis C. Three MDD subjects and one control subject had a history of tobacco use (one current smoker in MDD cohort, one current smoker in the control cohort, and two previous smokers in the MDD cohort).
In addition to screening for exclusion criteria, we also performed for all subjects (MDD and healthy controls): (1) the Structured Clinical Interview for DSM-IV for Axis I disorders (SCID-I); (2) a medical history and concurrent medication status (see Table 1 for medication status in relation to MDD subgrouping and VTA/SN FA values); (3) sociodemographic information; (4) Edinburgh Handedness assay; (5) blood and urinary analysis; (6) Inventory of Depressive Symptomatology – Self Report (IDS-SR); (7) 31-item Hamilton Rating Scale-Depression (HAM-D, [60]); and (8) the STAI (Spielberger State Trait Anxiety Inventory).
DTI Scanning Protocol
During each scanning session, a high-resolution (2 mm isotropic) whole head DTI scan was acquired on a Siemens 3.0 Tesla Sonata Magnet System (Siemens AG, Medical Solutions, Erlangen, Germany); TR = 24 s; TE = 81 ms; slice thick-ness = 2 mm, 60 slices total, 1286128 matrix, 2566256 mm FOV, 6 averages, 6 noncolinear directions with b value = 700 s/ mm2, and 1 image with b-value = 0 s/mm2. DTI scans were acquired using auto-align software [61] to normalize brain image slice orientation across subjects. Slices were situated parallel to the AC-PC line, and parallel to the inside curve of the FOC to minimize signal distortion in this region [62].
DTI Image Preprocessing and Registration
1. DTI preprocessing. All data processing was performed using Freesurfer software (http://surfer.nmr.mgh.harvard.edu) and FSL (http://www.fmrib.ox.ac.uk/fsl) processing streams. Detailed methods for preprocessing DTI data are described in Salat et al. [63].
Briefly, each tensor volume from the DTI dataset was resampled to the T2 image to correct for remaining eddy current distortion, and to correct for head motion. The fractional anisotropy (FA) metric was derived from the diffusion tensor as previously described [64]. All resulting maps were resampled to 1 mm3resolution. Images were inspected for residual motion and susceptibility artifacts; subjects with significant artifacts were excluded.
2. Image registration. FA maps were registered to a Montreal Neurological Institute (MNI) ICBM152 T2 template for the voxel-based contrast and subsequent analyses; all contrast analysis results are reported in MNI coordinates. Registration procedures (both automated and manual) were done blinded to subject and group identification. Given the small size of our areas of interest, our methods included registration techniques designed to maximize intersubject alignment in our areas of interest. Registration and analysis of the VTA/SN, in particular, has been previously shown to be valid and informative, given abnormalities have been detected in the SN in patients with Parkinson’s Disease, a population known to exhibit structural pathology in this region [65,66]. In PD patients, FA was decreased in the SN, which is consistent with neuronal loss in this region [65,66]. While the Parkinson’s studies did not use our directed registration methods,
Table 1.Antidepressant History and Status for MDD Cohort.
FA value in VTA/ SN cluster
History of treatment with antidepressants?
On antidepressant(s) at time of scanning?
Normal VTA/SN subgroup
0.263588 No No
0.332777 Yes Yes
0.353066 Yes Yes
0.362028 Yes No
0.390219 No No
0.39181 Yes No
0.410209 Yes Yes
0.417723 No No
0.434277 No No
0.43575 No No
0.448794 Yes Yes
0.455736 Yes No
Abnormal VTA/SN subgroup
0.544226 Yes No
0.546144 No No
0.54869 Yes No
0.602679 Yes Yes
0.603839 No No
0.612006 Yes No
0.646446 Yes Yes
0.658727 Yes Yes
0.67705 No No
0.745329 Yes No
the abnormalities in these patients (i.e. the ‘‘signal’’) was presumed to be much greater in Parkinson’s patients, making it less susceptible to being masked by imprecision in registration of small nuclei by automated methods (i.e. ‘‘noise’’). Thus, in a disorder where we expect more subtle abnormalities in this region (e.g., MDD), we believe the directed registration methods were required to resolve the signal above the noise.
a. Automated registration. The initial image registration was done using FSL software to perform an automated, 12-degrees of freedom, global affine transformation[67]. The linear affine transformation (in combination with a subsequent landmark-guided manual registration) was selected over non-linear transform methods to minimize loss of signal due to warping, which is relatively greater in the small subcortical regions [68] relevant to oura priorihypotheses.
b. Manual registration. After the automated registration, all registered images were put through an additional manual registration step using Martinos Center Freesurfer software (http://surfer.nmr.mgh.harvard.edu). This step maximized the accuracy of registration of each subject’s FA map to ICBM152 T2 space, based on three registration landmarks selected to maximize registration in oura priori areas of evaluation (AOEs) (see Text S1). Figures S1, S2, S3, S4 illustrate anatomical co-localization across MDD and control cohorts overall, and within our primary AOEs.
Data Analysis
1. A priori hypotheses and segmentation of a priori areas of evaluation (AOEs). Primary and secondary a priori hypotheses corresponded to a priori AOEs for constraining our voxel-based search of patient/control differences. These AOEs constrained which voxels were evaluated in FA map group contrasts, to identify clusters meeting volume and significance thresholds. AOEs were segmented by an anatomist (N.M.) using landmark-based, atlas-guided definitions of the regions (see Text S1 and Figures S1, S2, S3, S4, S5, S6, S7).
a. Primary a priori hypothesis. We predicted MDD subjects would exhibit abnormal brain microstructure in (1) the medial forebrain bundle (MFB) and contiguous lateral nucleus of the hypothalamus (LNH), along with (2) regions feeding the MFB/LNH, including the ventral tegmental area/substantia nigra (VTA/SN), and (3) the amygdalofugal pathway. Follow-up analyses (described below), considered clusters falling within these regions.
b. Secondary a priori hypotheses. Based on imaging findings in the MDD literature, we further hypothesized that MDD subjects would exhibit abnormal brain microstructure in white matter adjacent to orbitofrontal cortex (FOC), anterior cingulate cortex (ACC), paracingulate cortex (PAC), subgenual prefrontal cortex (SGC), and dorsolateral prefrontal cortex (DLPFC).
c. Brain regions outside a priori hypothesized AOEs. We evaluated all other brain regions outside primary and secondarya prioriAOEs using a whole-brain Bonferroni correction.
2. Voxel-based contrast of FA maps for MDD subjects versus control subjects. a. Contrast analysis. A voxel-based contrast analysis was performed between MDD and control subjects, using a two-tailed t-test with Freediffusion software [63,69]. To minimize the chance of false positives we required (1) that group differences meet a cluster threshold and (2) that the p value of the peak voxel within each cluster meet a correction for the number of voxels in a search volume.
b. Cluster thresholds for group contrast of FA maps. For primarya priori AOEs, the cluster threshold was at least 9 contiguous voxels, with p,0.05 for each voxel. This was increased to 27 contiguous voxels for secondarya prioriAOEs, and 81 contiguous voxels for regions outsidea prioriAOEs. The least stringent threshold exceeded cluster
thresholds used with fMRI [30,70] and cortical thickness analy-sis[71]. We defined contiguous voxels as voxels sharing an edge (i.e., not just a corner). To be considered within that AOE, greater than 50% of voxels in a cluster had to fall within a segmenteda priori AOE.
c. Multiple comparisons correction for group contrast of FA maps. To be considered statistically significant, clusters were required to have a peak voxel meeting a Bonferroni correction for multiple comparisons. Corrections were based on the total number of voxels in the area being considered (418 for primarya prioriAOEs; 9,308 for secondarya priori AOEs; 200,000 for the whole brain [i.e., nota priori]), divided by the required cluster size. Thus, the uncorrected p value (reported in Tables 2, 3, 4) was required to be p,0.05/(418/9), or p,0.00108, for primary a priori AOEs, p,0.05/(9,308/27), or p,1.4561024
, for secondary a priori AOEs, and p,0.05/(200,000/81), or 2.0361025
, for the rest of the brain. Peak voxels within an order of magnitude of the corrected p value were considered trends toward significance. All regions that met cluster threshold criteria were tabulated; however, the results and discussion sections focus primarily on regions which met full significance criteria.
d. Permutation test as validation of our findings. As a supplemental test to further validate the robustness of findings, we computed a permutation test for regions meeting the cluster threshold. Methods and results for this analysis are reported in Tables S1, S2, S3, S4, S5, S6 in Dataset S1.
e. Laterality test. Given initial findings in the VTA/SN region were lateralized to the right hemisphere in MDD subjects, we assessed laterality of FA in this region for both groups to distinguish between potential presence of lateralized effects in patients, versus potential loss of laterality relative to controls (see Dataset S2).
3. Follow-up analyses. Follow-up analyses were conducted to assess MDD group heterogeneity, and the relationship between FA and symptom profiles for MDD subjects.
a. Individual subject FA values. Once clusters representing group differences were identified in primarya prioriAOEs, we measured mean FA across each cluster for each subject (see Figures S5, S6 for illustrations of these clusters). Mean FA values for individuals were then used in follow-up analyses. To evaluate whether MDD cohort heterogeneity led to false negatives, we included findings which met the cluster, but not the Bonferroni threshold in the initial voxel-based contrast.
d. VTA/SN FA and symptom measures. We evaluated whether symptom profiles differed across the two MDD subgroups. Specifically, we looked at (1) overall depression severity (total score on IDS-SR), and scores on individual IDS-SR items relating to (2) anhedonia (question 21), (3) sadness (question 5), and (4) psychomo-tor symptoms (question 30). Although MDD subjects in our cohort
had not been clinically subtyped, anxious depression is one of the most common clinical subtypes of MDD [57,73]; therefore we also evaluated measures of (5) trait anxiety (via the STAI-T). We used two-tailed t-tests to evaluate whether these measures differed between MDD subgroups. Significance was determined using a Bonferroni correction of p,0.05/5 = 0.01 for these analyses.
Table 3.Post-Hoc Contrast for ‘‘Abnormal VTA/SN’’ MDD Subgroup (10 MDD Versus 10 Matched Controls).
Region
MNI coordinates at peak
difference t (p) values at peak difference Cluster size (#voxels)
FA group differences which met the 9-voxel cluster requirement in the primarya prioriareas of evaluation (AOEs)
R. VTA/SN 11.4221.1211.9 6.62 (0.0000032)* 49
L. VTA/SN 25.7219.2217.2 3.90 (0.00106)* 13
FA group differences which met the 27-voxel cluster requirement in the secondarya prioriAOEs
L. DLPFC wm (superior fr. gyrus) 215 26.9 32.8 23.31 (0.00394) 50
L. DLPFC wm (middle fr. gyrus) 237.7 27.5 27.7 23.82 (0.00127) 33
FA group differences which met the 81-voxel cluster requirement in other regions
R. FOC (olf sulcus) gm 9.5 17.9215.4 4.96 (0.000102) 95
R. SGC gm 7.6 10.725.8 4.63 (0.000210) 118
R. PMC wm (SLF3) 53 9.2 15.2 25.95 (0.000012)* 106
MDM/PAG region 0224.627.2 4.26 (0.000471) 78 (just below
significance)
Positive t values indicate FA values were elevated in MDD subjects relative to control subjects; negative t values indicate FA values were reduced in MDD subjects relative to control subjects. p values are reported uncorrected; symbols indicate significance and trends at the corrected threshold.
*p value met the corrected threshold.
{p value was within an order of magnitude of the corrected threshold (a trend).
Abbreviations: R: right hemisphere; L: left hemisphere; wm: white matter; gm: gray matter; VTA/SN: ventral tegmental area/substantia nigra; DLPFC: dorsolateral prefrontal cortex; FOC: orbitofrontal cortex; SGC: subgenual cortex; PMC: premotor cortex; CCtx: calcarine cortex; MDM/PAG: medial dorsal midbrain/periaqueductal gray. doi:10.1371/journal.pone.0013945.t003
Table 2.Voxel-Based Contrast for the Whole Cohort (22 MDD Versus 22 Matched Controls).
Region
MNI coordinates at peak
difference t (p) values at peak difference
Cluster size (#voxels)
FA group differences which met the 9-voxel cluster requirement in the primarya prioriareas of evaluation (AOEs)
R. VTA/SN 11.5219.2213.6 3.56 (0.000929)* 17
L. MFB/LNH 29.523.9211.8 23.20 (0.00264){ 9
FA group differences which met the 27-voxel cluster requirement in the secondarya prioriAOEs
R. ACC wm 19.2 32.724.7 23.79 (0.000472){ 35
R. DLPFC wm (superior fr. gyrus) 18.3 26.5 49.5 24.00 (0.000252){ 27
L. DLPFC wm (superior fr. gyrus) 213.3 23.1 44.1 24.01 (0.000245){ 55
L. DLPFC wm (middle fr. gyrus) 238.6 26.0 31.5 23.20 (0.00262) 40
L ACC/PAC wm 29.5 38.5 17.0 23.49 (0.00113) 33
FA group differences which met the 81-voxel cluster requirement in other regions
L. PMC wm (SLF3) 243.9 0.0 18.9 24.50 (0.000052){ 81
R. PMC wm (SLF3) 45.5 0.0 17.0 24.15 (0.000160) 134
L./midline CC 24.7 5.3 22.5 23.56 (0.000937) 98
R. CCtx wm 30.6257.5 2.6 5.54(0.0000018)* 83
L. CCtx wm 221.0260.1 2.7 4.29 (0.000102) 99
Positive t values indicate FA values were elevated in MDD subjects relative to control subjects; negative t values indicate FA values were reduced in MDD subjects relative to control subjects. p values are reported uncorrected; symbols indicate significance and trends at the corrected threshold.
*p value met the corrected threshold.
{p value was within an order of magnitude of the corrected threshold (a trend).
Abbreviations: R: right hemisphere; L: left hemisphere; wm: white matter; gm: gray matter; VTA/SN: ventral tegmental area/substantia nigra; MFB: medial forebrain bundle; LNH: lateral nucleus of the hypothalamus; ACC anterior cingulate cortex; DLPFC: dorsolateral prefrontal cortex; PAC: paracingulate cortex; PMC: premotor cortex; CC: corpus callosum; CCtx: calcarine cortex.
Results
1. Image Contrast Analysis of MDD Versus Control Subjects
a. Primary a priori areas of evaluation (AOEs) (Table 2; Figure 1). Significantly elevated FA was detected in MDD subjects within the VTA/SN. Specifically, FA was elevated at the ventral/lateral edge of the right SN adjacent to the cerebral peduncle and overlying the nigral fiber system (striatonigral, nigrostriatal, and corticostriatal fibers; Figure 1). A trend toward reduced FA in MDD subjects was also noted in the left MFB where it passes through the LNH. There were no group differences for the amygdalofugal AOE. Mean FA values for each cluster detected in the voxel-based contrast are reported in Table S2.
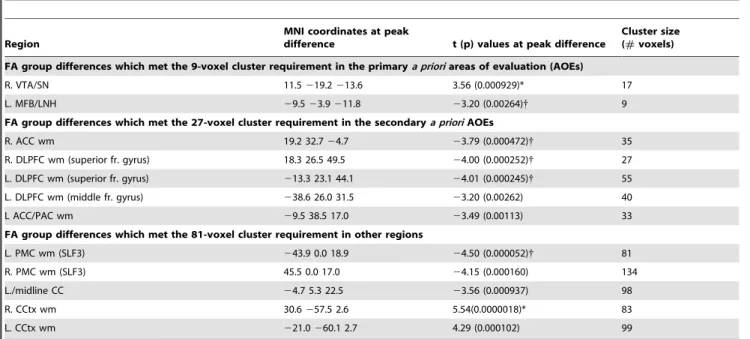
b. Secondary a priori AOEs (Table 2; Figure 2). There were trends toward significantly reduced FA in two white matter regions underlying DLPFC (Figure 2), and in white matter adjacent to the right ACC.
c. Other regions meeting the cluster threshold (Table 2; Figure 3). Outside a priori AOEs, MDD subjects exhibited significantly elevated FA in white matter adjacent to right calcarine cortex (Figure 3B), and a trend toward significantly reduced FA in white matter within the left precentral gyrus, below premotor cortex (BA6) (Figure 3A).
2. Follow-up Analyses: Gapping, Subgroup Subtractions, Symptom Correlations
a. Gapping analysis. A gap in the distribution of mean FA values across MDD subjects was observed for the VTA/SN cluster (Figure 4A). This gap was located at the upper limit of control values; all MDD subjects with values above the gap were outside the range of control values. Gapping analysis indicated it was unlikely that this gap in the MDD VTA/SN FA values would have been observed by chance if this were a homogeneous population (p = 0.001 with a Gaussian distribution; p = 0.005 for a t distribution, df = 4). Ten MDD subjects fell above the gap (‘‘abnormal VTA/SN’’ subgroup), and 12 fell below it (‘‘normal VTA/SN’’ subgroup). There were no statistically significant gaps across MDD subjects for the MFB/LNH cluster.
b. Voxel-based contrasts of FA maps for the two MDD subgroups. MDD subgroups exhibited two non-overlapping sets of brain microstructural abnormalities when contrasts were conducted separately (Figures 4, 5, 6).
(1) Abnormal VTA/SN MDD subgroup versus matched control subjects (Table 3, Figures 4, 5). For MDD subjects with FA values above the
gap, a VTA/SN cluster in the right hemisphere covered a significant proportion of the SN and its peak was centered within the SN (Figure 4B). Voxels in this cluster extended into the lateral VTA. There was also a cluster of significantly elevated FA in the left hemisphere VTA/SN (Figure 4B). This subgroup exhibited significantly reduced FA in white matter underlying right premotor cortex (Figure 5). Mean FA values for clusters are reported in Table S4. This subgroup did not exhibit FA abnormalities within the MFB/LNH a priori AOE (Figure 4C), or within ACC white matter.
(2) Normal VTA/SN MDD subgroup versus matched control subjects (Table 4; Figures 4, 6). The MDD subgroup with VTA/SN FA values below the gap, exhibited a trend toward reduced FA in the left MFB/LNH (Figure 4C), and a trend toward reduced FA in white matter adjacent to right ACC (Figure 6). Mean FA values within clusters are reported in Table S6. This subgroup did not exhibit FA abnormalities within the VTA/SN a priori AOE (Figure 4B) or premotor white matter.
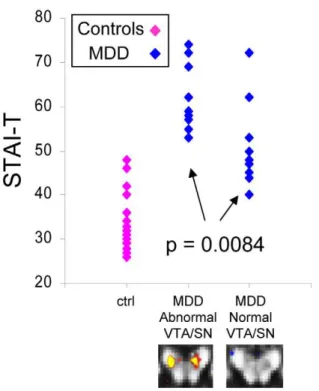
c. Symptom measures in abnormal versus normal VTA/SN MDD subgroups. Total IDS-SR scores, and scores for items relating to anhedonia, sadness, and psychomotor symptoms did not differ between the normal and abnormal VTA/SN subgroups (Table 5). In contrast, trait anxiety scores (STAI-T) were significantly different between abnormal and normal VTA/SN MDD subgroups [t(2,19) = 2.96, p = 0.0084, normal VTA/SN mean = 51.2768.96, abnormal VTA/SN mean = 61.8067.32; Figure 7].
Discussion
In this study, MDD subjects exhibited brain microstructural differences in subcortical reward/aversion regions, specifically the VTA/SN, compared to control subjects. Individual FA values in the VTA/SN divided the MDD cohort into subgroups with distinct profiles of microstructural abnormalities and different levels of trait anxiety, but no difference in other clinical symptoms of MDD. This subtyping supports a hypothesis that etiology and symptoms of MDD may not match one-to-one, although distinguishing clinical factors may be associated with a given etiology.
Evidence That MDD Is Characterized By Reward/Aversion Circuitry Abnormalities
FA abnormalities in the VTA/SN region. In the initial voxel-based contrast, FA was elevated in MDD subjects at the border of the SN and cerebral peduncle in a region that, according to anatomic atlases, contains nigrostriatal projection fibers.
Table 4.Post-Hoc Contrast for ‘‘Normal VTA/SN’’ MDD Subgroup (12 MDD Versus 12 Matched Controls).
Region
MNI coordinates at peak
difference t (p) values at peak difference Cluster size (#voxels)
FA group differences which met the 9-voxel cluster requirement in the primarya prioriareas of evaluation (AOEs)
L. MFB/LNH 211.323.329.8 23.19 (0.00425){ 20
FA group differences which met the 27-voxel cluster requirement in the secondarya prioriAOEs
R. ACC wm 15.2 31.623.2 23.83 (0.000913){ 31
L ACC/PAC wm 29.4 38 13.8 23.56 (0.00175) 46
Positive t values indicate FA values were elevated in MDD subjects relative to control subjects; negative t values indicate FA values were reduced in MDD subjects relative to control subjects. p values are reported uncorrected; symbols indicate significance and trends at the corrected threshold.
*p value met the corrected threshold.
{p value was within an order of magnitude of the corrected threshold (a trend).
Abbreviations: R: right hemisphere; L: left hemisphere; wm: white matter; MFB: medial forebrain bundle; LNH: lateral nucleus of the hypothalamus; ACC anterior cingulate cortex; PAC: paracingulate cortex.
Because the initial contrast included a number of patients who did not exhibit the abnormality in the VTA/SN, we viewed the voxel-based contrast for the MDD subgroup with abnormal VTA/SN FA as a better reflection of the location and extent of this abnormality. This follow-up analysis revealed a patient/control difference peak centered within the SN, which covered a significant proportion of the SN and extended into the lateral VTA in both hemispheres, suggesting the VTA/SN finding was not a localized effect specific to the nigrostriatal fibers, and that the effect was seen in the nucleus, rather than the adjacent white matter.
Etiological considerations for increased FA in the VTA/ SN. The goal of the current study was to identify regions in which brain microstructure was different in MDD, independent of specific etiology, which can be associated with other known structural abnormalities, clinical or behavioral features in a population. Although DTI evaluates water diffusion properties and therefore can be influenced by many potential etiologies, there are certain etiologies commonly associated with abnormalities in white matter, and emerging evidence for abnormalities underlying FA changes in mixed gray/white matter regions; these can be considered here in relation to generating new hypotheses to test in MDD. Specifically, white matter FA is influenced by the integrity of axons and myelin, as well as directional coherence of axons [74], with reduced FA suggesting either a loss of axonal integrity or coherence. Although the basis for altered FA in gray matter regions has not been as well studied, a number of potential alterations in cell or axonal composition within these regions may alter water diffusion properties; this includes reduced cell density and/or cell loss, altered cell structure, or altered integrity or orientation of the cells or axons projecting out of the region.
Altered FA has been previously shown in brainstem nuclei in the presence of known neuronal loss, including altered FA in the SN in Parkinson’s Disease [e.g. [65,66]], confirming the potential for FA to detect pathology-relevant changes in the VTA/SN region.
While neuronal loss, as occurs in Parkinson’s Disease, would be expected to lead to reduced FA [65,66], a reduction in glial density could potentially lead to elevated FA due to an increase in the ratio of axons to cell bodies. Evidence for such an effect is seen in a recent study in a mouse model of Pelizaeus-Merzbacher disease (PMD), in which there is transient astrocytic hypertrophy in females. Hypertrophy in these animals was associated with reduced FA, while FA subsequently increased upon the reversal of hypertrophy [75]; i.e. when glial density decreased, FA increased. Elevated FA in a mixed gray/white matter region has also been directly demonstrated in association with induction of a disease process. A recent study showed that an animal model of febrile seizures exhibited elevated FA in the hippocampus following seizure induction [76]. In humans, such seizures promote hyperexcitability of the limbic system and are accompa-nied by structural and metabolic abnormalities of the limbic system.
Given that reduced glial density has been demonstrated in MDD in the SGC [77] along with imaging abnormalities in this and other prefrontal gray matter regions in MDD, [34,78,79], we suggest that future studies can test the hypothesis that there may Figure 1. FA difference in MDD subjects in primary a priori
areas of evaluation.This figure shows the significant FA difference in MDD subjects versus matched healthy controls for the voxel-based contrast (all subjects: 22 MDD, 22 controls) within areas of evaluation (AOEs) included in our primary a priori hypotheses. MDD subjects exhibited elevated FA in the ventral tegmental area/substantia nigra (VTA/SN), which localized to the ventral/lateral edge of the substantia nigra (SN) adjacent to the cerebral peduncle, and the nigral fiber system (striatonigral, nigrostriatal, and corticostriatal fibers). Translucent green in image on left indicates thea prioriAOE for the VTA/SN in the slice shown, which was used to constrain the initial contrast analysis. The color bar indicates the range of p values in this figure, from the threshold (p,0.05) to the order of magnitude of the voxel of peak significance (i.e. smallest p value) in the VTA/SN; color in images is viewed using trilinear interpolation. Warm tones (red, orange, yellow) indicate regions in which MDD subjects exhibited elevated FA relative to control subjects. RH: right hemisphere; LH: left hemisphere. doi:10.1371/journal.pone.0013945.g001
Figure 2. FA differences in MDD subjects in secondarya priori
areas of evaluation.This figure shows the significant FA differences in MDD subjects versus matched healthy controls for the voxel-based contrast (all subjects: 22 MDD, 22 controls) in a priori regions of evaluation (AOEs) included in our secondarya priorihypotheses. MDD subjects exhibited reduced FA in white matter regions underlying dorsolateral prefrontal cortex (DLPFCwm), bilaterally. Translucent green in images on left indicates thea prioriAOE for DLPFCwm in the slices shown, which were used to constrain the initial contrast analysis. The color bar indicates the range of p values in this figure, from the threshold (p,0.05) to the order of magnitude of the voxel of peak significance (i.e. smallest p value) in DLPFCwm; color in images is viewed using trilinear interpolation. Cool tones (blues) indicate regions in which MDD subjects exhibited reduced FA relative to control subjects. RH: right hemisphere; LH: left hemisphere.
also be reduced glial density in the VTA/SN in conjunction with the FA abnormality observed here. Since glia are thought to be critical in synapse formation and synaptic plasticity [80,81], reduced density and/or loss of glia would have a critical impact on information processing in the reward/aversion circuitry. An alternate possibility is that cell morphology is altered in MDD subjects. Russo and colleagues have shown that chronic drug use leads to a reduction in neuronal size in the VTA in an animal model of chronic opiate addiction [82]. This size reduction was accompanied by a reduction in the rewarding effects of morphine. In MDD, analogous factors, such as chronic stress, might have a similar effect on neurons in this region.
Functional implications of the VTA/SN abnormality for MDD and reward/aversion processing. Within the VTA/ SN region, the VTA predominantly processes reward/aversion information [18,27], while the SN processes both reward/aversion and motor information [83]. The SN is thought to participate in modulating reward prediction and expectancy [84], as well as prediction of aversive and negatively valenced stimuli [18]. In addition, medial portions of the SN project to and receive projections back from the ventral striatum [30,70], which processes reward/aversion information [21], while more lateral portions project to the dorsal striatum, which processes motor information [83]. These regions appear to be interconnected in an ascending spiral so that information relating to reward/aversion and motor function is likely mixed in this circuitry [83]. Other efferents of the SN include GABAergic nigro-collicular pathways which have been shown to mediate fear/defense reactions [85].
Taken together, the literature above suggests a hypothesis that altered systems for reward/aversion prediction might lead to an alteration in the capacity of some MDD subjects to assess realistic likelihoods of aversive events [86]. Such individuals, as a consequence, would be likely to show impaired expectancies around negative events and compensate by maintaining higher levels of vigilance/arousal for bad outcomes, which would be
clinically observed in the form of higher anxiety [87,88]. The observation of significantly higher levels of trait anxiety in the abnormal VTA/SN MDD subgroups supports such a hypothesis. Given that the SN and VTA each project to the ventral striatum [89], our findings are also consistent with reports of altered nucleus accumbens function in MDD [2,32], supporting earlier hypotheses of such an effect [1].
FA abnormalities in premotor cortex. Independent of a prioriregions, MDD subjects exhibited a trend toward reduced FA in white matter underlying premotor cortex in the cohort as a whole, which was significant in the abnormal VTA/SN group. Since a number of tracts run through this region, we cannot be certain that this finding reflects an abnormality in motor fibers. Nevertheless, this finding is of interest in conjunction with the FA abnormality in the SN, given these regions are each key components of motor circuitry, and some MDD subjects in our cohort exhibited psychomotor symptoms.
Evidence For Subtyping of the MDD Cohort Based on DTI Measures and Relationship to Depressive Symptoms
There are three findings arguing that subjects with normal versus abnormal VTA/SN FA fell into two biologically relevant subtypes. The first is the observed gap in the middle of the distribution of FA values for MDD subjects, which coincided with the cut-off for control values. The second is that there was no overlap in regional localization of FA abnormalities for the two subgroups when evaluated separately. The third is the difference in trait anxiety between groups, with higher mean trait anxiety in the abnormal VTA/SN subgroup. The evidence here for MDD subtyping based on features of the VTA/SN resonates with a recent finding of differences in midbrain resting metabolism between groups of patients whose depressive symptoms did versus did not remit in response to antidepressants [31]. Although Milak and colleagues [31] did not test whether there was a division on an Figure 3. FA differences in MDD subjects in regions not in our a priori areas of evaluation.This figure shows the significant FA differences in MDD subjects versus matched healthy controls for the voxel-based contrast (all subjects: 22 MDD, 22 controls) in regions not included in oura priorihypotheses. MDD subjects exhibited (A) reduced FA in white matter adjacent to right premotor cortex (PMCwm), and (B) elevated FA in white matter adjacent to right calcarine cortex (CCtx). The color bar indicates the range of p values in this figure, from the threshold (p,0.05) to the order of magnitude of the voxel of peak significance (i.e. smallest p value) in PMCwm for reduced FA and from the threshold (p,0.05) to the order of magnitude of the voxel of peak significance in CCtx white matter for elevated FA, color in images is viewed using trilinear interpolation. Warm tones (red, orange, yellow) indicate regions in which MDD subjects exhibited elevated FA relative to control subjects; cool tones (blues) indicate regions in which MDD subjects exhibited reduced FA relative to control subjects. RH: right hemisphere; LH: left hemisphere.
individual basis, their findings suggest the possibility that the mictrostructural subgroups in the current study may also predict treatment responsiveness and could be tested as a potential diagnostic/prognostic biomarker. Future studies will be necessary to evaluate the relationship between altered microstructure and treatment responsiveness.
In contrast, no significant differences in two core symptoms of depression (anhedonia and sadness) or overall depression severity were observed between the two MDD subgroups. While this could potentially reflect a power issue, it is also possible that the neural subgroups observed here are an example of how the same illness can arise when related components of the reward/aversion
circuitry are ‘‘hit’’ in different places. These data support the idea that it may be the functional system (i.e. reward/aversion) hit, and not the specific etiology of that hit, that determines whether an individual develops MDD [1,48,90]. There is, however, potential for vast differences in a subset of clinical symptoms, such as anxiety, and in treatment responsiveness across different biological etiologies.
The higher trait anxiety levels in the abnormal VTA/SN subgroup are consistent with research connecting the VTA/SN to expectancy processing [84], and connects with the idea that abnormal anxiety may reflect altered expectancy [86,88]. Elevated trait anxiety in this subgroup is also consistent with findings by Figure 4. Subgrouping of MDD cohort based on individual FA values.This figure shows the subgrouping of the MDD cohort based on individual FA values, and double dissociation of VTA/SN and MFB abnormalities across these two subgroups. (A) Scatterplots of FA values from the VTA/SN cluster from MDD subjects (blue) and control subjects (pink). There was a statistically significant gap in the middle of the VTA/SN values for MDD subjects; the values above this gap were all outside the range of control values. When contrasts were calculated separately for MDD subjects in the abnormal VTA/SN (10 MDD and 10 controls) versus the normal VTA/SN (12 MDD and 12 controls) MDD subgroups, (B) abnormal VTA/SN MDD subjects exhibited significantly elevated FA bilaterally in the ventral tegmental area/substantia nigra (VTA/SN), localized to both the SN and the VTA and a trend toward significance in this region in the left hemisphere, while (C) MDD subjects in the normal VTA/SN subgroup did not exhibit any significant FA differences in this region. In contrast, (B) abnormal VTA/SN MDD subjects did not exhibit any significant FA differences overlying the medial forebrain bundle/lateral nucleus of the hypothalamus (MFB/LNH), while (C) normal VTA/SN MDD subjects exhibited a trend toward significant reduction in FA values in this region. Translucent green in images on left indicatesa prioriAOEs for the (B) VTA/SN and (C) MFB/LNH in the slices shown, which were used to constrain the initial contrast analysis. The color bar indicates the range of p values in this figure, from the threshold (p,0.05) to the order of magnitude of the voxel of peak significance (i.e. smallest p value) in the VTA/SN for elevated FA and from the threshold (p,0.05) to the order of magnitude of the voxel of peak significance in the MFB for reduced FA, color in images is viewed using trilinear interpolation. Warm tones (red, orange, yellow) indicate regions in which MDD subjects exhibited elevated FA relative to control subjects; cool tones (blues) indicate regions in which MDD subjects exhibited reduced FA relative to control subjects. RH: right hemisphere; LH: left hemisphere.
Berton & colleagues[25] of VTA abnormalities in an animal model of MDD induced by chronic stress. Clinically, our findings in the VTA/SN support hypotheses regarding involvement of the midbrain dopamine reward circuitry in MDD [7], and support investigation of interventions based thereon [91].
Limitations of the Interpretation of Our Findings
Several factors inherent to patient imaging studies must be considered for interpretation of findings such as ours. These include the cohort size in relation to subgrouping, the balance between strengths and weaknesses of our selection of registration methods, the issue of whether microstructural abnormalities are primary or secondary to MDD, and medication status of patients. These factors are discussed below.
Cohort size, subgrouping, and thresholding. Our search for heterogeneity within the MDD cohort was primarily for the purpose of showing potential reasons previous DTI studies may have exhibited false negatives in subcortical regions. The potential clinical relevance of the subgroups identified is of great interest; however, we emphasize that these findings are preliminary and need to be replicated in larger cohorts. It is also possible that either the cohort size of the subgroups or our conservative thresholds led to false negatives in the current study, particularly in regions that reached the level of a trend (e.g. the MFB). The current study Figure 5. FA difference in the abnormal VTA/SN MDD
subgroup in premotor cortex.This figure shows the significant FA difference in MDD subjects versus matched healthy controls for the voxel-based contrast in the abnormal VTA/SN MDD subgroup for AOEs included in our secondary a priori hypotheses (10 MDD and 10 controls). In addition to elevated FA in the VTA/SN (Figure 4B), MDD subjects in the abnormal VTA/SN subgroup exhibited significantly reduced FA in white matter adjacent to right premotor cortex (PMCwm). The color bar indicates the range of p values in this figure, from the threshold (p,0.05) to the order of magnitude of the voxel of peak significance (i.e. smallest p value) in PMCwm; color in images is viewed using trilinear interpolation. Cool tones (blues) indicate regions in which MDD subjects exhibited reduced FA relative to control subjects. RH: right hemisphere; LH: left hemisphere.
doi:10.1371/journal.pone.0013945.g005
Figure 6. FA difference in the normal VTA/SN MDD subgroup in secondarya prioriareas of evaluation.This figure shows the FA difference in MDD subjects versus matched healthy controls for the voxel-based contrast in the normal VTA/SN MDD subgroup for AOEs included in our secondary a priori hypotheses (12 MMD and 12 controls). In addition to the trend toward reduced FA in the MFB (Figure 4C), MDD subjects in the normal VTA/SN subgroup also exhibited a trend toward reduced FA in white matter adjacent to the right anterior cingulate (ACCwm). Translucent green in image on left indicates thea prioriAOE for ACCwm in the slices shown, which were used to constrain the initial contrast analysis. The color bar indicates the range of p values in this figure, from the threshold (p,0.05) to the order of magnitude of the voxel of peak significance (i.e. smallest p value) in ACCwm; color in images is viewed using trilinear interpolation. Cool tones (blues) indicate regions in which MDD subjects exhibited reduced FA relative to control subjects. RH: right hemisphere; LH: left hemisphere.
doi:10.1371/journal.pone.0013945.g006
Figure 7. STAI-T (trait anxiety) scores differed between abnormal and normal VTA/SN MDD subgroups. This figure shows the STAI-T scores for MDD subgroups and for control subjects (n = 10 abnormal VTA/SN MDD; n = 11 normal VTA/SN MDD; n = 19 controls). These scores exhibited a similar distribution to VTA/SN FA values (Figure 4A) across MDD subgroups and controls: Scores for MDD subjects in the abnormal VTA/SN subgroup (left column of blue data points) did not overlap with control subject scores (pink data points), whereas the range of scores for subjects in the normal VTA/SN subgroup (right column of blue data points) overlapped with control scores; scores showed a statistically significant difference between MDD subgroups. The control subject score range also extended below the range for MDD subjects in the normal VTA/SN subgroup, as it did for control VTA/SN FA values.
provides justification for future large-scale studies to verify the reproducibility of our findings. Such studies can be conducted using, not only DTI, but also complementary techniques such as post-mortem histological evaluation, which require directed hypotheses such as those generated here.
Registration Methods. Because our hypotheses focused on specific components of subcortical reward circuitry, we used registration methods which would maximize precise registration of these regions. It is therefore important to emphasize that alternative registration methods might have more accurately or reliably detected abnormalities in cortical white matter regions in MDD subjects. We did, however, focus some of our manual registration points on ventral and medial prefrontal cortical regions to maximize the likelihood that the SGC, FOC, and ACC regions included in our secondarya priorihypotheses would be well registered.
Spatial resolution of our a priori regions. Small subcortical nuclei and small white matter fiber tracts inherently have lower effective spatial resolution than cortical regions, and this is a limitation particularly when using the spatial resolution of standard DTI sequences (2 mm). In the current study we aimed to optimize the signal at this spatial resolution by using directed registration methods to maximize alignment in oura prioriregions. We also note in our Methods that previous studies have successfully detected abnormalities in the VTA/SN region when gross pathology was present [65,66], suggesting that detection of biological abnormalities in this region should be feasible.
Potential confounds of cardiorespiratory movement.
Because the brainstem is particularly susceptible to motion artifact from arterial or respiratory pulsation [92], it cannot be ruled out that such movements influenced our data. However, in the case of DTI, image acquisition is integrated over a significant period of time (,10 minutes), and is therefore less susceptible than functional MRI (fMRI) to the effects of such artifacts leading to individual differences. Unless patients exhibited different cardiorespiratory features than controls (or patients differed across subgroups), differences in cardiorespiratory function would be expected to average out, or in the worst case lead to increased variance of the signal in one cohort, reducing the likelihood of a statistically significant finding. Furthermore, all subjects in this study were thoroughly assessed by review of systems and physical exam by a physician, from which no such physical differences were discerned across groups or subgroups.
Are microstructural abnormalities primary or secondary to MDD?. We cannot be certain whether the observed microstructural abnormalities in our MDD subjects were the cause or the result (or both) of the illness or its symptoms. Future studies in larger cohorts and with repeated measures will be necessary to further assess the primacy of abnormalities observed in our study. Such studies will also be needed to evaluate the effects of other factors secondary to MDD, such as tobacco use. Since only three of the 22 MDD subjects in this cohort were current or
previous smokers, it is unlikely that our results reflect FA abnormalities secondary to tobacco use. Specifically, this supports the idea that the VTA/SN abnormality could be observed in the absence of tobacco use. Conversely, the control subject who smoked (and had done so for 37 years) exhibited the second lowest VTA/SN FA value (0.24) in the control cohort, indicating that smoking is not sufficient to produce the VTA/SN FA abnormality.
Medication status of MDD subjects and DTI findings. Because animal literature in depression [93,94] and more recently human literature in movement disorders [95] suggests that treatment of symptoms of a disorder may influence brain microstructure, it is important to consider whether some of the observations in our study might have been brought about by medication.
Three factors argue that our main findings were not affected by medication status, although future studies will be required to prospectively evaluate whether antidepressants affect brain microstructure as detected by DTI. First, because our patient population was drawn partially from recently diagnosed (i.e. untreated) patients or patients who did not respond to antidepres-sant medications in the past; the cohort here included a number of patients who had either never taken or were not currently taking antidepressants (Table 1). Second, similar proportions of patients in the normal and abnormal VTA/SN subgroups were on medications (3/10 in the abnormal VTA/SN subgroup; 4/12 in the normal VTA/SN subgroup) at the time of scanning. Third, individual data points indicate there were subjects in each of the two MDD subgroups who had never taken antidepressants so it is unlikely that the MDD DTI subgrouping, which was based on individual rather than group measures, was an effect of medication or medication differences between subgroups.
Conclusion
In this study, MDD subjects exhibited brain microstructural abnormalities in the ventral tegmentum, a primary component of the subcortical reward/aversion circuitry. These abnormalities subdivided the cohort into two subgroups which exhibited similar core depressive symptoms, but differences in trait anxiety. These findings add direct support to the hypothesis that alterations in brain reward/aversion circuitry play a role in the etiology of MDD [1].
Supporting Information
Text S1 Registration and AOE segmentation methods. De-scribes the anatomical landmarks used in the manual registration step for FA maps, and the procedures used to segment our a priori areas of evaluation (AOEs).
Found at: doi:10.1371/journal.pone.0013945.s001 (0.05 MB DOC)
Table 5.MDD Symptom Measures in Abnormal Versus Normal VTA/SN MDD Subgroups.
Symptom
Mean
Abnormal VTA/SN subgroup
Mean
Normal VTA/SN subgroup t teststatistics
Depression severity (IDS-SR) 38.00610.58 3468.68 t(2,16) = 1.24, p = 0.23
Anhedonia 1.3860.52 1.2560.97 t(2,18) = 0.38, p = 0.71
Sadness 2.4460.53 1.8361.03 t(2,19) = 1.77, p = 0.095
Psychomotor symptoms 1.2560.89 1.0061.04 t(2,18) = 0.58, p = 0.57
Trait anxiety 61.8067.32 51.2768.96 t(2,19) = 2.96, p = 0.0084
Figure S1 Registration comparison across groups. Examples of (A) coronal and (B) axial slices through average FA maps for control subjects (left column) and MDD subjects (right column) show that registration accuracy of images used in group contrasts was similar between groups and, to illustrate the visibility of anatomy on these images. Coronal images are at y = -18.3 and axial images at z = 3.5 in MNI Talairach coordinates. RH: right hemisphere; LH: left hemisphere.
Found at: doi:10.1371/journal.pone.0013945.s002 (0.91 MB TIF)
Figure S2 Ventral tegmentum area of evaluation (AOE). This figure shows the primary a priori AOE in the VTA/SN. A priori AOEs were segmented on the average control FA map and then used to constrain the voxels considered in the initial contrast analysis for MDD versus control cohorts. The image on the left in (A) illustrates the visibility of regions and landmarks used for segmentation of the VTA/SN and the three images to the right depict the AOE in translucent green from (left to right) an axial view (the primary orientation in which segmentation was done), a coronal view, and a sagittal view. In (B) the AOE is superimposed on the average MDD FA map at the same locations. RH: right hemisphere; LH: left hemisphere.
Found at: doi:10.1371/journal.pone.0013945.s003 (0.52 MB TIF)
Figure S3 Medial forebrain bundle area of evaluation (AOE). This figure shows the primary a priori AOE in the medial forebrain bundle (MFB), which also coincided with and included the lateral nucleus of the hypothalamus (LNH). A priori AOEs were segmented on the average control FA map and then used to constrain the voxels considered in the initial contrast analysis for MDD versus control cohorts. The image on the left in (A) illustrates the visibility of regions and landmarks used for segmentation of the MFB/LNH and the three images to the right depict the AOE in translucent green from (left to right) a coronal view (the primary orientation in which segmentation was done), an axial view, and a sagittal view. In (B) the AOE is superimposed on the average MDD FA map at the same locations. RH: right hemisphere; LH: left hemisphere.
Found at: doi:10.1371/journal.pone.0013945.s004 (0.65 MB TIF)
Figure S4 Amygdalofugal pathway area of evaluation (AOE). This figure shows the primary a priori AOE in the amygdalofugal pathway, which also coincided with and included the substantia inominota. A priori AOEs were segmented on the average control FA map and then used to constrain the voxels considered in the initial contrast analysis for MDD versus control cohorts. The image on the left in (A) illustrates the visibility of regions and landmarks used for segmentation of the amygdalofugal pathway/ substantia inominota and the three images to the right depict the AOE in translucent green from (left to right) a coronal view (the primary orientation in which segmentation was done), an axial view, and a sagittal view. In (B) the AOE is superimposed on the average MDD FA map at the same locations. RH: right hemisphere; LH: left hemisphere.
Found at: doi:10.1371/journal.pone.0013945.s005 (0.70 MB TIF)
Figure S5 Ventral tegmentum group difference cluster. This figure shows the cluster detected within the VTA/SN a priori AOE in the voxel-based contrast analysis of MDD versus control cohorts. This cluster was used to extract values from individual FA maps for use in the follow-up analyses (main text) and permutation test (Dataset SI). (A) Images illustrating the average control FA
map (left image), and a priori AOE segmented on that map (right image) that was used to constrain the voxel-based analysis. (B) The cluster of voxels (at right, shown on average control and MDD FA maps, respectively) that met the uncorrected p,0.05 cluster threshold on the p map of the initial MDD versus control voxel-based contrast analysis (left image) and fell within the VTA/SN AOE. Clusters were identified on p maps that had not been smoothed, and thus, p maps are illustrated here without smoothing or interpolation. RH: right hemisphere; LH: left hemisphere. Found at: doi:10.1371/journal.pone.0013945.s006 (0.46 MB TIF)
Figure S6 Medial forebrain bundle group difference cluster. This figure shows the cluster detected within the MFB/LNH a priori AOE in the voxel-based contrast analysis of MDD versus control cohorts. This cluster was used to extract values from individual FA maps for use in the follow-up analyses (main text) and permutation test (Dataset SI). (A) Images illustrating the average control FA map (left image), and a priori AOE segmented on that map (right image) that was used to constrain the voxel-based analysis. (B) The cluster of voxels (at right, shown on average control and MDD FA maps, respectively) that met the uncorrected p,0.05 cluster threshold on the p map of the initial MDD versus control voxel-based contrast analysis (left image) and fell within the MFB/ LNH AOE. Clusters were identified on p maps that had not been smoothed, and thus, p maps are illustrated here without smoothing or interpolation. RH: right hemisphere; LH: left hemisphere. Found at: doi:10.1371/journal.pone.0013945.s007 (0.51 MB TIF)
Figure S7 Examples of secondary a priori areas of evaluation (AOEs). This figure shows slices through each of the five segmentations included in our secondary a priori AOEs, including white matter adjacent to (A) dorsolateral prefrontal cortex (DLPFCwm), (B) anterior cingulate cortex (ACCwm), (C) para-cingulate cortex (PACwm), (D) orbitofrontal cortex (FOCwm), and (E) subgenual prefrontal cortex (SGCwm).
Found at: doi:10.1371/journal.pone.0013945.s008 (0.74 MB TIF)
Dataset S1 Permutation tests. Reports the methods and results of the permutation analysis conducted as a complement to the voxel-wise contrasts of FA maps.
Found at: doi:10.1371/journal.pone.0013945.s009 (0.12 MB DOC)
Dataset S2 VT abnormalities and laterality. Analysis evaluating whether right hemisphere VT abnormalities in the MDD cohort reflected a loss of normal hemispheric asymmetry in this region or a bilateral change that was simply more significant in one hemisphere than the other.
Found at: doi:10.1371/journal.pone.0013945.s010 (0.03 MB DOC)
Acknowledgments
Within the authorship list, a subset of individuals served on the PGP Publications Committee, which entailed significant management and oversight responsibilities for the project as a whole, and involvement with the development of each manuscript. These individuals were: R. Perlis (Chair of committee), J. Smoller, M. Fava, A. Blood, G. Gasic, H. Breiter. We would like to thank Mark Vangel, Ph.D. (MGH, HMS) for critical statistical consultation pertaining to the gapping analysis.
Author Contributions
BWK MJL SW SL JC SMH MF JWS GPG HCB. Contributed reagents/ materials/analysis tools: AJB NM RHP DNK BWK MJL SMH BR HCB. Wrote the paper: AJB HCB. Contributed revisions to the manuscript drafts
produced by AJB and HCB: DI NM RHP DNK DDD BWK MJL SW SL JC SMH MF BR JWS GPG.
References
1. Breiter HC, Gasic GP (2004) A General Circuitry of Reward/Aversion and Its Implications for Neuropsychiatric Illness. In: M Gazzaniga, ed. The Cognitive Neurosciences MIT Press. pp 1043–1065.
2. Pizzagalli DA, Holmes AJ, Dillon DG, Goetz EL, Birk JL, et al. (2009) Reduced caudate and nucleus accumbens response to rewards in unmedicated individuals with major depressive disorder. Am J Psychiatry 166: 702–710.
3. Forbes EE (2009) Where’s the fun in that? Broadening the focus on reward function in depression. Biol Psychiatry 66: 199–200.
4. McCabe C, Cowen PJ, Harmer CJ (2009) Neural representation of reward in recovered depressed patients. Psychopharmacology (Berl) 205: 667–677. 5. Schlaepfer TE, Cohen MX, Frick C, Kosel M, Brodesser D, et al. (2007) Deep
Brain Stimulation to Reward Circuitry Alleviates Anhedonia in Refractory Major Depression. Neuropsychopharmacology.
6. Tremblay LK, Naranjo CA, Graham SJ, Herrmann N, Mayberg HS, et al. (2005) Functional neuroanatomical substrates of altered reward processing in major depressive disorder revealed by a dopaminergic probe. Arch Gen Psychiatry 62: 1228–1236.
7. Nestler EJ, Carlezon WA Jr. (2006) The mesolimbic dopamine reward circuit in depression. Biol Psychiatry 59: 1151–1159.
8. Breiter HC, Rosen BR (1999) Functional magnetic resonance imaging of brain reward circuitry in the human. Ann N Y Acad Sci 877: 523–547.
9. Breiter HC, Etcoff NL, Whalen PJ, Kennedy WA, Rauch SL, et al. (1996) Response and habituation of the human amygdala during visual processing of facial expression. Neuron 17: 875–887.
10. Blood AJ, Zatorre RJ, Bermudez P, Evans AC (1999) Emotional responses to pleasant and unpleasant music correlate with activity in paralimbic brain regions. Nat Neurosci 2: 382–387.
11. Breiter HC, Aharon I, Kahneman D, Dale A, Shizgal P (2001) Functional imaging of neural responses to expectancy and experience of monetary gains and losses. Neuron 30: 619–639.
12. Becerra L, Breiter HC, Wise R, Gonzalez RG, Borsook D (2001) Reward circuitry activation by noxious thermal stimuli. Neuron 32: 927–946. 13. Delgado MR, Nystrom LE, Fissell C, Noll DC, Fiez JA (2000) Tracking the
hemodynamic responses to reward and punishment in the striatum. J Neurophysiol 84: 3072–3077.
14. Jensen J, McIntosh AR, Crawley AP, Mikulis DJ, Remington G, et al. (2003) Direct activation of the ventral striatum in anticipation of aversive stimuli. Neuron 40: 1251–1257.
15. Roitman MF, Wheeler RA, Carelli RM (2005) Nucleus accumbens neurons are innately tuned for rewarding and aversive taste stimuli, encode their predictors, and are linked to motor output. Neuron 45: 587–597.
16. Menon M, Jensen J, Vitcu I, Graff-Guerrero A, Crawley A, et al. (2007) Temporal difference modeling of the blood-oxygen level dependent response during aversive conditioning in humans: effects of dopaminergic modulation. Biol Psychiatry 62: 765–772.
17. Diaconescu AO, Menon M, Jensen J, Kapur S, McIntosh AR Dopamine-induced changes in neural network patterns supporting aversive conditioning. Brain Res 1313: 143–161.
18. Matsumoto M, Hikosaka O (2009) Two types of dopamine neuron distinctly convey positive and negative motivational signals. Nature 459: 837–841. 19. Leknes S, Tracey I (2008) A common neurobiology for pain and pleasure. Nat
Rev Neurosci 9: 314–320.
20. Levita L, Hare TA, Voss HU, Glover G, Ballon DJ, et al. (2009) The bivalent side of the nucleus accumbens. Neuroimage 44: 1178–1187.
21. Carlezon WA Jr., Thomas MJ (2009) Biological substrates of reward and aversion: a nucleus accumbens activity hypothesis. Neuropharmacology 56 Suppl 1: 122–132.
22. Kim BW, Kennedy DN, Lehar J, Lee MJ, Blood AJ, et al. Recurrent, robust and scalable patterns underlie human approach and avoidance. PLoS One 5: e10613.
23. Bogdan R, Pizzagalli DA (2006) Acute stress reduces reward responsiveness: implications for depression. Biol Psychiatry 60: 1147–1154.
24. Breiter HC, Gasic GP, Makris, N (2006) Imaging the neural systems for motivated behavior and their dysfunction in neuropsychiatric illness. In: Deisboeck T, Kresh J, eds. Complex systems science in biomedicine. New York: Springer Verlag. pp 763–810.
25. Berton O, McClung CA, Dileone RJ, Krishnan V, Renthal W, et al. (2006) Essential role of BDNF in the mesolimbic dopamine pathway in social defeat stress. Science 311: 864–868.
26. Olds J, Milner P (1954) Positive reinforcement produced by electrical stimulation of septal area and other regions of rat brain. J Comp Physiol Psychol 47: 419–427.
27. Wise RA, Bozarth MA (1985) Brain mechanisms of drug reward and euphoria. Psychiatr Med 3: 445–460.
28. Wise RA (1978) Catecholamine theories of reward: a critical review. Brain Res 152: 215–247.
29. Manji HK, Drevets WC, Charney DS (2001) The cellular neurobiology of depression. Nat Med 7: 541–547.
30. Breiter HC, Gollub RL, Weisskoff RM, Kennedy DN, Makris N, et al. (1997) Acute effects of cocaine on human brain activity and emotion. Neuron 19: 591–611.
31. Milak MS, Parsey RV, Lee L, Oquendo MA, Olvet DM, et al. (2009) Pretreatment regional brain glucose uptake in the midbrain on PET may predict remission from a major depressive episode after three months of treatment. Psychiatry Res 173: 63–70.
32. Wacker J, Dillon DG, Pizzagalli DA (2009) The role of the nucleus accumbens and rostral anterior cingulate cortex in anhedonia: integration of resting EEG, fMRI, and volumetric techniques. Neuroimage 46: 327–337.
33. Nobuhara K, Okugawa G, Sugimoto T, Minami T, Tamagaki C, et al. (2006) Frontal white matter anisotropy and symptom severity of late-life depression: a magnetic resonance diffusion tensor imaging study. J Neurol Neurosurg Psychiatry 77: 120–122.
34. Drevets WC, Price JL, Simpson JR, Jr., Todd RD, Reich T, et al. (1997) Subgenual prefrontal cortex abnormalities in mood disorders. Nature 386: 824–827.
35. Drevets WC, Ongur D, Price JL (1998) Reduced glucose metabolism in the subgenual prefrontal cortex in unipolar depression. Mol Psychiatry 3: 190–191. 36. Taylor WD, MacFall JR, Payne ME, McQuoid DR, Provenzale JM, et al. (2004) Late-life depression and microstructural abnormalities in dorsolateral prefrontal cortex white matter. Am J Psychiatry 161: 1293–1296.
37. Keedwell PA, Andrew C, Williams SC, Brammer MJ, Phillips ML (2005) The neural correlates of anhedonia in major depressive disorder. Biol Psychiatry 58: 843–853.
38. Alexopoulos GS, Kiosses DN, Choi SJ, Murphy CF, Lim KO (2002) Frontal white matter microstructure and treatment response of late-life depression: a preliminary study. Am J Psychiatry 159: 1929–1932.
39. Bae JN, MacFall JR, Krishnan KR, Payne ME, Steffens DC, et al. (2006) Dorsolateral prefrontal cortex and anterior cingulate cortex white matter alterations in late-life depression. Biol Psychiatry 60: 1356–1363.
40. Frodl T, Meisenzahl EM, Zetzsche T, Born C, Groll C, et al. (2002) Hippocampal changes in patients with a first episode of major depression. Am J Psychiatry 159: 1112–1118.
41. Mintun MA, Sheline YI, Moerlein SM, Vlassenko AG, Huang Y, et al. (2004) Decreased hippocampal 5-HT2A receptor binding in major depressive disorder: in vivo measurement with [18F]altanserin positron emission tomography. Biol Psychiatry 55: 217–224.
42. Sheline YI, Wang PW, Gado MH, Csernansky JG, Vannier MW (1996) Hippocampal atrophy in recurrent major depression. Proc Natl Acad Sci U S A 93: 3908–3913.
43. Bremner JD, Narayan M, Anderson ER, Staib LH, Miller HL, et al. (2000) Hippocampal volume reduction in major depression. Am J Psychiatry 157: 115–118.
44. Saxena S, Brody AL, Ho ML, Alborzian S, Ho MK, et al. (2001) Cerebral metabolism in major depression and obsessive-compulsive disorder occurring separately and concurrently. Biol Psychiatry 50: 159–170.
45. Edwards E, Kornrich W, van Houtten P, Henn FA (1992) In vitro neurotransmitter release in an animal model of depression. Neurochem Int 21: 29–35.
46. Drevets WC, Price JL, Bardgett ME, Reich T, Todd RD, et al. (2002) Glucose metabolism in the amygdala in depression: relationship to diagnostic subtype and plasma cortisol levels. Pharmacol Biochem Behav 71: 431–447. 47. Frodl T, Meisenzahl E, Zetzsche T, Bottlender R, Born C, et al. (2002)
Enlargement of the amygdala in patients with a first episode of major depression. Biol Psychiatry 51: 708–714.
48. Mayberg HS (2003) Modulating dysfunctional limbic-cortical circuits in depression: towards development of brain-based algorithms for diagnosis and optimised treatment. Br Med Bull 65: 193–207.
49. Fava M, Martinez JM, Greist J, Marangell LB, Brown E, et al. (2007) The efficacy and tolerability of duloxetine in the treatment of anxious versus non-anxious depression: a post-hoc analysis of an open-label outpatient study. Ann Clin Psychiatry 19: 187–195.
50. Sobin C, Sackeim HA (1997) Psychomotor symptoms of depression. Am J Psychiatry 154: 4–17.
51. Dougherty DD, Weiss AP, Cosgrove GR, Alpert NM, Cassem EH, et al. (2003) Cerebral metabolic correlates as potential predictors of response to anterior cingulotomy for treatment of major depression. J Neurosurg 99: 1010–1017. 52. Langguth B, Wiegand R, Kharraz A, Landgrebe M, Marienhagen J, et al. (2007)
Pre-treatment anterior cingulate activity as a predictor of antidepressant response to repetitive transcranial magnetic stimulation (rTMS). Neuro Endocrinol Lett 28: 633–638.