A
r
ti
c
le
0103 - 5053 $6.00+0.00
*e-mail: [email protected]
Folic Acid and Iron Evaluation in Brazilian Enriched Corn and Wheat Flours
Thaís Rezende Boen,
aBruno Thiago Soeiro,
aEdenir Rodrigues Pereira-Filho
band
Juliana Azevedo Lima-Pallone*
,aaFaculdade de Química, CEATEC, Pontifícia Universidade Católica de Campinas,
Rodovia D. Pedro I, km 136, 13086-900 Campinas-SP, Brazil
bDepartamento de Química, Centro de Ciências Exatas e de Tecnologia, Universidade Federal de São Carlos,
Rodovia Washington Luís (SP-310), km 235, 13565-905 São Carlos-SP, Brazil
O ácido fólico tem sido identificado como uma das mais importantes vitaminas para a função normal do metabolismo humano. A deficiência de ferro é um sério problema de saúde que afeta uma grande proporção da população do mundo. No Brasil, foi publicada uma regulamentação indicando que farinhas de milho e trigo devem ser fortificadas com ácido fólico e ferro. O objetivo deste trabalho foi avaliar os níveis de ácido fólico e ferro em algumas farinhas enriquecidas. A quantificação de ambos nutrientes indicou que a concentração de ácido fólico variou entre 96 a 558 µg per100 g (em milho) e 73 a 233 µg per100g (em trigo) e de 3,8 a 8,7 mg per 100 g (em milho) e 4,6 a 7,4 mg per 100g (em trigo) para ferro. Portanto, a população brasileira parece estar exposta a concentrações inadequadas de ácido fólico e ferro quando farinhas de trigo e milho são consumidas.
Folic acid has been identified as one of the most important vitamins for normal human metabolic function. Iron deficiency is a serious health problem affecting a large proportion of the world population. In Brazil, an issue has been ruled requiring that corn and wheat flours must be fortified by the addition of folic acid and iron. The aim of this work was to evaluate the levels of folic acid and iron in some enriched flours. The successful quantification of both nutrients indicated that the levels of folic acid are in the range of 96 to 558 µg per100g (in corn) and 73 to 233 µg per100 g (in wheat) and from 3.8 to 8.7 mg per 100 g (in corn) and 4.6 to 7.4 mg per100g (in wheat) for iron. Finally the Brazilian population seems to be exposed to inadequate concentrations of folic acid and iron when consuming enriched corn flours and some wheat flours.
Keywords: folic acid, iron, enriched flours
Introduction
Fortification of foods for human consumption is an important strategy in order to improve the nutritional quality of populations. Deficiencies of vitamins and minerals can cause several problems as learning disabilities, mental retardation, poor health, low work capacity, blindness and premature death.1 Some countries, including Brazil, issue a regulation requiring that corn and wheat flours be fortified by the addition of folic acid (150 µg per 100 g) and iron (4.2 mg per 100 g).2
Iron deficiency has a significant impact on the well-being of individuals as well as the productivity
However, cellular DNA damage, under pro-oxidant conditions, has been show to be mediated by iron. Iron is an important element in the establishment of a pro-oxidant status in the cell.9 In this aspect, extensive postmortem studies have provided evidence to support the involvement of oxidative stress in the pathogenesis of Parkinson´s disease and iron can induce oxidative stress.10 Therefore, the availability of iron levels in enriched flours is important to understand the possible effects in the health of population, considering the negative and positive aspects of the consumption of enriched foods with this element.
Folic acid is a B vitamin (B9) that is required for transmethylation reactions, including nucleic acid synthesis and homocysteine metabolism11 besides its importance, folic acid is unstable in diverse conditions such as those required for processing and storage of foods.12 Homocysteine is an amino acid intermediary in the metabolic pathway for methionine that has pro-oxidant properties and that in high concentrations is a cause of endothelial dysfunction. Elevated levels of homocysteine have been associated with increase risk of ischemic heart disease. Folic acid reduces circulating homocysteine levels.13 In recent years, the potential role of folic acid in prevention of neural tube defects (NTD) has been well established.14 NTD are the largest group of anomalies of the central nervous system and are a major cause of morbidity and mortality in infants worldwide.15 These defects arise in very-early pregnancy, at approximately 26 to 28 days of gestation, which normally occurs before women are aware that they have conceived.16 Thus, folic acid fortification of foods was intended to increase vitamin intake among childbearing-aged women to reduce their risk of NTD.17
However, excess of folic acid consumption can result in unacceptably high intakes in any group of population. The meganoblastic anemia caused by folic acid and cianocobalamin (B12) deficiency can be mask. Other question, which could contribute to a negative impact of folic acid fortification, is on pre-existing malignant neoplasms or on dichorionic twin birth rates.18 Therefore, the analysis of folic acid contents is very important to contribute in assessing the effects of a fortification program, creating a relation between the real concentration of the vitamin in enriched foods and the changes in the prevalence of diseases associated with deficiency and excess of the latter vitamin.
Thus, the aim of this work was to evaluate the levels of folic acid and iron in corn and wheat enriched flours.
Experimental
Evaluated products
Sample flours that were evaluated had the following characteristics: eight different brands (A-H) of wheat (WF) and six (A-F) corn (CF) flours were chosen in an arbitrary way and divided in five batches (1-5) each one. A total of 70 samples were evaluated. Batches that were purchased in local markets in the city of Campinas, São Paulo State, Brazil, were differentiated according to their expire date. Samples were homogenized, submitted to a sampling process and folic acid and iron determinations were performed in triplicates.
Reagents
Folic acid was obtained from Sigma USA (F-7876). Chromatographic grade acetonitrile was acquired from J. T. Backer, USA. Analytical grade acetic acid, potassium hydroxide, trichloroacetic acid, sodium phosphate dibasic anhydrous (Na2HPO4) and potassium phosphate monobasic anhydrous (KH2PO4) were obtained from Synth, Brazil. The water used for sample and mobile phase preparation was distilled and deionized (18 M7 cm resistivity). The mobile phases were filtered through Millipore filters, Brasil (04700 HAWP and FHLP Millipore), with 0.45 µm diameter pores. Nitric acid and hydrogen peroxide were acquired from Merck, Germany. Iron calibration solutions from 0.5 to 6 mg L-1 were prepared by appropriate dilution of a 1000 mg L-1 (AccuStandard, USA) stock solution.
Equipment
An Agilent Technologies (USA) series 1100 liquid chromatograph equipped with a binary pump and diode array detector was used for folic acid determination. The Chemstation data acquisition system was used to collect the chromatographic data and to evaluate peak area. Folic acid was separated using a Hypersil ODS 5 µm, 125×4.0 mm i.d. column (Agilent Technologies), protected by a Hypersil ODS, 5 µm, 4×4 mm i.d. guard column (Agilent Technologies).
The other operational parameters (current and slit) were those recommended by the manufacturer.
Folic acid determination
The method developed by Lima et al.19 was adapted for these flours samples and used for folic acid determination. A sample of 1 g of flour was taken after total homogenization of the whole material. The vitamin was extracted with 4 mL of acetonitrile, 3 mL of potassium hydroxide, 2 mL of phosphate buffer [Na2HPO4 (0.25 mol L-1)/KH
2PO4 (0.37 mol L-1)] and 500 µL of trichloroacetic acid (TCA) (95%) were added. The final volume was adjusted with phosphate buffer up to 10 mL. Extracts were first filtered through qualitative filter paper and then through a FHLP 01300 Millipore membrane, with 0.45 µm pores. Twenty µL of the filtered extracts were immediately injected into the chromatograph. Folic acid was separated using a gradient elution, starting with a 100% acetic acid solution (2% v/v) pH 2.8 and arriving at 76% acetic acid plus 24% acetonitrile in 28 minutes. Connected UV-Visible plus diode array (DAD) detector (290 nm) was used for its detection. Identification of the vitamin was provided by comparison of the retention times obtained with a standard analyzed under the same conditions, plus spiking and comparison of the absorption spectra obtained by DAD. The flow rate was 1.0 mL min-1. Peak purity was determined using the plotter system available in the Chemstation software. Quanti-fication was performed using an external standard.
Sample preparation for iron determination
Samples of 0.3000 g of flours were taken after total homogenization of the whole sample and were mineralized in a digestor block (Quimis, model M242, Brazil) equipped with special glass tubes (250 mm length, 20 and 25 mm inner and outer diameter, respectively) and a mixture composed by concentrated HNO3 (65%, v/v) and H2O2 (30%, m/v). The mineralization was made using 3 mL of concentrated HNO3 and 1 mL of H2O2(30%, m/v). The sample was weighted and transferred to the mineralization tube; the HNO3 was added and a small funnel was placed on the tube to permit a reflux of HNO3and a better contact between the sample and the acid. The tubes were then placed in a block digestor, heated to 100 oC during 60 min, cooled and then the H2O2 was carefully added. After that the block temperature was slowly increased to 130 oC and the tubes heated up to a final volume of around 0.5 mL. The whole mineralization procedure took approximately 4 h to be completed. Mineralized samples were quantita-tively transferred to volumetric flasks (25 mL) and the
volumes completed with a solution of HNO3(0.01 mol L-1). Iron calibration solutions from 0.5 to 6 mg L-1 were prepared using the same 0.01 mol L-1 HNO
3 solution. Both calibration solutions and samples were analyzed using the flame atomic absorption spectrometer described in the Equipment section.
Methods validation
Folic acid
The repeatability and recovery of standards were determined for the samples analyzed in this study, since the chromatographic separation was modified. The detection and quantification limits were also determined.
Repeatability
This parameter was determined by carrying out 10 determinations and calculated in accordance with Ribani et al.20
Recovery of standards
To determine the recoveries, initially the naturally occurring folic acid contents in flours were determined, taking an average of 10 analyses. A known amount of folic acid standard was then added to the matrices, at two different levels of concentration, and five determinations were made in triplicate, following the methodology for folic acid determination. The recoveries were calculated in accordance with Rodriguez et al.,21 using the following equation:
Recovery = (concentration found - sample concentration) r 100% concentration added
Detection and quantification limits
The detection (LOD) and quantification limits (LOQ) were estimated by analytical curve parameters, according to Ribani et al.20
LOD = 3.3 SD S-1 LOQ = 10 SD S-1
SD = standard deviation estimate of blank S = angular coefficient of analytical curve
Iron
LOD = 3 SD S-1 LOQ = 10 SD S-1
SD = standard deviation of blank
S = angular coefficient of the analytical curve
Results and Discussion
Methods validation
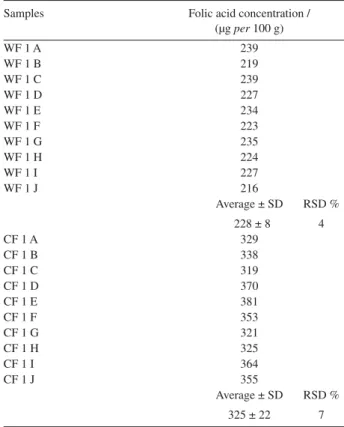
Table 1 shows some folic acid values for two samples: WF1 and CF1. The relative standard deviation was 4% for wheat and 7% for corn flours. Table 2 presents the recoveries for the vitamin standard when added in two flours (WF1 and CF1). The values varied from 94 to 97%. The LOD and LOQ for folic acid were 3 ng mL-1 and 9 ng mL-1, respectively. The method was considered adequate for folic acid evaluation in enriched flours.
Table 3 shows iron determination in reference material (BCR-679) and the comparison with certified value. It was observed that the values were very similar and it was not verified any difference at a confidence level of 95% when a t test was applied. The LOD and LOQ for iron were 0.3 mg L-1 and 1.0 mg L-1, respectively.
Analytical step
Figure 1 shows some of the chromatograms obtained in the analysis of folic acid standard solution (Figure 1a) and samples of corn (1b) and wheat (1c) flours. In these Figures, the peak for folic acid appears in an isolated form with a retention time of approximately 13 min. The efficiency of the chromatographic separation system was verified using the pureness parameters, supplied by the Chemstation software. The concentration of folic acid was evaluated by external standardization (calibration solutions from 0.045 to 1.5 µg per100 g), the analytical curve presenting good linearity in the pre-established concentration bands. The coefficient of correlation obtained was 0.9997.
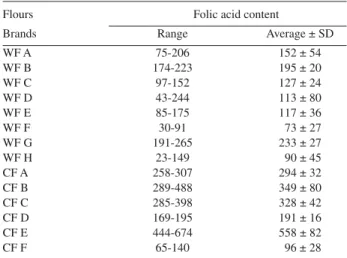
Table 4 shows the folic acid content in wheat and corn flours evaluated in this work. Values ranged from 23 (for WF H) to 674 (CF E) µg per 100 g. For wheat flours, the folic acid content was, in average, 152, 195, 127, 113, 117, 73, 233, 90 µg per100 g for the eight different brands named WF A, B, C, D, E, F, G and H (see bold numbers Table 4). From these data it was possible to verify that, with different brands and lots available, WT A and WT C presents levels according to Brazilian Federal regulations (150 µg per 100 g ± 20%) for folic acid. For the flours
Figure 1. Chromatographic profiles obtained after folic acid determination in standard (a), corn (b) and wheat flours (c).
Table 1. Folic acid concentrations in the enriched wheat and corn flours observed for the repeatability tests for the proposed method
Samples Folic acid concentration /
(µgper100 g)
WF 1 A 239
WF 1 B 219
WF 1 C 239
WF 1 D 227
WF 1 E 234
WF 1 F 223
WF 1 G 235
WF 1 H 224
WF 1 I 227
WF 1 J 216
Average ± SD RSD %
0228 ± 8 4
CF 1 A 329
CF 1 B 338
CF 1 C 319
CF 1 D 370
CF 1 E 381
CF 1 F 353
CF 1 G 321
CF 1 H 325
CF 1 I 364
CF 1 J 355
Average ± SD RSD %
325 ± 22 7
WF B and WF G, the folic acid content was higher than mentioned on the product label and for WF D, E, F and H the vitamin content was lower than recommended for Brazilian Legislation. An analyze of variance (ANOVA) showed that the different brands of wheat flour presented significant differences between the batches and the brands with a confidence level of 95%. For corn flours, average content of vitamin was 294, 349, 328, 191, 558 and 96 µg per100 g (CF A, B, C, D, E and F, respectively). For the six brands of corn flours the concentration of folic acid was, in average, twice higher than the expected value. In the case of these samples, significant difference (95% of confidence) between the brands and batches was observed after variance analyses.
These results showed a great variation in folic acid concentration. In one hand the concentrations were very close or lower than the issued value (case of most of wheat flours). On the other hand, corn flours presented extremely high values (except CF F). These observations can contribute negatively on the estimation of the reliability of the fortification program. The difference observed for folic acid content in enriched wheat and corn flours (brands and batches) can be explained due to problems during the addition and homogenization of the vitamin, besides to degradation of folic acid that can occur during the storage period.
Arcotet al.23 found 82 to 95 µg per100 g in USA flours samples evaluated (the estimate value was 140 µg per 100 g). Raderet al.24 found 33-229 µg per100 g for samples also commercialized in USA. Gujska and Majewska25 indicated 237 ± 7 µg per100 g for folic acid in flours commercialized in Poland (fortification is not mandatory). These results indicated that the enrichment is being performed, but in the same form that in Brazil, folic acid content in flours is not adequate.
In order to obtain more information about the folic acid content in the flours, it was separated according to their expired dates. Samples were divided in three groups: (i) samples where the difference between the dates of analysis and expire date is equal or lower than 1 month, (ii) samples in which this variation is until 3 months and (iii) those in which the difference is of up to 5 months. This separation is presented in Figure 2. The average concentration of folic acid observed for groups 1, 2 and 3 were 139, 198 and 293 µg per100g, respectively. It was verified, after variance analysis that a significant difference is found among values for folic acid concentration at a confidence level of 95%. For batches with expire date close to folic acid evaluation date (samples placed at group 1), the vitamin content was lower than values of the other groups. These observations
Table 4. Folic acid (range) content (mg per 100g) in enriched wheat (WF) and corn (CF) flours and average values
Flours Folic acid content
Brands Range Average ± SD
WF A 75-206 152 ± 54
WF B 174-223 195 ± 20
WF C 97-152 127 ± 24
WF D 43-244 113 ± 80
WF E 85-175 117 ± 36
WF F 30-91 073 ± 27
WF G 191-265 233 ± 27
WF H 23-149 090 ± 45
CF A 258-307 294 ± 32
CF B 289-488 349 ± 80
CF C 285-398 328 ± 42
CF D 169-195 191 ± 16
CF E 444-674 558 ± 82
CF F 65-140 096 ± 28
WF, wheat flours; CF, corn flours.
Table 3. Iron values obtained with the certified material (BCR-679)
Iron content BCR -679 / (mg per kg)
77.2 61.7 62.8 54.6 60.9 62.9 69.6 73.4
Average ± SD RSD %
65 ± 7 11
Iron content certified BCR -679 / (mg per kg)
Average ± SD RSD %
55 ± 1.3 2.4
Table 2. Recoveries for folic acid in enriched corn and wheat flours
Sample Recoveries / (%) Recoveries / (%)
Level 1 Level 2
(folic acid standard = 0.23 µg per mL) (folic acid standard = 0.11 µg permL)
Average ± SD % RSD Average ± SD % RSD
WF1 98 ± 2 2 96 ± 2 2
CF 1 98 ± 2 2 94 ± 1 2
can be explained by a degradation of vitamin during the storage period of enriched flours.
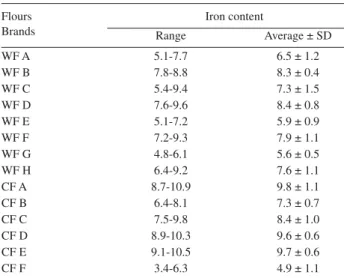
The results obtained for total iron content are presented in Table 5. Information about iron naturally occurring in Brazilian flours was collected from the Table of Composition Foods and the values of 1.0 mg per100 g and 0.9 mg per 100 g are cited for wheat and corn flours, respectively. These values can be used to estimate the added iron content and the variation values were from 2.5 to 10 mgper100 g, for the analyzed flours. For wheat flours, iron concentration was 5.5 (WF A), 7.3 (B), 6.3 (C), 7.4 (D), 4.9 (E), 6.9 (F), 4.6 (G) and 6.6 (G) mg per 100 g, in average. For corn flours the mineral content, in average, was 8.9 (CF A), 6.4 (B), 7.5 (C), 8.7 (D), 8.8 (E) and 4.0 (F) mg per100 g. For corn and wheat flours, a comparison of the values obtained, for the different
brands, in the analyses of variance (95% of confidence) detected significant differences. Analysis of the obtained data indicates that these values are higher than the recommended by Brazilian Legislation, for the majority of brands and their respective batches. This information is important for evaluation of iron consumption in order to correlate this data with the incidence of diseases that can be caused by deficiency or excess of the mineral in the diet. The difference observed for iron content in enriched wheat and corn flours (brands and batches) can be explained due to problems during addition and homogenization of mineral, beyond to differences in iron naturally occurring.
The results obtained in this work indicate that the enrichment of wheat and corn flours are being performed, however it was possible to verify that the folic acid and iron contents, are, in average, very different than the values indicated by Brazilian Legislation for the greater majority of samples. This observation is important for the evaluation of the results of the enrichment program and their relation with diseases associated with the consumption of the vitamin and mineral.
Acknowledgments
The authors are grateful to Fapesp (04/02664-4, 04/14413-6, 04/01970-4 and 04/08796-0) and to Wheat Trade Union-São Paulo, Brazil.
References
1. Salgueiro, M. J.; Zubillaga, M.; Lysionek, A.; Caro, R.; Weill, R.; Boccio, J.; Nutr. Rev. 2002,60, 52.
2. ANVISA, Agência Nacional de Vigilância Sanitária; Legislação em Vigilância Sanitária www.anvisa.gov.br/e-legis, accessed in December 10, 2007.
3. Preziosi, P.; Prual, A; Galan, P.; Am. J. Clin. Nutr. 1997,66, 1178.
4. Lozoff, B.; Jiménez, E.; Hagen, J.; Pediatrics 2000,105, E51.
5. Lozoff, B.; Pediat. Res. 2000,48, 137.
6. Haas, J. D.; Brownlie, T.; J. Nutr.2001,131, 676S. 7. Beard, J. L.; J. Nutr. 2001,131, 568S.
8. Lynch, S. R.; Best Pract. Res. Clin. Haematol.2005,18, 333. 9. Meneghini, R.; Free Radical Biol. Med. 1997,23, 783. 10. Jenner, P; Olanow, C. W.; Neurology1996,47, S161. 11. Verhaar, M. C.; Circulation1998,97, 237.
12. Gregory III, J. F.; Adv. Food Nutr. Res.1989,3, 1.
13. Eikelboom, J. W.; Lonn, E.; Genest, J. J.; Hankey, G.; Yusuf, S.;Annals Inter. Med.1999,131, 363.
Figure 2. Folic acid concentration (mg per100 g) in wheat and corn flours, according to date of analysis and expired date (Group 1-3). The dotted line represents folic acid concentration (150 mg per 100 g), which has been specified by Brazilian legislation.
Table 5. Iron (range) content (mg per 100 g) in enriched wheat (WF) and corn (CF) flours and average values
Flours Iron content
Brands Range Average ± SD
WF A 5.1-7.7 6.5 ± 1.2
WF B 7.8-8.8 8.3 ± 0.4
WF C 5.4-9.4 7.3 ± 1.5
WF D 7.6-9.6 8.4 ± 0.8
WF E 5.1-7.2 5.9 ± 0.9
WF F 7.2-9.3 7.9 ± 1.1
WF G 4.8-6.1 5.6 ± 0.5
WF H 6.4-9.2 7.6 ± 1.1
CF A 8.7-10.9 9.8 ± 1.1
CF B 6.4-8.1 7.3 ± 0.7
CF C 7.5-9.8 8.4 ± 1.0
CF D 8.9-10.3 9.6 ± 0.6
CF E 9.1-10.5 9.7 ± 0.6
CF F 3.4-6.3 4.9 ± 1.1
14. Czeizel, A. E.; Dudas, I.; N. Engl. J. Med. 1992,327, 1832. 15. Botto, L. D.; Moore, C. A.; Khoury, M. J.; Erickson, J. D.; N.
Engl. J. Med. 1999,341, 1509.
16. Daly, L. E.; Kirke, P. N.; Malloy, A.; Weir, D. G.; Scott, J. M. J.;Am. Med. Assoc.1995,274, 1698.
17. Persad, V. L.; Van den Hof, M. C.; Dubé, J. M.; Zimmer, P. J.;
Can. Med. Assoc.2002,167, 241.
18. Wright, A. J. A.; Finglas, P. M.; Southon, S.; Trends Food Sci. Technol.2001,12, 313.
19. Lima, J. A.; Catharino, R. R.; Godoy, H. T.; Tecn. Mollit. Intern.
2004,55, 151.
20. Ribani, M.; Bottoli, C. B. G.; Collins, C. H.; Jardim, I. C. S. F.; Melo, L. F. C. M.; Quim. Nova2004,27, 771.
21. Rodriguez, L. C.; Campana, A. M. G.; Barrero, F. A.; Linares, C. J.; Ceba, M. R. J.; J. AOAC Int.1995,78, 471.
22. Analytical Methods Committee; Analyst1987,112, 199. 23. Arcot, J.; Shrestha, A.J.; Gusanov, U.; Food Control2002,13,
245.
24. Rader, J. I.; Weaver, C.M.; Angyal, G.; Food Chem.2000,70, 275.
25. Gujska, E.; Majewska, K.; Plant Foods Hum. Nutr.2005,60, 37.
Received: February 6, 2007
Published on the web: January 22, 2008