A
r
ti
c
le
0103 - 5053 $6.00+0.00
*e-mail: [email protected]
Ethanol Electrooxidation on Pt-Sn and Pt-Sn-W Bulk Alloys
D. M. dos Anjos,
a,bF. Hahn,
aJ. -M. Léger,
aK. B. Kokoh
aand G. Tremiliosi-Filho*
,baEquipe Electrocatalyse, UMR 6503 CNRS, Université de Poitiers, 40 Avenue du Recteur Pineau,
86022 Poitiers Cedex, France
bInstituto de Quimica de São Carlos, Universidade de São Paulo, CP 780,
13560-970 São Carlos-SP, Brazil
A oxidação de etanol foi estudada sobre eletrodos Pt-Sn e Pt-Sn-W preparados em forno a arco elétrico. Diferentes técnicas eletroquímicas, tais como voltametria cíclica e cronoamperometria foram utilizadas para avaliar a atividade catalítica desses materiais. O processo de eletro-oxidação também foi investigado in situ por espectroscopia de reflectância na região do infravermelho para determinar intermediários adsorvidos e produtos da reação. Os resultados experimentais indica-ram que as ligas Pt-Sn e Pt-Sn-W são capaz de oxidar etanol principalmente para acetaldeído e ácido acético. CO adsorvido também foi detectado, demonstrando a viabilidade do rompimento da ligação C–C na molécula de etanol durante o processo de oxidação. Adicionalmente, o CO adsorvido foi oxidado a CO2. Esse produto de reação foi claramente detectado por SNIFTIRS. O
catalisador Pt-Sn-W mostrou um melhor desempenho eletroquímico em relação ao Pt-Sn e este, por sua vez, é melhor do que Pt pura.
Ethanol oxidation has been studied on Pt-Sn and Pt-Sn-W electrodes prepared in an arc-melting furnace. Different electrochemical techniques like cyclic voltammetry and chronoamperometry were used to evaluate the catalytic activity of these materials. The electro-oxidation process was also investigated by in situ infrared reflectance spectroscopy in order to determine adsorbed inter-mediates and reaction products. Experimental results indicated that Pt-Sn and Pt-Sn-W alloys are able to oxidize ethanol mainly to acetaldehyde and acetic acid. Adsorbed CO was also detected, demonstrating the viability of splitting the C-C bond in the ethanol molecule during the oxidation process. The adsorbed CO was further oxidized to CO2.This reaction product was clearly detected by SNIFTIRS. Pt-Sn-W catalyst showed a better electrochemical performance than Pt-Sn that, in it turn, is better than Pt-alone.
Keywords: ethanol oxidation, direct ethanol fuel cell, platinum-tin, platinum-tin-tungsten,
in situ Infrared Reflectance Spectroscopy
Introduction
Ethanol is a molecule of considerable interest because of its importance and potential use as renewable fuel (can be obtained from sugar cane for example) for fuel cells
applications.1-4 Among the various alcohols which can
be used as alternative fuel, ethanol is the most promising one because it is a safer molecule comparatively to methanol. As a liquid, it is easy to store and handle when comparing to hydrogen. Moreover, ethanol has a high
theoretical energy (8 kWh kg-1 against 6.1 kWh kg-1for
methanol and 33 kWh kg-1 for pure hydrogen without
storage).5,6 Ethanol main disadvantage comes from its
molecular structure with a carbon containing a primary alcohol function and a methyl group. This characteristic induces a hard conversion of ethanol into carbon dioxide due to the difficult to break the C-C bond and promote the complete oxidation of the methyl group with Pt as
electrocatalyst.7-9
Several studies on the ethanol electrooxidation focused mainly to identify adsorbed intermediates showed the presence of carbon monoxide species strongly adsorbed at the electrode surface. Many studies using Differential
Electrochemical Mass Spectrometry (DEMS) and in situ
and reaction products. DEMS experiments identified
acetaldehyde and CO2 as primary reaction products, and
using isotope labelling strategies, these studies showed that acetaldehyde is formed by cleavage of the C-H bonds
with the A-carbon and the hydroxyl group, while CO2 is
formed through a multistep pathway involving a strongly bond intermediate. These experiments also indicated that
the carbon atom in the CO2 product formed is originated
either from the methyl group or from alcohol group of
ethanol.11-14 Elsewhere, methane and ethane were also
detected as adsorption products probably issued from the
methyl radicals formed during C-C bond cleavage.12,13
Further FTIRS experiments have also shown that adsorbed carbon monoxide was an important intermediate, strongly
adsorbed at the Pt surface.14-28 As pointed out above,
modification in catalyst composition becomes necessary to enhance ethanol electrocatalytic oxidation and to decrease the poisoning of the catalyst by adsorbed CO. Recent studies have shown that bimetallic Pt-based catalysts can enhance the oxidation of CO and small organic molecules due to the bifunctional or the electronic (or ligand) effects or the combination of both. A third transition metal (M) (such as Ru, Sn, Mo, Rh, Os etc) can also be introduced as
co-catalyst in the composition of the electrode material.29-35
It is well known that PtSn is actually the most interesting catalyst for ethanol oxidation, although some contradictory
results can be found in the literature.32-35 These bimetallic
materials improved the catalytic effect of platinum by a bifunctional mechanism where partially oxidized M at the surface supplies oxygenated species for improving the oxidation of the adsorbates. A catalytic effect can also be explained by the ligand effect where the metal M atoms close to Pt are expected to influence the density of electronic states of Pt, leading to the weakening of the
Pt-CO bond.36-39
The present work focuses on ethanol oxidation on Pt alloy catalysts (Pt-Sn and Pt-Sn-W) prepared by an arc-melting furnace process. Chronoamperometric measurements were performed with each catalyst in order to compare their electroactivities to that of Pt alone. Results obtained from the study of the electrooxidation of ethanol by FTIRS were discussed in terms of reaction mechanism.
Experimental
Polycrystalline Pt-Sn and Pt-Sn-W alloys electrodes with 80:20 and 65:30:5 nominal composition, respectively, were prepared in an arc-melting furnace under argon
atmosphere (13 × 10−5 bar). Pt-Sn-W and Pt-Sn basic atomic
compositions was evaluated by EDX microanalyses.
The electrochemical activity of the materials was
examined in 0.2 mol L-1 C
2H5OH + 0.5 mol L
-1H 2SO4
solutions by cyclic voltammetry and chronoamperometry in a thermostated three-electrode cell. The electrochemical measurements were performed on a PC controlled VoltaLab Potentiostat PGZ 420 Electrochemical Interface. A Reversible Hydrogen Electrode (RHE) and vitreous carbon were used as reference and counter electrode, respectively. The active surface area of the electrodes was estimated from the integration of the hydrogen adsorption/desorption
region of a cyclic voltammogram recorded at 50 mV s-1 in
supporting electrolyte.
Spectroelectrochemical investigations was carried out in a Fourier transform IR spectrometer Bruker IFS 66v, with the sample compartment modified to allow the beam to be reflected on the electrode surface with an incidence
angle of 65°, after passing through the IR window (CaF2)
of a conventional thin layer spectroelectrochemical cell.
The beam path was under vacuum and a liquid N2 cooled
HgCdTe detector (Infrared Associates) was used.
Using the Single Potential Alteration Infrared
Reflectance Spectroscopy (SPAIRS) technique,15,17,19
reflectivities were recorded at 50 mV intervals during
the first voltammetric scan at a sweep rate of 1 mV s−1.
Each spectrum resulted from the co-addition of 128 interferograms. Data acquisition required 20 s, over 20 mV.
Spectra were calculated as –$A = $R/R = (RE − RERef)/RERef
where the “reference” spectrum, RERef, was that recorded
at the initial potential of 50 mV vs. RHE. Similarly,
using the Subtractively Normalized Interfacial Fourier Transform Infrared Reflectance Spectroscopy (SNIFTIRS)
method,19,20,22,25 reflectivities were obtained at two
electrode potentials E1 and E2 (the frequency of potential
modulation was 25 mHz and 128 interferograms were collected before the Fourier transform) and co-added 30 times at each potential. Final spectra were normalized as
–$A = $R/R = (RE2 − RE1)/RE1. For the SNIFTIRS and
SPAIRS calculations, if E2 > E1 or E > ERef so that, a positive absorption band indicates the consumption of species and a negative absorption band means the production of species. Both techniques allowed the detection of adsorbed species and reaction products at the electrode surface.
Results and Discussion
Physicochemical characterization of the catalysts
The scanning electron micrographs in Figure 1(A) show that the Pt-Sn alloy does not exhibit phase segregation.
However, pores of ca. 35 Mm (black spots) due to gas
observed. On the other hand, the alloy Pt-Sn-W presents two distinct segregated regions (Figure 1(B)). The basic atomic compositions of Pt-Sn and Pt-Sn-W were evaluated by energy-dispersive X-ray microanalyses and the results are summarized in Table 1. The average atomic composition of both alloys is close to the expected values. EDX microanalyses performed on several areas of polished samples showed that Pt-Sn has a homogeneous composition while the Pt-Sn-W exhibits in region (1) of Figure 1(B) a composition of Pt-Sn (66:34) while the composition of region (2) of Figure 1(B) is Pt-Sn-W (40-20-40). The segregated region rich in W corresponds to 10 % of the sample surface with many pores of distinct sizes.
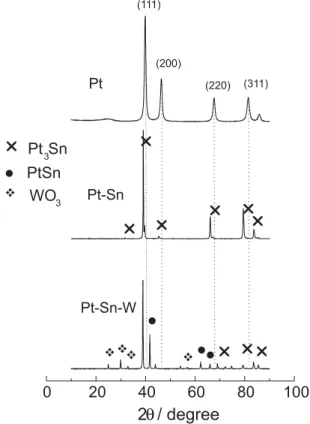
XRD patterns for the binary Pt-Sn and ternary Pt-Sn-W catalysts are depicted in Figure 2. For comparison reason the XRD pattern for pure Pt was included in Figure 2. As can be seen, the main characteristic peaks of face-centred cubic (fcc) crystalline Pt (spatial group Fm-3m) appear
in all XRD patterns with a shift to lower 2Q angle in
reflections planes (111), (200), (220) and (311) for Pt-Sn and Pt-Sn-W alloys due to Sn presence in the Pt structure. Figure 2 shows also that the binary Pt-Sn alloy presents the
characteristic peaks attributed to cubic Pt3Sn (spatial group
Pm-3m) which is the predominant intermetallic phase. Additionally, a clear evidence for the formation of a Pt-Sn intermetallic phase is noticeable on Pt-Sn-W. Finally, the
formation of WO3 on Pt-Sn-W is detected as small peaks
at 25°, 30° and 33°.
Electrochemical characterization of the catalysts
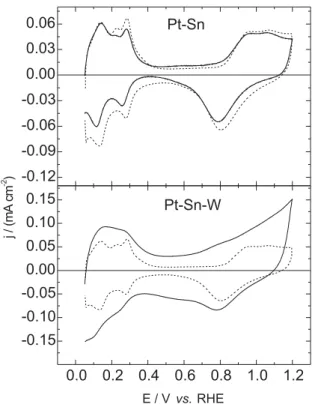
Cyclic voltammogram profiles for Pt-Sn and Pt-Sn-W
alloy electrodes in acid solution (0.5 mol L-1 H
2SO4) are
presented in Figure 3. Voltammogram for Pt-Sn electrode exhibits a very similar profile of the Pt electrode. The adsorption-desorption hydrogen regions are only due to the contribution of the Pt metal in the catalyst. Cyclic voltammogram for Pt-Sn-W electrode shows a Pt distorted shape with roundish peaks. This is mainly due to the
presence of tungsten oxide (WO3) formed during the
Figure 1. Scanning electron micrographs of (A) Pt-Sn and (B) Pt-Sn-W alloys.
Figure 2. XRD diffractograms of Pt-Sn and Pt-Sn-W alloys. Table 1. EDX results of the bulk composition of Pt-Sn and Pt-Sn-W
alloys
Catalysts Atomic composition
Nominal (%) Experimental (%)
Pt-Sn 80:20 79:21
catalyst preparation process. The estimation of the Pt surface area of the electrodes was done using the charge of hydrogen desorption peak. This procedure allows the comparison of the current density on different electrodes compositions.
Electrochemical oxidation of ethanol
Positive scan voltammetric curves in the presence of ethanol are showed in Figure 4. Ethanol electrooxidation
starts at ca. 200 mV earlier for Pt-Sn-W in comparison to
a pure Pt electrode, as can be seen in Figure 4. Hydrogen adsorption/desorption peaks are clearly suppressed because the ethanol adsorption replaces the adsorbed hydrogen from the interface. On the other hand, the current for Pt-Sn is slightly smaller than the observed current for pure Pt. As pointed out by several papers in the literature, the presence of Sn in the catalyst can promote ethanol oxidation by either an electronic effect in the Pt-based electrode material or by activation of the interfacial water molecule necessary to complete the oxidation of adsorbed reaction intermediates leading to carbon dioxide, in the situation that the C–C bond
was broken, or the formation of acetic acid.9,40 Specially, at
low potentials, from 250 to 450 mV vs. RHE, the presence
of Sn and W leads to an increase in the catalyst activity by reaching higher current densities, as shown in Figure 4.
In fact the introduction of W in the Pt-Sn leads to a significant increase in the electroactivity for the ternary alloy as compared to pure Pt. The synergistic effect obtained with the presence of Sn and W can be interpreted by the activation of interfacial water molecules at lower potentials than that observed for pure Pt. The bifunctional mechanism suggests, in this specific case, which oxygenated species on Sn assisted by W, allows the removal of the reaction
intermediates such as CHx and CO at lower potentials.41
Nevertheless, the current density for Pt-Sn electrode material is smaller than the observed for pure Pt indicating that Pt-Sn appears less active than Pt. These results are not in agreement with those from steady-state experiments (Figure 5) which showed the highest current densities
for Pt-Sn compared to Pt at 400 mVvs. RHE. This fact
can be resulted from an unsuitable normalization or a surface poisoning due to the presence of Sn which is more noticeable in steady-state experiments.
However, the positive effect of the addition of W to Pt-Sn is obvious on the plot of the ratio of the current densities (see inset in Figure 4); This enhancement factor due to the presence of W goes through a maximum and it clearly appears that Pt-Sn-W is more active than Pt and Pt-Sn in a potential range (0.5-0.7 V) where Pt is an efficient electrocatalyst.
Chronoamperometry is a more adequate way to evaluate the electrocatalytic performance of the electrodes for ethanol oxidation at low potentials and under long-term operation condition. Thus, Figure 5 shows the chronoamperograms recorded for Pt, Pt-Sn and Pt-Sn-W
at 400 mV vs. RHE. At this potential, the current densities
Figure 3. Voltammetric profiles of Pt-Sn and Pt-Sn-W catalysts in 0.5 mol L-1 H
2SO4 solution recorded at a scan rate of 50 mV s
-1. Continuous line: alloy, dashed line: Pt.
Figure 4. Anodic sweep curves of Pt, Pt-Sn and Pt-Sn-W catalysts in 0.5 mol L-1 H
2SO4 + 0.2 mol L -1 C
reach a quasi-steady-state condition for all Pt-based studied electrodes. Additionally, Pt-Sn-W presents the highest current density and Pt-Sn shows much better performance than pure Pt. These results confirm that Pt-Sn-W is the best catalyst when compared to Pt-Sn and pure Pt.
For long-term operation, Pt-Sn and Pt-Sn-W electrodes show quite stable currents for ethanol oxidation after 25 min while the current for Pt-alone catalyst drops toward zero current at the beginning of the polarization. The origin of the immediate decay of the current for pure Pt can be associated to the significant accumulation of reaction intermediates that acts as surface poisoning species.
In situ spectroelectrochemical study of ethanol oxidation
To obtain further information about reaction intermediates and reactions products formed during ethanol
oxidation on Pt-Sn and Pt-Sn-W electrodes, in situ infrared
reflectance spectroscopy was used employing SPAIRS and
SNIFTIRS techniques in 0.5 mol L-1 H
2SO4 + 0.2 mol L
-1
C2H5OH solution.
Figure 6 shows the SPAIR spectra for Pt-Sn and Pt-Sn-W
in the spectral range of wave numbers of 1,000-3,000 cm-1
and for potentials between 50 and 800 mV vs. RHE. These
spectra were accumulated every 50 mV during the first
voltammetric cycle run at 1 mV s1. The reference reflectivity
used for the calculation of $R/R was taken at 50 mV vs.
RHE. The main bands observed for both electrodes are
attributed to the presence of interfacial water at 1,640 cm–1
and the band at ca. 1,725 cm1 is ascribed to the stretching
mode of the carbonyl group (C=O) indicative of acetic acid and/or acetaldehyde produced from the ethanol oxidation
reaction. A band at 2,435 cm1, attributed to CO
2formation
is observed in potentials higher than 450 mV vs. RHE for
both Pt-based electrodes. At around 2,050 cm1 it is possible
to observe a small band due to the presence of adsorbed CO on the surface. The presence of this band is clearly observed
by SNIFTIRS (see Figure 8). Finally, the band at 1,290 cm1
is attributed to the vibration of acetic acid in the thin layer. Although the main desired reaction product formed in the
complete oxidation of ethanol is the CO2, the most intense
band observed in the SPAIR spectra of Figure 6 appears at
1,725 cm1, that is attributed to the presence of acetic acid
and/or acetaldehyde. The bands for CO2, acetaldehyde and/or
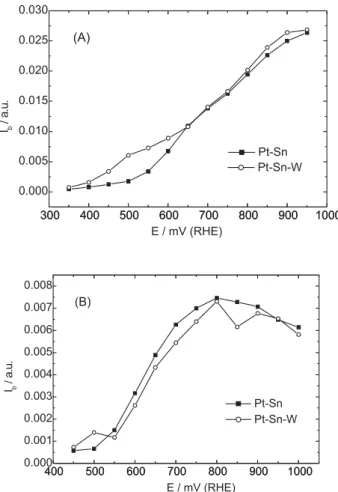
acetic acid for Pt-Sn and Pt-Sn-W catalysts exhibit different intensities. In general, Pt-Sn displays the most intense relative bands for these species (see Figure 7(A) and (B)). These figures show the representative curves of the relative
normalized intensities of IR bands for CO2 and acetaldehyde
and/or acetic acid obtained from SPAIRS as a function of the electrode potential. It can be observed that the onset potential
for both electrodes is about the same for CO2, acetaldehyde
and/or acetic acid formation. The CO2 formation reaches a
maximum value at ca. 750 mV vs. RHE, (see Figure 7(B))
and diminishes slightly up to 1,000 mV vs. RHE. At low
potentials, the presence of W increases the formation of
products (CO2, CH3COOH/CH3CHO) compared to Pt-Sn.
The amount of acetaldehyde and/or acetic acid formed keep growing with the increase of the potential (Figure 7(A)). This is mainly due to the accumulation of these species in the thin
layer between the electrode surface and the CaF2 window.
The presence of many different bands in the spectra is clear evidence that during the ethanol oxidation, several different reaction steps are involved, as reported
elsewhere.24,42
Figure 5. Potentiostatic oxidation of ethanol on Pt, Pt-Sn and Pt-Sn-W electrodes during 30 minutes at 400 mV vs. RHE. Solution: 0.5 mol L-1 H2SO4 + 0.2 mol L-1 C
2H5OH. Inset: Chronoamperometric curve for Pt pure electrode.
Figure 6. SPAIR spectra of the species resulting from the oxidation of ethanol in 0.5 mol L-1 H
2SO4 + 0.2 mol L -1 C
The band at 2,050 cm-1 (CO
L) is hardly observed by
SPAIRS technique conversely to the SNIFTIRS. Figure 8 shows the SNIFTIR spectra recorded in the potential range from 50 to 750 mV at constant potential modulation
of 200 mV. The COL band appears as a bipolar band at
ca.2,050 cm1. This band appears clearly at the first potential
modulation, showing that the initial ethanol adsorption step is dissociative. The intensity of this band increases up to 200-400 mV modulation and decreases until the modulation of 400-600 mV. This last potential (400 mV) is sufficiently
high to start the CO2 formation. Pt-Sn-W presents a lowest
oxidation potential to oxidize CO to CO2 when compared to
Pt-Sn. This behavior corroborates with the easy removal of adsorbed CO by its oxidation on Pt-Sn-W. This last catalyst appears to be more efficient to activate the interfacial water at lower potentials than Pt-Sn and both W and Sn are more oxophylic than Pt. Conversely, a band which corresponds
to the final reaction product, CO2, can be observed at
2,345 cm−1. Although it is less intense than that for carbon
monoxide, CO2 appears at a potential of 450 mV vs. RHE
on both electrodes. From this behavior it can be inferred that
CO2 production is not only due to adsorbed CO oxidation,
once the decrease in the COads band is not proportional to the
increase in the CO2 band, suggesting that the formation of
carbon dioxide is also due to acetaldehyde oxidation. This behavior can be explained by the bifunctional mechanism that occurs on these electrode surfaces at potentials lower than those for Pt alone.
As pointed out above, CH3CHO, CH3COOH and
CO2 were the different products detected by reflectance
spectroscopy on Pt-Sn and Pt-Sn-W catalysts. Adsorbed CO was also detected spectroscopically. In agreement with these results a general parallel pathway mechanism for ethanol electrooxidation can be proposed as shown in Scheme 1. First of all, it can be assumed that ethanol
adsorbs at the Pt surface followed by the A-C-H dissociation
(CH3CHOHads). Part of this adsorbed ethanol can be
dissociated by suffering the C–C bond cleavage forming
adsorbed linear CO and adsorbed CHx. The other part of
the adsorbed ethanol, can lead to the formation of adsorbed acetaldehyde. This path is apparently the simplest reaction step, which justifies the large amount of acetaldehyde found in band intensity of Figure 7(A). Part of the acetaldehyde can stay adsorbed in the electrode surface, part can desorbs in the solution and part can be oxidized to carbon dioxide.
CO2 formation continues in potentials up to 1,000 mV vs.
RHE, as suggested by Figure 7(B). This is an evidence that
acetaldehyde can oxidize to CO2 at high potentials. The
adsorbed acetaldehyde reacts with adsorbed oxygenated species to generate acetic acid as inferred in Figure 6. The adsorbed oxygenated species provide the O atom necessary to transform acetaldehyde in acid. This step occurs by a bifunctional mechanism and involves in total four-electron conversion pathway. Acetic acid formation is not useful for the overall process since it limits the total ethanol oxidation
towards CO2. The adsorbed CO and adsorbed CHx species
Figure 7. Band intensities of carbonyl (A) and CO2 (B) (Ib Pt-Sn = 3× Ib Pt-Sn-W). IR Band intensities obtained from SPAIR spectra of Figure 6.
Figure 8. SNIFTIR spectra of the species formed during the ethanol oxidation in 0.5 mol L-1 H
2SO4 + 0.2 mol L -1 C
can react with adsorbed oxygenated species to form CO2. As can be seen in Figure 8, the adsorbed CO is no longer present in the catalyst surface at potentials higher than 450 mV. It is generally accepted that the CO oxidation on Pt bimetallic catalysts occurs by a bifunctional reaction
mechanism43,44 and is described as a Langmuir-Hinshelwood
type reaction. It can be considered in our case, that adsorbed oxygenated species is interfacial activated water on Sn and/
or W surface atoms and CO and CHx are adsorbed only on
Pt. Experimental observations were supported by density functional theory (DFT) calculations which indicated that on bimetallic catalyst, CO is linked only to Pt atoms and not to the Sn atoms, whereas oxygenated species has an energetic preference for the Sn sites.
An ideal catalyst for ethanol oxidation would be the one that can result in the selective formation of
CH3CH(OH)ads species by the cleavage of C-H bonds
followed by the C-C bond cleavage and subsequent
oxidation of intermediates to CO2 in presence of adsorbed
oxygenated species.
Conclusions
Pt-Sn and Pt-Sn-W catalysts studied here display electrocatalytic activity with respect to ethanol oxidation as evidenced by voltammetric and chronoamperometric measurements. Although ethanol oxidation involves theoretically 12 electrons per ethanol molecule when
totally oxidized to CO2, the obtained results showed that
its electrocatalytical oxidation on Pt-Sn and Pt-Sn-W catalysts led mainly to acetaldehyde and acetic acid. Adsorbed intermediates such as CO and reaction product
as CO2 were also observed by in situ infrared reflectance
spectroscopy. The presence of the last species suggests a cleavage of the C-C bond, which occurred during ethanol oxidation on the Pt-Sn and Pt-Sn-W catalysts. Pt-Sn-W alloy is electrochemically more active than Pt-Sn for ethanol oxidation. A general simplified scheme for ethanol electrooxidation was proposed based in the experimental results found here, and it was possible to affirm that the presence of tin and tungsten is necessary to activate the catalysts when comparing to Pt alone.
Scheme 1. Simplified parallel pathway mechanism for ethanol oxidation.
Acknowledgments
This work was mainly conducted within the framework of a collaborative programme CAPES/COFECUB under grant No. 498/05. GTF also acknowledges FAPESP and CNPq, Brazil.
References
1. Cosmi, C.; Macchiato M.; Mangiamele L.; Marmo G.; Pietrapertos F.; Salvia M.; Energy Policy 2003,31, 443. 2. Wachsmann, U.; Tolmasquim, M. T.; Renew Energy2003,28,
1029.
3. Muhida, R.; Park, M.; Dakkak, M.; Matsuura, K.; Tsuyosh, A.; Michira, M.; Sol. Energy Mater. Sol. Cells2003,75, 697. 4. Léger, J-M.; J. Appl. Electrochem. 2001,31, 767.
5. Vigier, F.; Coutanceau, C.; Hahn, F.; Belgsir, E.M.; Lamy, C.; J. Electroanal. Chem.2004,563, 81.
6. Caillard, A.; Coutanceau, C.; Brault, P.; Mathias, J.; Léger, J-M.; J. Power Sources 2006,162, 66.
7. Lamy, C.; Belgsir, E.M.; Léger, J-M.; J. Appl. Electrochem. 2001,31, 799.
8. Maillard, F.; Gloaguen, F.; Hahn, F.; Léger, J-M.; Fuel Cells 2002,2, 143.
9. Rousseau, S.; Coutanceau, C.; Lamy, C.; Léger, J-M.; J. Power Sources 2006,158, 18.
10. Willsau, J.; Heitbaum, J.; J. Electroanal. Chem.1985,27, 194. 11. Bittins-Cattaneo, B.; Wilhelm, S.; Cattano, E.; Buschmann,
H.W.; Vielstich, W.; Ber. Bunsenges. Phys. Chem. 1988,92, 1210.
12. Iwasita, T.; Pastor, E.; Electrochim. Acta1994,39, 531. 13. Schmiemann, U.; Muller, U.; Baltruschat, H.; Electrochim. Acta
1995,40, 99.
14. Beden, B.; Lamy, C.; Bewick, A.; Kumimatsu, K.; J. Electroanal. Chem.1981,121, 343.
15. Leung, L-W.H.; Weaver, M.J.; J. Electroanal. Chem. 1988,240, 341.
16. Beden, B.; Lamy, C. InSpectroelectrochemistry, Theory and Practice; Gale, R. J., ed.; Plenum Press: New York,
1988, ch. 5.
18. Beden, B.; Léger, J-M.; Lamy, C. In Electrocatalytical Oxidation of Oxygenated Aliphatic Organic Compounds at Noble Metal
Electrodes; Bockris, J. O. M.; Conway, B. E.; White, R. E., eds.;
Modern Aspects of Electrochemistry, Plenum Press: New York, 1992, vol. 22, p. 97.
19. Iwasita, T.; Nart, F. C.; Gerischer H.; Tobias C.W., eds.; Advances in Electrochemical Science and Engineering,
Wiley-VCH: New York, 1997, vol. 4, p. 123.
20. Kabbabi, A.; Faure, R.; Durand, R.; Beden, B.; Hahn, F.; Léger, J-M.; Lamy, C.; J. Electroanal. Chem.1998,444, 41. 21. Sun, S. -G. In Electrocatalysis, Frontiers in Electrochemistry;
Lipkowski, J.; Ross, Ph. N., eds., Wiley-VCH: New York, 1998, p. 243.
22. Iwasita, T.; Hoster, H.; John-Anaker, A.; Lin, W.F.; Vielstich, W.; Langmuir2000,16, 522.
23. Rodriguez, J. L.; Pastor, E.; Xia, X. H.; Iwasita, T.; Langmuir 2000,16, 5479.
24. Iwasita, T.; Electrochim. Acta 2002,47, 3663.
25. Camara, G. A.; Iwasita, T.; J. Electroanal. Chem.2005,578, 315.
26. Silva-Chong, J.; Méndez, E.; Rodriguez, J. L.; Arévalo, M. C.; Pastor, E.; Electrochim. Acta2002,47, 1441.
27. Roth, C.; Martz, N.; Hahn, F., Léger, J. -M.; Lamy, C.; Fuess, H.;J. Electrochem. Soc.2002, 149, 433.
28. Shin, J.; Tornquist, W. J.; Korzeniewski, C.; Hoaglund, C. S.; Surf. Sci.1996,364, 122.
29. Watanabe, M.; Motoo, S.; J. Electroanal. Chem.1975, 60, 275.
30. Crown, A.; Moraes, I. R.; Wieckowski, A.; J. Electroanal. Chem.2001,500, 333.
31. Waszczuk, P.; Lu, C. -Q.; Wieckowski, A.; Lu, C.; Rice, C.; Masel, R. I.; Electrochim. Acta2002,47, 3637.
32. Kokoh, K. B., Hahn, F.; Belgsir, E. M; Lamy, C.; de Andrade, A. R.; Olivi, P.; Motheo, A. J.; Tremiliosi-Filho, G.; Electrochim. Acta2004,49, 2077.
33. Tremiliosi-Filho, G.; Kim, H.; Chrzanowski, W.; Wieckowski, A.; Grzybowska, B.; Kulesza, P.; J. Electroanal. Chem.2001, 467, 143.
34. Spendelow, J. S.; Lu, G. Q.; Kenis, P. J. A.; Wieckowski, A.; J. Electroanal. Chem.2004,568, 215.
35. Roth, C.; Papworth, A. J.; Hussain, I.; Nichols, R. J.; Schiffrin, D. J.; J. Electroanal. Chem.2005,581, 79.
36. Frelink, T.; Vissche, W.; Van Veen, J. A. R.; Langmuir1996, 12, 3702.
37. Lu, C.; Rice, C.; Masel, M.; Babu, P. K.; Waszczuk, P.; Kim, H. S.; Oldfield, E.; Wieckowski, A.; J. Phys. Chem. B2002,106, 958.
38. Liu, R.; Iddir, H.; Fan, Q.; Hou, G.; Bo, A.; Ley, K. L.; Smotkin, E. S.; Sung, Y. -E.; Kim, H.; Thomas, S.; Wieckowski, A.; J. Phys. Chem. B2000,104, 3518.
39. Souza, J. P. I.; Rabelo, F. J. B.; de Moraes, I. R.; Nart, F. C.; J. Electroanal. Chem.1997,420, 17.
40. Simões, F. C.; dos Anjos, D. M.; Vigier, F.; Léger, J. -M.; Hahn, F.; Coutanceau, C.; Gonzalez, E. R.; Tremiliosi-Filho, G.; de Andrade, A. R.; Olivi, P.; Kokoh, K. B.; J. Power Sources 2007, 167, 1.
41. dos Anjos, D. M.; Hahn, F.; Léger, J. -M.; Kokoh, K. B.; Tremiliosi-Filho, G.; J. Solid State Electrochem.2007, 11, 1567.
42. Léger, J. -M.; Rousseau, S.; Coutanceau, C.; Hahn, F.; Lamy, C.;Electrochim. Acta2005,50, 5118.
43. Shubina, T. E.; Koper, T. M.; Electrochim. Acta2002,30, 3621.
44. Léger, J. -M.; Hahn, F. In In Situ Spectroscopic Studies of Adsorption at the Electrode and Electrocatalysis; Sun, S. G.; Christensen, P. A.; Wieckowski, A., eds., Elsevier Science: Amsterdan, 2007, vol. 3.
Received: October 1, 2007
Web Release Date: May 8, 2008