SPATIAL AND TEMPORAL DISTRIBUTION PATTERNS OF LARVAL SCIAENIDS IN
THE ESTUARINE SYSTEM AND ADJACENT CONTINENTAL SHELF OFF SANTOS,
SOUTHEASTERN BRAZIL
Renata Roque Porcaro, Maria de Lourdes Zani-Teixeira*, Mario Katsuragawa, Cláudia Namiki, Márcio Hidekazu Ohkawara and Jana Menegassi del Favero
Instituto Oceanográfico da Universidade de São Paulo (Praça do Oceanográfico, 191, 05508-120 São Paulo, SP, Brasil)
*Corresponding author: [email protected]
http://dx.doi.org/10.1590/S1679-87592014067606202
A
B S T R A C TBased on data collected during the project "The influence of the Santos-São Vicente estuarine system on the ecosystem of the adjacent continental shelf" (ECOSAN), from Nov/2004 to Mar/2006, the space-temporal distribution pattern of Sciaenidae larvae in relation to biotic and abiotic factors was investigated. Bongo net was used for sampling, aboard the R/V "Prof. W. Besnard" on the shelf, and the boats "Veliger II" and "Albacora" in the estuarine region. Twelve taxa were identified: Bairdiella ronchus, Ctenosciaena gracilicirrhus, Cynoscionspp., Isopisthus parvipinnis, Macrodon atricauda, Micropogonias furnieri, Menticirrhus spp., Nebris microps, Ophioscion punctatissimus, Paralonchurus brasiliensis, Stellifer rastrifer and Stellifer spp. Sciaenidae larvae were widespread on
the continental shelf in both campaigns (frequency of occurrence >80%). They were most abundant in Mar/2006 (mean = 6.47 larvae.m-2; sd = 8.36) and least abundant in Sep/2005 (mean = 2.37
larvae.m-2; sd = 3.33). The average abundance in the estuarine region ranged from 0.12 larvae.m-2 (sd
= 0.11) in Jun/2005 to 4.28 larvae.m-2 (sd = 1.99) in Nov/2004. Frequency of occurrence
minimum occurred in Aug/2005 (50%) and the maximum in Nov/2004 (100%). The presence of Sciaenidae larvae in most locations and periods suggests that the reproductive process of this family in the region is continuous, spawning being more intense in the warmer months.
R
E S U M OBaseando-se em dados coletados durante o projeto "A Influência do Complexo Estuarino da Baixada Santista sobre o Ecossistema da Plataforma Continental Adjacente" (ECOSAN), nov/2004 - mar/2006, foram investigados os padrões de distribuição espaço-temporal das larvas de Sciaenidae relacionando-os com fatores bióticos e abióticos. A rede bongô foi utilizada como amostrador do ictioplâncton, a bordo de três embarcações: o N/Oc "Prof. W. Besnard" na plataforma, e os barcos "Veliger II" e "Albacora" na baía e canais. Doze táxons foram identificados: Bairdiella ronchus, Ctenosciaena gracilicirrhus, Cynoscion spp., Isopisthus parvipinnis, Macrodon atricauda, Micropogonias furnieri, Menticirrhus spp., Nebris microps, Ophioscion punctatissimus, Paralonchurus brasiliensis, Stellifer rastrifer and Stelliferspp. Na plataforma continental as larvas de cienídeos tiveram ampla distribuição nas duas campanhas (frequência de ocorrência > 80%), sendo mais abundantes em mar/2006 (6,47±8,36 larvas.m-2) e menos abundantes em set/2005 (2,37±3,33
larvas.m-2). No estuário, a abundância média das larvas de cienídeos variou entre 0,12±0,11
larvas.m-2 (jun/2005) e 4,28±1,99 larvas.m-2 (nov/2004); a frequência de ocorrência foi mínima em
ago/2005 (50%) e máxima em nov/2004 (100%). A presença das larvas na maioria das estações de coleta do sistema estuarino de Santos e plataforma continental adjacente sugere uma atividade reprodutiva contínua, com desova mais intensa nos meses mais quentes.
Descriptors: Sciaenidae, Ichthyoplankton, Abundance, Environmental variables. Descritores: Sciaenidae, Ictioplâncton, Abundância, Variáveis ambientais.
I
NTRODUCTIONSciaenidae is a large family of about 70 genera and 270 species. They inhabit marine, brackish, and freshwater areas of the Atlantic, Indian, and
of them being important fishery resources. On the inner shelf of South and Southeastern Brazil the
species Micropogonias furnieri (Desmarest, 1823),
Macrodon atricauda (Günther, 1880), Cynoscion guatucupa (Cuvier, 1830), Cynoscion jamaicensis
(Vaillant & Bocourt, 1883), and Menticirrhus
americanus (Linnaeus, 1758) are among those most exploited by commercial fisheries (VALENTINI; PEZZUTO, 2006).
Many fishery resources, including some sciaenids, spawn in the ocean and the early stages are transported to estuaries, where the larvae may find a suitable environment for their survival and growth (GODEFROID et al., 1999; COSTA; ARAÚJO, 2003).
Larval fish usually are planktonic and they are in general morphologically very distinct from the corresponding adults. The transformation takes place gradually until they settle down in the adult environment. The knowledge of this process is important in enabling us to understand the population dynamics of fishes, as the size of adult stocks depends directly on their success in surviving during the early developmental stages (HANNA, 1998). The distribution of larval fish is heterogeneous and can vary in time and space, depending mainly on the fishes’ reproductive strategies, including the place, time and type of spawning, adult abundance, the duration of the early stages, larval behavior and the presence of potential predators and prey, among other factors (NORCROSS; SHAW, 1984; LEIS, 1991; SASSA et al., 2004). The larval distribution is also influenced by climate and hydrographic events such as currents, winds, vortexes and the upwelling and stratification of the water column (DENMAN; POWELL, 1984; NORCROSS; SHAW, 1984).
Although the coastal area of the present study is known to be heavily impacted by human activities such as industrialization, port activities and urbanization (CETESB, 2001), the bay and the estuary in the Santos region interact with each other and form an environment recognized as an important nursery area for fish, crustaceans and molluscs (SCHAEFFER-NOVELLI; CINTRON, 1986). High diversity and abundance of fish have been observed in this region (PAIVA FILHO et al., 1987) and the sciaenids have been described as one of most important groups (PAIVA FILHO; SCHMIEGELOW, 1986). In the Santos Bay, Schmidt and Dias (2012) sampled 21 species of Sciaenidae, with Stellifer rastrifer (Jordan,
1889) representing 70.4% of the total composition. Previous studies on the early life history of the sciaenids off Southern and Southeastern Brazil include those by Matsuura and Nakatani (1979) who
described the development of larval Umbrina coroides
Cuvier, 1830 near Anchieta island; Sinque (1980) who studied the larval and juvenile development of
Cynoscion leiarchus (Cuvier, 1830), Menticirrhus americanus, Micropogonias furnieri, Stellifer rastrifer, Macrodon ancylodon (Bloch & Schneider,
1801) and Isopisthus parvipinnis (Cuvier, 1830) in the Cananéia-Iguape estuary; Katsuragawa et al. (1993) who described the larval distribution of Menticirrhus americanus at Ubatuba; Godefroid et al. (2001) who
described the larval and juvenile occurrence of
Menticirrhus americanus, Menticirrhus littoralis
(Holbrook, 1847), Umbrina coroides and
Micropogonias furnieri in the Pontal do Sul region;
Bruno and Muelbert (2002; 2009) who investigated the distribution and abundance patterns of eggs and larvae of Micropogonias furnieri in the Patos lagoon,
and Itagaki et al. (2007) who described the larval and juvenile development of Bairdiella ronchus (Cuvier,
1830) in the Cananéia-Iguape estuary. However, no studies on early sciaenids have been undertaken in the estuarine and coastal area around Santos.
Therefore, the present work analyzed the spatial and temporal distribution patterns of the Sciaenidae larvae and evaluated the influence of abiotic and biotic factors in the Santos estuarine system and on the adjacent continental shelf. We also discuss the importance of the study area to early life stages of some Sciaenidae species.
M
ATERIAL ANDM
ETHODSStudy Area and Sampling Techniques
The Baixada Santista, located on the central coast of São Paulo state - Brazil, covers the São Vicente and Santos estuarine system, the Santos Bay and the adjacent Continental Shelf (CETESB, 2001). The Santos Bay has a fundamental role in the dilution of materials from the channels of Santos and São Vicente, including those from the submarine emissary
(PIRES-VANIN et al., 2008). The Bertioga channel is
an environment whose margins are better preserved than those of the Santos and São Vicente channels, even though the first is subject to habitat destruction as a result of urban occupation and the pollution that reaches its shores (PIRES-VANIN et al., 2008). The
Atlantic Central Water (SACW) (MIRANDA; KATSURAGAWA, 1991; CASTRO et al., 2006).
Samples were collected during research cruises of the project “The influence of the Santos-São Vicente estuarine system on the ecosystem of the adjacent continental shelf” (ECOSAN), by the Oceanographic Institute of São Paulo University (IOUSP). In three localities in the Santos - São Vicente estuarine system (Santos Bay, Port Channel and Bertioga Channel) the cruises were conducted monthly at 12 oceanographic stations from November
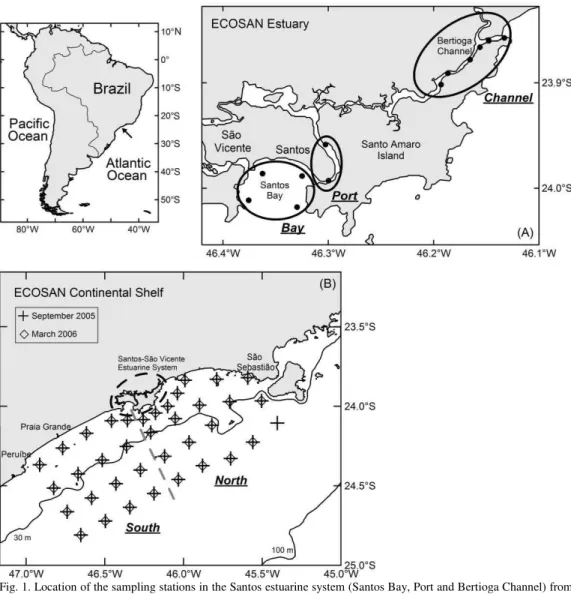
2004 to March 2006; on the adjacent continental shelf (North and South areas) out to the 50 m isobath sampling plan included 37 and 36 oceanographic stations, respectively in September/2005 and March/2006 (Fig. 1). Oceanographic cruises were carried out by the R/V "Prof. W. Besnard" on the continental shelf, and the boats "Veliger II" and "Albacora" in the bay and channels. Summary information of each sampling station is presented in Tables 1 and 2.
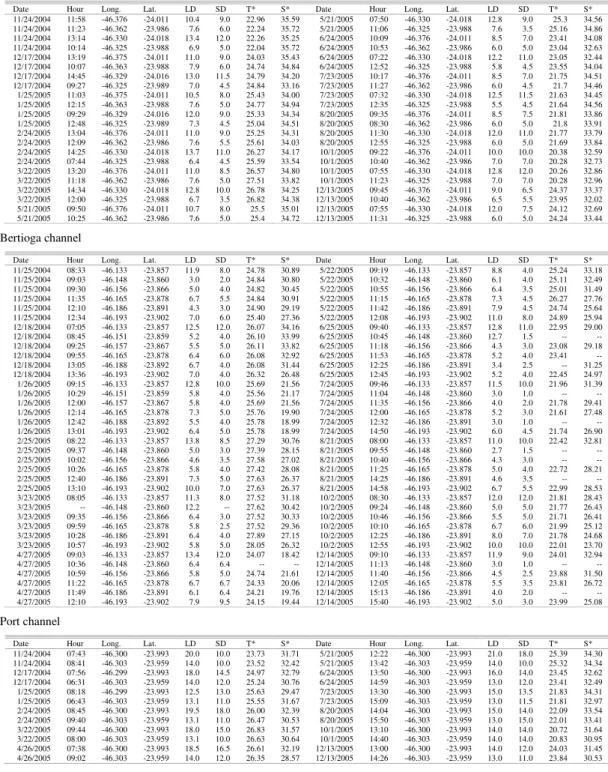
Table 1. Data of sampling stations carried out in Santos bay, Bertioga channel and Port channel in Santos-São Vicente estuarine system, Brazil, from November 2004 to December 2005 (LD - Local Depth (m); SD - Sampler Depth (m); T – Temperature; S - Salinity obtained at maximum depth of 5 m).
Santos bay
Date Hour Long. Lat. LD SD T* S* Date Hour Long. Lat. LD SD T* S* 11/24/2004 11:58 -46.376 -24.011 10.4 9.0 22.96 35.59 5/21/2005 07:50 -46.330 -24.018 12.8 9.0 25.3 34.56 11/24/2004 11:23 -46.362 -23.986 7.6 6.0 22.24 35.72 5/21/2005 11:06 -46.325 -23.988 7.6 3.5 25.16 34.86 11/24/2004 13:14 -46.330 -24.018 13.4 12.0 22.26 35.25 6/24/2005 10:09 -46.376 -24.011 8.5 7.0 23.41 34.08 11/24/2004 10:14 -46.325 -23.988 6.9 5.0 22.04 35.72 6/24/2005 10:53 -46.362 -23.986 6.0 5.0 23.04 32.63 12/17/2004 13:19 -46.375 -24.011 11.0 9.0 24.03 35.43 6/24/2005 07:22 -46.330 -24.018 12.2 11.0 23.05 32.44 12/17/2004 10:07 -46.363 -23.988 7.9 6.0 24.74 34.84 6/24/2005 12:52 -46.325 -23.988 5.8 4.5 23.55 34.04 12/17/2004 14:45 -46.329 -24.016 13.0 11.5 24.79 34.20 7/23/2005 10:17 -46.376 -24.011 8.5 7.0 21.75 34.51 12/17/2004 09:27 -46.325 -23.989 7.0 4.5 24.84 33.16 7/23/2005 11:27 -46.362 -23.986 6.0 4.5 21.7 34.46 1/25/2005 11:03 -46.375 -24.011 10.5 8.0 25.43 34.00 7/23/2005 07:32 -46.330 -24.018 12.5 11.5 21.63 34.45 1/25/2005 12:15 -46.363 -23.988 7.6 5.0 24.77 34.94 7/23/2005 12:35 -46.325 -23.988 5.5 4.5 21.64 34.56 1/25/2005 09:29 -46.329 -24.016 12.0 9.0 25.33 34.34 8/20/2005 09:35 -46.376 -24.011 8.5 7.5 21.81 33.86 1/25/2005 12:48 -46.325 -23.989 7.3 4.5 25.04 34.51 8/20/2005 08:30 -46.362 -23.986 6.0 5.0 21.8 33.91 2/24/2005 13:04 -46.376 -24.011 11.0 9.0 25.25 34.31 8/20/2005 11:30 -46.330 -24.018 12.0 11.0 21.77 33.79 2/24/2005 12:09 -46.362 -23.986 7.6 5.5 25.61 34.03 8/20/2005 12:55 -46.325 -23.988 6.0 5.0 21.69 33.84 2/24/2005 14:25 -46.330 -24.018 13.7 11.0 26.27 34.17 10/1/2005 09:22 -46.376 -24.011 10.0 10.0 20.38 32.59 2/24/2005 07:44 -46.325 -23.988 6.4 4.5 25.59 33.54 10/1/2005 10:40 -46.362 -23.986 7.0 7.0 20.28 32.73 3/22/2005 13:20 -46.376 -24.011 11.0 8.5 26.57 34.80 10/1/2005 07:55 -46.330 -24.018 12.8 12.0 20.26 32.86 3/22/2005 11:18 -46.362 -23.986 7.6 5.0 27.51 33.82 10/1/2005 11:23 -46.325 -23.988 7.0 7.0 20.28 32.96 3/22/2005 14:34 -46.330 -24.018 12.8 10.0 26.78 34.25 12/13/2005 09:45 -46.376 -24.011 9.0 6.5 24.37 33.37 3/22/2005 12:00 -46.325 -23.988 6.7 3.5 26.82 34.38 12/13/2005 10:40 -46.362 -23.986 6.5 5.5 23.95 32.02 5/21/2005 09:50 -46.376 -24.011 10.7 8.0 25.5 35.01 12/13/2005 07:55 -46.330 -24.018 12.0 7.5 24.12 32.69 5/21/2005 10:25 -46.362 -23.986 7.6 5.0 25.4 34.72 12/13/2005 11:31 -46.325 -23.988 6.0 5.0 24.24 33.44
Bertioga channel
Date Hour Long. Lat. LD SD T* S* Date Hour Long. Lat. LD SD T* S* 11/25/2004 08:33 -46.133 -23.857 11.9 8.0 24.78 30.89 5/22/2005 09:19 -46.133 -23.857 8.8 4.0 25.24 33.18 11/25/2004 09:03 -46.148 -23.860 3.0 2.0 24.84 30.80 5/22/2005 10:32 -46.148 -23.860 6.1 4.0 25.11 32.49 11/25/2004 09:30 -46.156 -23.866 5.0 4.0 24.82 30.45 5/22/2005 10:55 -46.156 -23.866 6.4 3.5 25.01 31.49 11/25/2004 11:35 -46.165 -23.878 6.7 5.5 24.84 30.91 5/22/2005 11:15 -46.165 -23.878 7.3 4.5 26.27 27.76 11/25/2004 12:10 -46.186 -23.891 4.3 3.0 24.90 29.19 5/22/2005 11:42 -46.186 -23.891 7.9 4.5 24.74 25.64 11/25/2004 12:34 -46.193 -23.902 7.0 6.0 25.40 27.36 5/22/2005 12:08 -46.193 -23.902 11.0 8.0 24.89 25.94 12/18/2004 07:05 -46.133 -23.857 12.5 12.0 26.07 34.16 6/25/2005 09:40 -46.133 -23.857 12.8 11.0 22.95 29.00 12/18/2004 08:45 -46.151 -23.859 5.2 4.0 26.10 33.99 6/25/2005 10:45 -46.148 -23.860 12.7 1.5 -- -- 12/18/2004 09:25 -46.157 -23.867 5.5 5.0 26.11 33.82 6/25/2005 11:18 -46.156 -23.866 4.3 3.0 23.08 29.18 12/18/2004 09:55 -46.165 -23.878 6.4 6.0 26.08 32.92 6/25/2005 11:53 -46.165 -23.878 5.2 4.0 23.41 -- 12/18/2004 13:05 -46.188 -23.892 6.7 4.0 26.08 31.44 6/25/2005 12:25 -46.186 -23.891 3.4 2.5 -- 31.25 12/18/2004 13:36 -46.193 -23.902 7.0 4.0 26.32 26.48 6/25/2005 12:45 -46.193 -23.902 5.2 4.0 22.45 24.97 1/26/2005 09:15 -46.133 -23.857 12.8 10.0 25.69 21.56 7/24/2005 09:46 -46.133 -23.857 11.5 10.0 21.96 31.39 1/26/2005 10:29 -46.151 -23.859 5.8 4.0 25.56 21.17 7/24/2005 11:04 -46.148 -23.860 3.0 1.0 -- -- 1/26/2005 12:00 -46.157 -23.867 5.8 4.0 25.69 21.56 7/24/2005 11:35 -46.156 -23.866 4.0 2.0 21.78 29.41 1/26/2005 12:14 -46.165 -23.878 7.3 5.0 25.76 19.90 7/24/2005 12:00 -46.165 -23.878 5.2 3.0 21.61 27.48 1/26/2005 12:42 -46.188 -23.892 5.5 4.0 25.78 18.99 7/24/2005 12:32 -46.186 -23.891 3.0 1.0 -- -- 1/26/2005 13:01 -46.193 -23.902 6.4 5.0 25.78 18.99 7/24/2005 14:50 -46.193 -23.902 6.0 4.5 21.74 26.90 2/25/2005 08:22 -46.133 -23.857 13.8 8.5 27.29 30.76 8/21/2005 08:00 -46.133 -23.857 11.0 10.0 22.42 32.81 2/25/2005 09:37 -46.148 -23.860 5.0 3.0 27.39 28.15 8/21/2005 09:55 -46.148 -23.860 2.7 1.5 -- -- 2/25/2005 10:02 -46.156 -23.866 4.6 3.5 27.58 27.02 8/21/2005 10:40 -46.156 -23.866 4.3 3.0 -- -- 2/25/2005 10:26 -46.165 -23.878 5.8 4.0 27.42 28.08 8/21/2005 11:25 -46.165 -23.878 5.0 4.0 22.72 28.21 2/25/2005 12:40 -46.186 -23.891 7.3 5.0 27.63 26.37 8/21/2005 14:25 -46.186 -23.891 4.6 3.5 -- -- 2/25/2005 13:10 -46.193 -23.902 10.0 7.0 27.63 26.37 8/21/2005 14:58 -46.193 -23.902 6.7 5.5 22.99 28.53 3/23/2005 08:05 -46.133 -23.857 11.3 8.0 27.52 31.18 10/2/2005 08:30 -46.133 -23.857 12.0 12.0 21.81 28.43 3/23/2005 -- -46.148 -23.860 12.2 -- 27.62 30.42 10/2/2005 09:24 -46.148 -23.860 5.0 5.0 21.77 26.43 3/23/2005 09:35 -46.156 -23.866 6.4 3.0 27.52 30.33 10/2/2005 10:46 -46.156 -23.866 5.5 5.0 21.71 26.41 3/23/2005 09:59 -46.165 -23.878 5.8 2.5 27.52 29.36 10/2/2005 10:10 -46.165 -23.878 6.7 6.0 21.99 25.12 3/23/2005 10:28 -46.186 -23.891 6.4 4.0 27.89 27.15 10/2/2005 12:25 -46.186 -23.891 8.0 7.0 21.78 24.68 3/23/2005 10:57 -46.193 -23.902 5.8 5.0 28.05 26.32 10/2/2005 12:55 -46.193 -23.902 10.0 10.0 22.01 23.70 4/27/2005 09:03 -46.133 -23.857 13.4 12.0 24.07 18.42 12/14/2005 09:10 -46.133 -23.857 11.9 9.0 24.01 32.94 4/27/2005 10:36 -46.148 -23.860 6.4 6.4 -- -- 12/14/2005 11:13 -46.148 -23.860 3.0 1.0 -- -- 4/27/2005 10:59 -46.156 -23.866 5.8 5.0 24.74 21.61 12/14/2005 11:40 -46.156 -23.866 4.5 2.5 23.88 31.50 4/27/2005 11:22 -46.165 -23.878 6.7 6.7 24.33 20.06 12/14/2005 12:05 -46.165 -23.878 5.5 3.5 23.81 26.72 4/27/2005 11:49 -46.186 -23.891 6.1 6.4 24.21 19.76 12/14/2005 15:13 -46.186 -23.891 4.0 2.0 -- -- 4/27/2005 12:10 -46.193 -23.902 7.9 9.5 24.15 19.44 12/14/2005 15:40 -46.193 -23.902 5.0 3.0 23.99 25.08
Port channel
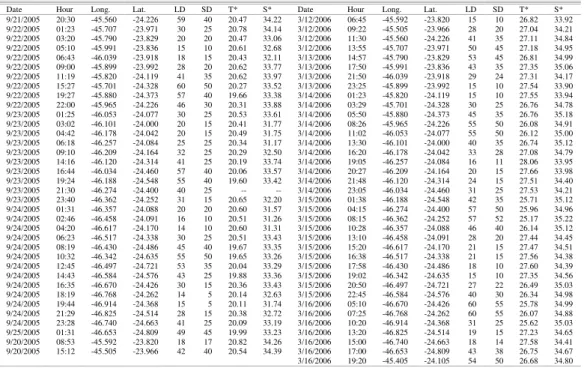
Table 2. Data of sampling stations of catches carried out on the continental shelf adjacent to the Santos-São Vicente estuarine system, Brazil, in September 2005 and March 2006 (LD - Local Depth (m); SD - Sampler Depth (m); T – Temperature; S - Salinity obtained at 5 m depth).
Date Hour Long. Lat. LD SD T* S* Date Hour Long. Lat. LD SD T* S* 9/21/2005 20:30 -45.560 -24.226 59 40 20.47 34.22 3/12/2006 06:45 -45.592 -23.820 15 10 26.82 33.92 9/22/2005 01:23 -45.707 -23.971 30 25 20.78 34.14 3/12/2006 09:22 -45.505 -23.966 28 20 27.04 34.21 9/22/2005 03:20 -45.790 -23.829 20 20 20.47 33.06 3/12/2006 11:30 -45.560 -24.226 41 35 27.11 34.84 9/22/2005 05:10 -45.991 -23.836 15 10 20.61 32.68 3/12/2006 13:55 -45.707 -23.971 50 45 27.18 34.95 9/22/2005 06:43 -46.039 -23.918 18 15 20.43 32.11 3/13/2006 14:57 -45.790 -23.829 53 45 26.81 34.99 9/22/2005 09:00 -45.899 -23.992 28 20 20.62 33.77 3/13/2006 17:50 -45.991 -23.836 43 35 27.35 35.06 9/22/2005 11:19 -45.820 -24.119 41 35 20.62 33.97 3/13/2006 21:50 -46.039 -23.918 29 24 27.31 34.17 9/22/2005 15:27 -45.701 -24.328 60 50 20.27 33.52 3/13/2006 23:25 -45.899 -23.992 15 10 27.54 33.90 9/22/2005 19:27 -45.880 -24.373 57 40 19.66 33.38 3/14/2006 01:23 -45.820 -24.119 15 10 27.55 33.94 9/22/2005 22:00 -45.965 -24.226 46 30 20.31 33.88 3/14/2006 03:29 -45.701 -24.328 30 25 26.76 34.78 9/23/2005 01:25 -46.053 -24.077 30 25 20.53 33.61 3/14/2006 05:50 -45.880 -24.373 45 35 26.76 35.18 9/23/2005 03:02 -46.101 -24.000 20 15 20.41 31.77 3/14/2006 08:26 -45.965 -24.226 55 50 26.08 34.91 9/23/2005 04:42 -46.178 -24.042 20 15 20.49 31.75 3/14/2006 11:02 -46.053 -24.077 55 50 26.12 35.00 9/23/2005 06:18 -46.257 -24.084 25 25 20.34 31.17 3/14/2006 13:30 -46.101 -24.000 40 35 26.74 35.12 9/23/2005 09:10 -46.209 -24.164 32 25 20.29 32.50 3/14/2006 16:20 -46.178 -24.042 33 28 27.08 34.79 9/23/2005 14:16 -46.120 -24.314 41 25 20.19 33.74 3/14/2006 19:05 -46.257 -24.084 16 11 28.06 33.95 9/23/2005 16:44 -46.034 -24.460 57 40 20.06 33.57 3/14/2006 20:27 -46.209 -24.164 20 15 27.66 33.98 9/23/2005 19:24 -46.188 -24.548 55 40 19.60 33.42 3/14/2006 21:48 -46.120 -24.314 24 15 27.51 34.40 9/23/2005 21:30 -46.274 -24.400 40 25 -- -- 3/14/2006 23:05 -46.034 -24.460 31 25 27.53 34.21 9/23/2005 23:40 -46.362 -24.252 31 15 20.65 32.20 3/15/2006 01:38 -46.188 -24.548 42 35 25.71 35.12 9/24/2005 01:31 -46.357 -24.088 20 20 20.60 31.57 3/15/2006 04:15 -46.274 -24.400 57 50 25.96 34.96 9/24/2005 02:46 -46.458 -24.091 16 10 20.51 31.26 3/15/2006 08:15 -46.362 -24.252 57 52 25.17 35.22 9/24/2005 04:20 -46.617 -24.170 14 10 20.60 31.31 3/15/2006 10:28 -46.357 -24.088 46 40 26.14 35.12 9/24/2005 06:23 -46.517 -24.338 30 25 20.51 33.43 3/15/2006 13:10 -46.458 -24.091 28 20 27.44 34.45 9/24/2005 08:19 -46.430 -24.486 45 40 19.67 33.35 3/15/2006 15:20 -46.617 -24.170 21 15 27.47 34.51 9/24/2005 10:32 -46.342 -24.635 55 50 19.65 33.26 3/15/2006 16:38 -46.517 -24.338 21 15 27.56 34.38 9/24/2005 12:45 -46.497 -24.721 53 35 20.04 33.29 3/15/2006 17:58 -46.430 -24.486 18 10 27.60 34.39 9/24/2005 14:43 -46.584 -24.576 43 25 19.88 33.36 3/15/2006 19:02 -46.342 -24.635 15 10 27.35 34.56 9/24/2005 16:35 -46.670 -24.426 30 15 20.36 33.43 3/15/2006 20:50 -46.497 -24.721 27 22 26.49 35.03 9/24/2005 18:19 -46.768 -24.262 14 5 20.14 32.63 3/15/2006 22:45 -46.584 -24.576 40 30 26.34 34.98 9/24/2005 19:44 -46.914 -24.368 15 5 20.11 31.74 3/16/2006 05:10 -46.670 -24.426 60 55 25.78 34.99 9/24/2005 21:29 -46.825 -24.514 28 15 20.38 32.72 3/16/2006 07:25 -46.768 -24.262 60 55 26.07 34.88 9/24/2005 23:28 -46.740 -24.663 41 25 20.09 33.19 3/16/2006 10:20 -46.914 -24.368 31 25 25.62 35.03 9/25/2005 01:31 -46.653 -24.809 49 45 19.99 33.23 3/16/2006 13:20 -46.825 -24.514 19 15 27.23 34.65 9/20/2005 08:53 -45.592 -23.820 18 17 20.82 34.26 3/16/2006 15:00 -46.740 -24.663 18 14 27.58 34.41 9/20/2005 15:12 -45.505 -23.966 42 40 20.54 34.39 3/16/2006 17:00 -46.653 -24.809 43 38 26.75 34.67 3/16/2006 19:20 -45.405 -24.105 54 50 26.68 34.80
According to Smith and Richardson (1977), ichthyoplankton was collected by oblique tows with a paired 60 cm bongo net with 333 mm and 505 mm mesh size. The net was towed in double oblique hauls at approximately 2 knots. Water volumes filtered were determined from flowmeters mounted at the centers of the nets. All samples were fixed in buffered 4% formaldehyde-seawater solution.
Temperature and salinity horizontal profiles, that were used to recognize the influence of the water masses, were taken at each station using CTD (Sea-Bird Electronics, Inc., mod. SBE19). These data were processed and provided by the Physical Oceanography team of IOUSP.
Larvae were examined under a
stereomicroscope and the sciaenid identification was based on: Hildebrand and Cable (1934), Sinque (1980), Able and Fahay (1998), Chao (2002), Ditty et al. (2006), Fahay (2007) and Itagaki et al. (2007). Photographs taken with a digital camera connected to a stereomicroscope and the software ImageJ were used to measure the fish larvae.
Data Analysis
Analysis of variance (one-way ANOVA) was used to test the significant differences between the
abiotic data of water temperature and water salinity, both at 5 m, which were calculated monthly and by estuarine area. We chose to study the abiotic data at 5 m depth to avoid any influence of the air temperature at the sea surface.
Guille (1970) was used as the basis for the calculation of the frequency of larval occurrence (FO). For the abundance estimative, the number of larvae collected at each station was transformed into the
number of larvae per m2 of sea surface, in accordance
with the following equation: Y = (D*X)/V, where Y = number of larvae per square meter, D = maximum sampling depth (m), X = number of larvae collected, and V = volume of water filtered (m3). The mean abundance was calculated for all the sampling stations, not only for the positive ones. Filtered volume was calculated as V = a*n*c, where a = area of net mouth
(0.2827 m2), n = number of rotations of the flowmeter
and c = calibration factor of the flowmeter.
those with less than 5 % of frequency of occurrence, were eliminated from the biotic matrix. The abiotic data, after a first analysis using a single matrix, were
divided into three matrices: environmental
(temperature and salinity, both at 5 m depth), spatial (north shelf, south shelf, bay, port, channel and local depth) and temporal (months sampled). In all analyses the biological data (number of individuals per m2) were transformed by log (x+1), and low weight was given to rare species. The percentage of explanation of each abiotic variable was calculated in accordance with Borcard et al.(1992).
One-way analysis of similarity (ANOSIM) was performed to determine the significance of spatial trends in the structure of the Sciaenidae assemblage. The contribution of each species to the dissimilarity between different groups’ species was estimated using analysis of similarity percentages (SIMPER). Both analyses were performed using the software package PRIMER 6 (Plymouth Routines Multivariate Ecological Research) (CLARKE, 1993). Rare taxa, with an occurrence frequency of less than 5%, were excluded from the analyses. Numerical density data
expressed as number of individuals per m2 were
transformed using the log (x+1) function to enhance the contribution of the less abundant species. The analyses were undertaken on the basis of the Bray– Curtis similarity index (BRAY; CURTIS, 1957). R values approximating to 1 indicate great differences between the groups analyzed, while R values approximating to zero indicate low differences.
R
ESULTSHydrographic Conditions
Santos estuarine system. Water
temperature at 5 m varied over the different estuarine areas (ANOVA, p<0.05) and over the sampling period (ANOVA, p<0.05), following a seasonal pattern. The lowest values occurred between July and October, and the highest ones from November 2004 to March 2005, and in December 2005 (Fig. 2). The maximum temperature was 28.05°C in March 2005 in the Channel and the minimum was 20.26°C in October 2005 in the Bay.
Water salinity at 5 m also varied over the different estuarine areas (ANOVA, p<0.05) and over the sampling period (ANOVA, p<0.05). Differently from water temperature, water salinity showed no seasonal pattern. Highest salinity values were measured in the Bay, followed by the Port and then by the Channel (Fig. 3). The maximum salinity was 35.72 in November 2004 in the Bay and the minimum was 18.42 in April 2005 in the Channel.
Fig. 2. Monthly variation of mean water temperature at 5 m depth measured in the Santos estuarine system from November 2004 to December 2005.
Fig. 3. Monthly variation of mean water salinity at 5 m depth measured in the Santos estuarine system from November 2004 to December 2005.
Adjacent continental shelf. In September
2005 the water temperature was almost homogeneous throughout the continental shelf (Fig. 4). At the
surface a range from 19.59oC to 20.91oC was
warmer surface seawater ranging from 25.17oC to 28.01oC (mean = 26.96oC, sd = 0.68), but lower temperatures were observed for the 25 m layer, with a
minimum of 16.98oC and maximum of 23.60oC (mean
= 20.34oC, sd = 1.79). This minimum temperature value, associated with salinity values around 35.7, indicates the presence of South Atlantic Central Water (SACW) in the deeper layer.
In September 2005 the surface water salinity ranged from 30.92 to 34.38 (mean = 32.91, sd = 1.03). At the 25 m layer higher salinity values were observed, ranging from 33.37 to 34.53 (mean = 33.82, sd = 0.33). In March 2006 the range of salinity was from 33.90 to 35.22 (mean = 34.63, sd = 0.41) at the surface, and from 35.63 to 36.10 (mean = 35.88, sd = 0.12) at the 25 m layer (Fig. 5).
Fig. 4. Horizontal profiles of water salinity on the surface, at 5 m and at 25 m depth, measured in September 2005 and March 2006 between Peruíbe and the São Sebastião island, from the coast to the 50 m isobath.
Fish Larvae Distribution and Abundance
Santos estuarine system. A total of 11,811
fish larvae were collected in the estuarine system, and the sciaenids accounted for 12.71% of the total number. Most of the sciaenids were caught during November and December 2004. The mean abundance of sciaenid larvae ranged from 0.12 larvae.m-2 (sd = 0.11) in June 2005 to 4.28 larvae.m-2 (sd =1.99) in November 2004. The minimum FO was 50% in August 2005, and the maximum 100% in November 2004.
The following sciaenids were identified in the estuarine system: Bairdiella ronchus, Cynoscion spp., Isopisthus parvipinnis, Macrodon atricauda, Menticirrhus spp., Micropogonias furnieri, Nebris microps Cuvier, 1830, Ophioscion punctatissimus
Meek & Hildebrand, 1925, Paralonchurus brasiliensis
(Steindachner, 1875), Stellifer rastrifer and Stellifer spp. Of these, S. rastrifer was the most abundant
Adjacent continental shelf. A total of 17,572 fish larvae were collected on the continental shelf, 6.72% of them being sciaenids. Larvae of this family were widely distributed during both cruises, with FO greater than 85%, but were at their most abundant in March 2006. In this month the abundance varied from 0.27 larvae.m-2 to 35.73 larvae.m-2 (mean = 6.47 larvae.m-2, sd = 8.36). In September 2005 the range was from 0.20 larvae.m-2 to 14.75 larvae.m-2 (mean= 2.37 larvae.m-2, sd= 3.33).
Larvae of the following sciaenids were
present in the shelf area: Bairdiella ronchus,
Ctenosciaena gracilicirrhus (Metzelaar, 1919), Cynoscion spp., Isopisthus parvipinnis, Macrodon atricauda,Menticirrhus spp., Nebris microps, Stellifer rastrifer and Stellifer spp. Cynoscion spp. were the
most abundant during both cruises, with a mean of 0.49 larvae.m-2 (sd = 1.81) and FO of 22.2% in September 2005, and 1.65 larvae.m-2 (sd = 3.44) and
FO of 40.5% in March 2006. Menticirrhus spp.
(mean= 0.12 larvae.m-2; sd = 0.27) and
Stellifer spp.
(mean=0.40 larvae.m-2; sd = 1.48) were the second in
abundance, but respectively in September 2005 and in
March 2006, both with the FO of approximately 22% (Table 4).
The Main Taxa Identified
Bairdiella ronchus. In the estuarine system
the highest abundance of B. ronchus occurred in
November 2004 (0.10 larvae.m-2), when larvae were widespread throughout the area (Bay, Port and Channel). In January and December 2005 they occurred only in the Bertioga channel and in February 2005 only in the Santos bay. The B. ronchus larvae found in the estuarine system accounted for only 0.93% of the sciaenids present there. On the adjacent continental shelf, the abundance of B. ronchus was
highest in March 2006 (0.08 larvae.m-2), their
occurrence being restricted, however, to the southern part. In September 2005 their occurrence was restricted to only one station in the north. In the shelf area this species accounted for 1.10% of all the sciaenids. In the estuarine system the length frequency ranged from 2.29 mm to 4.28 mm, and on the shelf from 2.63 mm to 4.66 mm.
Table 3. Size range, abundance (larvae.m-2), frequency of occurrence (%)
and absolute number (N) of Sciaenidae larvae in the Santos estuarine system, Brazil, from November 2004 to December 2005.
Sciaenidae Size Abundance FO N
Min Max Mean SD
Bairdiella ronchus 2.9 4.3 0.011 0.029 33.3 14
Isophistus parvipinnis 3.9 12.2 0.063 0.084 66.7 66
Macrodon atricauda 4.2 13.4 0.027 0.051 50.0 23
Micropogonias furnieri 3 13.7 0.111 0.146 83.3 123
Nebris microps 2.6 3.2 0.003 0.011 8.3 2
Ophioscion punctatissimus 4.5 4.5 0.001 0.005 8.3 1
Paralonchurus brasiliensis 4.5 7.3 0.004 0.007 25.0 3
Stellifer rastrifer 2.6 8.3 0.361 0.351 91.7 360
Cynoscion spp. 2.3 8.3 0.030 0.039 66.7 35
Menticirrhus spp. 2.4 6.6 0.057 0.089 66.7 67
Stellifer spp. 2.5 11.9 0.212 0.401 50.0 256
Non-identified 551
Total 15
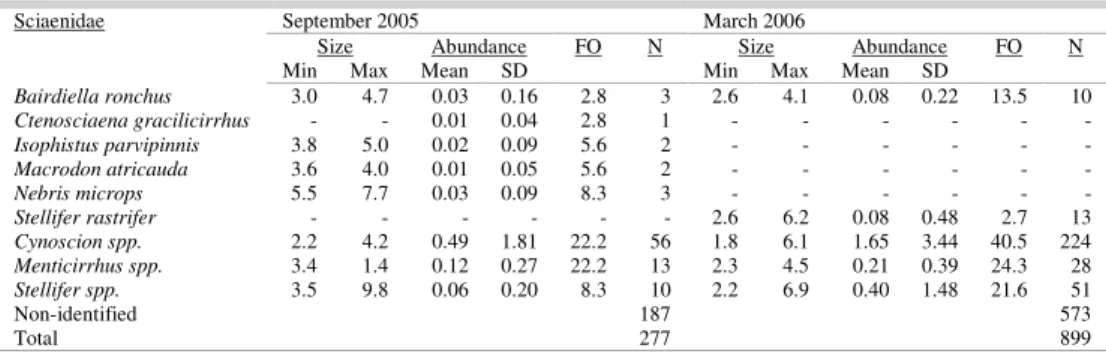
Table 4. Size range, abundance (larvae.m-2), frequency of occurrence (FO %) and absolute number (N) of
Sciaenidae larvae on the continental shelf adjacent to the Santos-São Vicente estuarine system, Brazil, in September 2005 and March 2006.
Sciaenidae September 2005 March 2006
Size Abundance FO N Size Abundance FO N
Min Max Mean SD Min Max Mean SD
Bairdiella ronchus 3.0 4.7 0.03 0.16 2.8 3 2.6 4.1 0.08 0.22 13.5 10
Ctenosciaena gracilicirrhus - - 0.01 0.04 2.8 1 - - - -
Isophistus parvipinnis 3.8 5.0 0.02 0.09 5.6 2 - - - -
Macrodon atricauda 3.6 4.0 0.01 0.05 5.6 2 - - - -
Nebris microps 5.5 7.7 0.03 0.09 8.3 3 - - - -
Stellifer rastrifer - - - 2.6 6.2 0.08 0.48 2.7 13
Cynoscion spp. 2.2 4.2 0.49 1.81 22.2 56 1.8 6.1 1.65 3.44 40.5 224
Menticirrhus spp. 3.4 1.4 0.12 0.27 22.2 13 2.3 4.5 0.21 0.39 24.3 28
Stellifer spp. 3.5 9.8 0.06 0.20 8.3 10 2.2 6.9 0.40 1.48 21.6 51
Non-identified 187 573
Isopisthus parvipinnis. The larvae of this species were almost exclusively estuarine, having their highest abundance in November 2004 (0.14 larvae.m-2), January 2005 (0.24 larvae.m-2) and March 2005 (0.19 larvae.m-2). They occurred in the three estuarine areas (Bay, Port and Channel). Their body length ranged from 3.85 mm to 12.20 mm in the estuary. In the shelf area only three larvae were collected in September/2005, ranging from 5.07 mm to 7.24 mm.
Macrodon atricauda. Larvae of this species occurred in the estuarine system and on the adjacent continental shelf, but among the estuarine sites M. atricauda larvae were absent from the Bertioga
channel. In the estuarine system the abundance was the highest in July 2005 (0.16 larvae.m-2). In the shelf area this species was rare, with only two specimens collected in September 2005, representing a mean
abundance of 0.01 larvae.m-2. In the estuary the body
length of M. atricauda ranged from 4.18 mm to 13.41
mm. The two larvae collected on the shelf were of
3.55 mm and 4.03 mm. Micropogonias furnieri. This
species was absent from the adjacent continental shelf. On the other hand, its occurrence was observed throughout the estuarine system, mainly in October
2005 (mean abundance = 0.43 larvae.m-2). In February
2005 this species was also abundant (mean = 0.39 larvae.m-2), though it occurred only in the Bertioga channel. M. furnieri accounted for 8.19% of all the
sciaenid larvae in the estuarine system. Body length ranged from 2.98 mm to 13.68 mm.
Stellifer rastrifer. This species occurred mostly in the estuarine system, the highest abundance (1.05 larvae.m-2) being observed in January 2005. High abundance was also observed in November
2004, December 2004, and February 2005. S. rastrifer
was one of most common sciaenids in the estuarine area, accounting for 23.99% of all the Sciaenidae larvae. No significant differences among the three estuarine areas were observed (P<0.0001). On the adjacent shelf area the larval S. rastrifer occurred only in March 2006, with low abundance (mean = 0.07 larvae.m-2). In the estuary the length class ranged from 2.54 mm to 8.64 mm.
Cynoscion spp. This genus was present in the estuarine and the shelf areas. In the estuarine
system Cynoscion spp. abundance was relatively low,
the highest abundance occurring in November 2004 (0.12 larvae.m-2). In the estuary the Cynoscion spp. represented 2.33% of sciaenids. On the adjacent continental shelf this genus was more common, with wider distribution and higher abundance observed in March 2006 (mean = 1.65 larvae.m-2). In September
2005 the mean abundance was 0.49 larvae.m-2. These
larvae accounted for 23.70% of all the sciaenids in the shelf area.
Menticirrhus spp. This genus occurred in both estuarine and shelf areas. It contributed with a total of 4.46% of all the sciaenids in the estuary and 3.47% of those on the shelf. In the estuarine system the highest abundance was observed in November
2004 (mean = 0.31 larvae.m-2) and in December 2004
(mean = 0.13 larvae.m-2). On the adjacent continental
shelf Menticirrhus spp. was more abundant (mean =
0.21 larvae.m-2) with wide distribution in March 2006.
Stelliferspp. In the estuarine system larvae
of this genus were more abundant in November 2004 (1.92 larvae.m-2) and December 2004 (1.49 larvae.m -2). They were present in all the estuarine areas and
contributed with 17.05% of the taxonomic composition of Sciaenidae. On the adjacent continental shelf, the genus presented its highest abundance and widest distribution in March 2006. It represented 5.16% of the sciaenids in the shelf area. Abiotic influence on the Sciaenidae larvae
The abiotic variables explained 42.21 % of the variability of the biological data. The first two axes were responsible for 66.30% of biological data variation. Axis 1 was negatively correlated with local depth, South Shelf, North Shelf and salinity. Axis 2 was positively correlated with the months of July and October 2005 and negatively correlated with January 2005. The species-environment correlation presented high values on the first (0.89) and second (0.79) axes. The combined sum of canonical eigenvalues (1.675) equaled 42.2% of that for all the eigenvalues (3.968), showing the effect of an adequate building of an environmental relationship into the CCA model (Table 5). The canonic axes were significantly different by the Monte Carlo permutation test (p= 0.0001). Figure 6 represents the distribution of the species in relation to the significant abiotic variables.
Analyzing the environmental matrix, only salinity was significant by the Monte Carlos Permutation test, with an explanation of 7.18 % of the biological data variation (sum of all canonic eigenvalues = 0.28). S. rastrifer and I. parvipinnis
were negatively correlated with salinity.
The temporal data were those with the highest influence on the biological data variation (percentage of explanation = 34.30%; sum of all
canonic eigenvalues = 1.36). I. parvipinnis was
positively correlated with January 2005. M. furnieri
and M. atricauda were positively correlated with July and October 2005. Cynoscion spp. and S. rastrifer
Fig. 6. Ordination diagram (biplot) from CCA including Sciaenidae species and significant environmental variables (represented by vectors) (BARO = Bairdiella ronchus; CYSP = Cynoscion spp.; ISPA = Isopisthus parvipinnis; MAAT = Macrodon atricauda; MESP = Menticirrhus spp; MIFU
= Micropogonias furnieri; STRA = Stellifer rastrifer; STSP
= Stellifer spp.).
Table 5. Summary of CCA performed on the abundance of eight most numerous Sciaenidae larval species, in the Santos estuarine system, from November 2004 to December 2005, and on the continental shelf adjacent to the Santos-São Vicente estuarine system, Brazil, in September 2005 and March 2006.
Axes
1 2 3 4
Summary statistics for ordination axes
Eigenvalues 0.675 0.437 0.311 0.118
Species-environment
correlations 0.892 0.787 0.674 0.483 Cumulative percentage
variance:
of species data 17.0 28.0 35.8 38.8 of species-environment
relation 40.3 66.3 84.9 91.9
Sum of all eigenvalues 3.968
Sum of all canonical eigenvalues
The spatial data explained 17.97 % of the biological data variation (sum of all canonic eigenvalues = 0.71), only the influence of south and north shelf and local depth being statistically
significant. B. ronchus, Menticirrhus spp. and
Cynoscium were positively correlated with the south
and north shelf.
One-way analysis of similarity (ANOSIM) showed significant differences between the continental
shelf and the estuarine areas. Within the estuarine areas, only Bay and Channel showed significant differences. The differences were more evident between the more distant regions, as exemplified by those between Shelf and Channel (R=0.44) (Table 6). These results showed a gradual spatial variation of the Sciaenid larvae between the continental shelf and the inner estuarine area.
Table 6. Similarity analysis of Sciaenidae larval groups between the different sampling areas: Shelf, Bay, Port and Channel.
R p Shelf - Bay 0.273 0.001 Shelf - Port 0.402 0.001 Shelf - Channel 0.440 0.001 Bay - Port -0.006 0.526 Bay - Channel 0.130 0.005 Port - Channel 0.113 6.900
According to SIMPER analysis, the species that most contributed to the formation of the Shelf
group were: Cynoscion spp. (64.44%), Menticirrhus
spp. (20.15%) and Stellifer spp. (10.33%); to the Bay
group: S. rastrifer (43.71%), Stellifer spp. (17.97%),
M. funrieri (10.54%), Menticirrhus spp. (10.29%) and I. parvipinnis (7.96%), and to the Port group: S. rastrifer (72.61%), M. atricauda (10.78%) and Menticirrhus spp. (7.53%). Finally, the Channel group consisted mainly of: S. rastrifer (78.09%), Stellifer spp. (10.16%) and M. furnieri (6.03%).
D
ISCUSSIONAlthough Sciaenidae do not constitute a dominant family, they can be recognized as an important component of the ichthyoplankton in the present study area. As indicated by our results, the sciaenid accounted for 12% and 15% of total fish larvae in the estuary and on the adjacent continental shelf, respectively. Some similar results have been observed in various estuarine and coastal areas around the world. For instance, Rakocinski et al. (1996), by analyzing the ichthyoplankton assemblage structure in Mississippi Sound, described the sciaenids as being among the seven major groups. According to Katsuragawa and Dias (1997), in a region very close to that of the present study, the inner shelf of São Sebastião, the Sciaenidae constituted the 8th family among all the larvae identified, but the second among the demersal group.
notable presence of Sciaenidae in estuarine and coastal ecosystems has long been known, mainly as a result of studies of adult specimens. Several studies may be cited, especially relating to the southeastern Brazilian coast, e.g. Chaves and Corrêa (1998), Chaves and Bouchereau (2000), Pessanha et al. (2000), Araújo et al. (2002) and Spach et al. (2004). Concerning the area investigated by the present study, Paiva Filho and Schmiegelow (1986) reported the Sciaenidae as a family of higher biomass and number of specimens, according to their estimates based on their bottom trawling method in the Santos bay.
A feature of the sciaenids collected in the present study was the large number of small larvae, which caused us some difficulty in identifying the specific levels. However, nine species (Bairdiella ronchus, Ctenosciaena gracilicirrhus, Isopisthus parvipinnis, Macrodon atricauda, Micropogonias furnieri, Nebris microps, Ophioscion punctatissimus, Paralonchurus brasiliensis and Stellifer rastrifer) and
three genera (Cynoscion spp., Menticirrhus spp. and Stellifer spp.) were classified. As compared with the São Sebastião region (Katsuragawa; Dias, 1997), it may be observed that the taxonomic composition of the sciaenids in the two areas differed by virtue of the
presence of five species (Cynoscion leiarchus,
Larimus breviceps, Macrodon ancylodon, Menticirrhus americanus and P. brasiliensis) and the
absence of M. atricauda in São Sebastião.
Unfortunately, due to their small size, the
Menticirrhus and Cynoscion genera of the present
study could not be refined to species level, but
probably M. americanus, the main species and widely
distributed in São Sebastião (KATSURAGAWA; DIAS, 1997), was also present in Santos. The species
S. rastrifer, I. parvipinnis, and M. atricauda were also
reported with great frequency and abundance among the adult specimens in the Santos region (GIANNINI; PAIVA FILHO, 1990; SCHMIDT; DIAS, 2012).
The considerable presence of early larval stages suggests an effective use of the Santos estuarine system as a spawning or nursery ground by sciaenid species. On the other hand, the shelf area was in general poor in terms of abundance, and among the species identified, the larval M. furnieri was absent. Our results concerning the role of the estuarine system are coherent with the presence of adult sciaenids there, e.g. Chaves (1995) reported that the reproduction of B. ronchus occurs inside the Guaratuba bay and that, thereafter, the adults disperse in the coastal area. M. furnieri is known as a species highly dependent on semi-enclosed systems such as bays and estuaries (GIANNINI; PAIVA FILHO, 1990; VIEIRA; CASTELLO, 1997; COSTA; ARAÚJO, 2003), and
juveniles and pre-recruits are not present in the shelf area (CASTELLO, 1986; VAZZOLER, 1991). According to Vieira and Castello (1997), living the first year of life inside the Patos lagoon may help the early stages to avoid predation.
Many authors refer to the estuaries as nursery ground for fish (e.g. GODEFROID et al.,
1999; COSTA; ARAÚJO, 2003). Lowe-McConnell (1987) included the sciaenids in a group of migrant marine fishes which breed in the sea and whose young enter the estuaries to feed and shelter until their gonads start to mature. Able and Fahay (1998), in a study on the sciaenid species found in the Middle Atlantic Bight, reported that spawning areas are diversified, occurring close to the coast for species such as Cynoscion regalis, within harbors, estuaries
and sounds for Bairdiella chrysoura, and on the
continental shelf for Leiostomus xanthurus and
Micropogonias undulatus, all of them, however, being
found in estuaries during their first year of life. The sciaenids in the study area seem to follow these trends, with spawning occurring throughout the shelf area, as evidenced by our results for many species, whereas the higher abundance of larvae in the estuarine system may be a clue to spawning activity within this area. At least four species (Stellifer brasiliensis, S. rastrifer, I. parvapinnis and P. brasiliensis) are known to
complete their reproductive cycle inside the Santos bay.
Temporal change, the abiotic variable that presented the highest percentage of explanation of the occurrence and abundance of sciaenid larvae, is also reflected in their patterns of reproduction and intensity
of spawning. Chaves (1995) found that B. ronchus
reproduces during spring and summer, the period of larval peak abundance for this species in the present study area. Based on the reproductive biology studies of S. rastrifer from Guanabara bay, Chaves and
Vendel (1997) observed more intense reproductive activity during the winter and especially in spring. In the present study the peak of mean abundance of larval
S. rastrifer was observed to occur in January, though
this species was well represented throughout the year. This result corroborates the study of Sinque (1980), which found large numbers of S. rastrifer larvae throughout the year in the Cananéia-Iguape estuarine system. This larval occurrence and abundance pattern also matches the continuous spawning behavior of adults observed by Schmidt (2011) evidenced by the presence of spawning females in samples caught in at least eight months of the year. Another species with variable abundance along the year was M. furnieri,
biology conducted by Isaac-Nahum and Vazzoler (1987) who reported a long spawning period during the four seasons.
Historically the Santos estuarine system has been affected by anthropic activities. However, the three estuarine areas investigated in this study present distinct features concerning the source and relative level of the impacts caused. The Santos port area is supposed to have been the most heavily impacted by the several activities related to industry, port and urbanization, and one of the thoughts entertained at the beginning of the ECOSAN project was that, of the areas involved, the Bertioga channel would be the least severely impacted. Our results suggest that the differences among areas have not affected the abundance of sciaenid larvae, as indicated by the ANOSIM.
It is not easy to identify the main environmental factors that influence the distribution and abundance of fish (larvae or adults) in an estuarine system, because in estuaries the lives of organisms are controlled by the interaction of many different abiotic and biotic factors (ALLEN, 1982; LOWE-MCCONNELL, 1987; SPACH et al., 2004). Estuaries are characterized by varying salinity, temperature, turbidity, muddy bottoms, strong currents and freshwater flowing out over the denser more saline water (LOWE-MCCONNELL, 1987). The biotic factors include availability of prey, competitors and predators (ALLEN, 1982). In the present study it has not been possible to evaluate the influence of biotic factors, but the CCA analysis indicated that the abiotic variables measured in the present study showed a high percentage of explanation of the variability of larval sciaenids (42.21 %). This larval variation was explained mainly in terms of the different months sampled (temporal influence), local depth, the south and the north part of the shelf area (spatial influence) and salinity. In this case, the variation in the abundance of larvae in the estuarine system seems, in general, to follow the seasonal patterns observed in the marine coastal waters along the southeastern Brazil coast, with higher abundance during spring and summer.
Although the influence of the temperature on the sciaenid larvae species variation was not significant in this study, it is known that temperature is one of the most important physical properties of the marine environment as it exerts an influence on many physical, chemical, geochemical and biological events (LALLI; PARSONS, 1995). We believe that temperature has been best represented by the temporal data analysis.
In the Santos estuarine system the average temperature is always higher than 20oC, the lowest
average being 22.60oC, in the winter, and the highest
average 26.09oC, in summer. The large difference between the mean temperatures during spring 2004 (25.28oC) and spring 2005 (22.60oC) may suggest an interannual oscillation in the thermic structure of this area. However, the seasonal range of temperature (from the minimum of 20.77oC to the maximum of 28.50oC) in the present study is far smaller than that observed in other areas, e.g. 9.0oC - 33.5oC in the Mississippi Sound (Rakocinski et al., 1996) and 0oC –
28oC in the Chesapeake Bay (Able; Fahay, 1998). The
relatively small variation in temperature perhaps contributed to the all-year-round patterns of distribution and abundance of larval sciaenids in the Santos estuarine system with a tendency to greater abundance in the warmer months.
In the shelf area the thermal dynamics were very different, varying from almost homogeneous and colder in September 2005 (19.00oC – 20.95oC) to a stratified March 2006 scenario with warm water (25.17oC – 28.01oC) at the surface but cold water (minimum of 16.98oC) at the 25 m layer, suggesting the presence of SACW. However, according to the ECOSAN reports (Pires-Vanin et al., 2008), this intrusion of SACW did not reach the euphotic zone, and the new primary production was not significant. Pires-Vanin et al. (2008) concluded that on the shelf off Santos the contribution of SACW to the fertilization of the surface water is not as effective as it is off the Ubatuba and São Sebastião coast, perhaps due to the greater width of the continental shelf in the study region. In this case, the role of the estuarine system in providing organic matter for, at least, the neighboring coast must be of great importance in promoting primary production.
The results of the present study show that the abundance in the shelf area was considerably higher in March 2006 both for larval sciaenids and for total fish larvae collected, indicating a seasonal variation with an increase during the warm season, similar to that observed on other parts of the southeastern coast by several authors, e.g. Matsuura et al. (1992), Katsuragawa et al. (1993) and Lopes et al. (2006).
A
CKNOWLEDGEMENTSBelmiro Mendes de Castro for providing the CTD data used in this project.
R
EFERENCESABLE, K. W.; FAHAY, M. P. The first year in the life of
estuarine fishes in the Middle Atlantic Bight. New
Brunswick: Rutgers University Press, 1998. 342 p. ALLEN, J. R. L. Simple models for the shape and symmetry
of tidal sand waves: (3) dynamically stable asymmetrical equilibrium forms without flow separation. Mar. Geol., v. 48, n. 3/4, p. 321-336, 1982.
ARAÚJO, F. G.; AZEVEDO, M. C. C.; SILVA, M. A.; PESSANHA, A. L. M., GOMES, I. D.; CRUZ-FILHO, A. G. Environmental influences on the demersal fish assemblages in the Sepetiba Bay, Brazil. Estuaries, v. 25, n. 3, p. 441–450, 2002.
BORCARD, D.; LEGENDRE, P.; DRAPEAU, P. Partialling out the spatial component of ecological variation.
Ecology, v. 73, n. 3, p. 1045-1055, 1992.
BRAY, J. R.; CURTIS, J. T. An ordination of the upland forest communities of Southern Wisconsin. Ecol.
Monogr., v. 27, n. 4, p. 325–349, 1957.
BRUNO, M. A.; MUELBERT, J. H. Padrões temporais de distribuição da abundância de ovos e larvas de
Brevoortia pectinata, Lycengraulis grossidens e
Micropogonias furnieri para o estuário da Lagoa dos Patos, Rio Grande - RS. In: SIMPÓSIO BRASILEIRO DE OCEANOGRAFIA, 1., São Paulo, 2002. Resumo. São Paulo: IO/USP, 2002. 1 CDROOM.
BRUNO, M. A.; MUELBERT, J. H. Distribuição espacial e variações temporais da abundância de ovos e larvas de
Micropogonias furnieri, no estuário da Lagoa dos Patos:
registros históricos e forçantes ambientais. Atlântica, v. 31, n. 1, p. 51-68, 2009.
CASATTI, L.; MENEZES, N. A. Sciaenidae. In: MENEZES, N. A.; BUCKUP, P. A.; FIGUEIREDO, J. L.; MOURA, R. L. (Eds.). Catálogo das espécies de peixes marinhos
do Brasil. São Paulo: Museu de Zoologia da
Universidade de São Paulo, 2003, 160 p.
CASTELLO, J. P. Distribución, crecimiento y maduración sexual de la corvina juvenil (Micropogonias fumieri) en el estuario de la "Lagoa dos Patos", Brasil.Physis, v. 44, n. 106, p. 21-36, 1986.
CASTRO, B. M.; LORENZZETTI, J. A.; MIRANDA, L. B.; SILVEIRA, I. C. A. Estrutura Termohalina e circulação na região entre Cabo de São Tomé (RJ) e o Chuí (RS). In: ROSSI-WONGTSCHOWSKI, C. L. D. B.; MADUREIRA, L. S. P. O ambiente oceanográfico da Plataforma Continental e do Talude na região
sudeste-sul do Brasil. São Paulo: EDUSP, 2006. p.
11-120.
CETESB. Sistema estuarino de Santos e São Vicente. São Paulo: Companhia de Tecnologia de Saneamento Ambiental, 2001. 183p. (Relatório técnico).
CHAO, L. N. A basis for classifying western Atlantic
Sciaenidae (Teleostei: Perciformes). Washington: U.S.
Department of Commerce, National Oceanic and Atmospheric Administration, National Marine Fisheries Service, 1978. 64 p. (NOAA Technical Report NMFS
Circular, 415). Available on:
http://spo.nmfs.noaa.gov/Circulars/CIRC415.pdf. Accessed in: 07/15/2013.
CHAO, L. N. Sciaenidae. Croakers (drums). In: CARPENTER, K. E. (Ed.). The living marine
resources of the Western Central Atlantic. Rome:
Food and Agriculture Organization of the United Nations, 2002. p. 1583-1653. (FAO Species Identification Guide for Fishery Purposes) (Special Publications - American Society of Ichthyologists and Herpetologists, n. 5).
CHAVES, P. T. C. Atividade reprodutiva de Bairdiella ronchus (Cuvier) (Pisces, Sciaenidae) na Baía de
Guaratuba, Paraná, Brasil. Rev. Bras. Zool., v. 12, n. 4, p. 759–766, 1995.
CHAVES, P. T. C.; VENDEL, A. L. Reprodução de Stellifer rastrifer (Jordan) (Teleostei, Sciaenidae) na Baía de
Guaratuba, Paraná, Brasil. Rev. Bras. Zool., v. 14, n. 1, p. 81–89, 1997.
CHAVES, P. T. C.; CÔRREA, M. F. M. Composição ictiofaunística da área de manguezal da Baía de Guaratuba, Paraná, Brasil. Rev. Bras. Zool., v. 15, n. 1, p. 195-202, 1998.
CHAVES, P.; BOUCHEREAU, J. L. Use of mangrove habitat for reproductive activity by the fish assemblage in the Guaratuba Bay, Brazil. Oceanol. Acta, v. 23, n. 3, p. 273-280, 2000.
CLARKE, K. R. Non-parametric multivariate analyses of changes in community structure. Aust. J. Ecol., v. 18, n. 1, p. 117-143, 1993.
COSTA, M. R.; ARAÚJO, F. G. Use of a tropical bay in Southeastern Brazil by juvenile and subadult
Micropogonias furnieri (Perciformes, Sciaenidae). ICES J. Mar. Sci., v. 60, n. 2, p. 268–277, 2003.
DENMAN, K. L.; POWELL, T. M. Effects of physical processes on planktonic ecosystems in the coastal ocean.
Oceanogr. Mar. Biol., v. 22, p. 125-168, 1984.
DITTY, J. G.; SHAW, R. F.; FAROOQI, T. Sciaenidae. In: RICHARDS, W. J. (Ed.). Early stages of atlantic fishes: an identification guide for the Western Central North Atlantic. Boca Raton: CRC Press, Taylor & Francis, 2006. p. 1669-1723. (CRC marine biology series).
FAHAY, M. P. Early stages of fishes in the Western North Atlantic Ocean (Davis Strait, Southern
Greenland and Flemish Cap to Cape Hatteras). Nova
Scotia: Northwest Atlantic Fisheries Organization, 2007. 1696 p.
GIANNINI, R.; PAIVA FILHO, A. M. Os Sciaenidae (Teleostei: Perciformes) da baía de Santos (SP), Brasil. Bol. Inst. Oceanogr., v. 38, n. 1, p. 69–86, 1990. GODEFROID, R. S.; HOFSTAETTER, M.; SPACH, H. L.
Larval fish in the surf zone of Pontal do Sul Beach, Pontal do Paraná, Paraná, Brazil. Rev. Bras. Zool., v. 16, n. 4, p. 1005-1011, 1999.
GODEFROID, R. S.; SANTOS, C.; HOFSTAETTER, M.; SPACH, H. L. Occurrence of larvae and juveniles of
Eucinostomus aregenteus, Eucinostomus gula, Menticirrhus americanus, Menticirrhus littoralis,
GUILLE, A. Benthic bionomy of continental shelf of the French Catalane coast. II: Benthic communities of the macrofauna. Vie Milieu, v. 21, n. 8, p. 149-280, 1970. HANNA, S. S. Institutions for marine ecosystems: economic
incentives and fishery management. Ecol. Appl., v. 8, n. 1, suppl., p. S170-S174, 1998.
HILDEBRAND, S. F.; CABLE, L. E. Reproduction and development of whitings or kingfishes, drums, spot, croaker, and weakfishes or sea trouts, family Sciaenidae of the Atlantic coast of the United States. Bull. U. S. Bur. Fish., v. 48, n. 16, p. 41–117, 1934.
ISAAC-NAHUM, V. J.; VAZZOLER, A. E. A. M. Biologia reprodutiva de Micropogonias furnieri (Desmarest, 1823) (Teleostei, Sciaenidae). 2. Relação gonadossomática, comprimento e peso dos ovários como indicadores do período de desova. Bol. Inst. Oceanogr., v. 35, n. 2, p. 123–134, 1987.
ITAGAKI, M. K.; OHKAWARA, M. H.; DIAS, J. F.; KATSURAGAWA, M. Description of larvae and juveniles of Bairdiella ronchus (Sciaenidae: Teleostei) in Southeastern Brazil. Sci. Mar.,v. 71, n. 2, p. 249- 257, 2007.
KATSURAGAWA, M.; MATSUURA, Y.; SUZUKI, K.; DIAS, J. F.; SPACH, H. L. The Ichthyoplankton of the Ubatuba Region (São Paulo State, Brazil): composition, distribution and seasonal occurrence (1985-1988). Publ.
Esp. Inst. Oceanogr., v. 1, n. 10, p. 85-121, 1993.
KATSURAGAWA, M.; DIAS, J. F. Distribuição do ictioplâncton na região de São Sebastião, SP. Relat. Téc. Inst. Oceanogr., v. 41, p. 15-28, 1997.
LALLI, C. M.; PARSONS, T. R. Biological Oceanography: an introduction. Oxford: Butterworth-Heinemann, 1995. 301 p.
LEGENDRE, P.; LEGENDRE, L. Numerical ecology. 2. ed. Amsterdam: Elsevier Science B.V., 1998. 870 p. (Developing in Environmental Modelling, 20).
LEIS, J. M. The pelagic stage of reef fishes: the larval biology of coral reef fishes. In: SALE, P. F. (Ed.). The
ecology of fishes on coral reefs. San Diego: Academic
Press, 1991. p. 183-230.
LOPES, R. M.; KATSURAGAWA, M.; DIAS, J. F.; MONTÚ, M. A.; MUELBERT, J. H.; GORRI, C.; BRANDINI, F. P. Zooplankton and ichthyoplankton distribution on the Southern Brazilian shelf: an overview. Sci. Mar., v. 70, n. 2, p. 189-202, 2006.
LOWE-MCCONNELL, R. H. Ecological studies in tropical
fish communities. Cambridge: New York: Cambridge
University Press, 1987. 382 p. (Cambridge tropical biology series).
MATSUURA, Y.; NAKATANI, K. Ocorrência de larvas e jovens de peixes na Ilha Anchieta (SP), com algumas anotações sobre a morfologia da castanha, Umbrina coroides Cuvier, 1830. Bol. Inst. Oceanogr., v. 28, n. 1, p. 165-183, 1979.
MATSUURA, Y.; SPACH, H. L.; KATSURAGAWA, M., Comparison of spawning patterns of the Brazilian sardine (Sardinella brasiliensis) and anchoita (Engraulis anchoita) in Ubatuba region, Southern Brazil during 1985 through 1988. Bol. Inst. Oceanogr., v. 40, n. 1/2, p. 101-115, 1992.
MIRANDA, L. B.; KATSURAGAWA, M. Estrutura Térmica na Região Sudeste do Brasil (outubro/novembro de 1998). Publ. Esp. Inst. Oceanogr., v. 8, p. 1-14, 1991.
NELSON, J. S. Fishes of the world. 4. ed. Hoboken: John Wiley, 2006. 601 p.
NORCROSS, B. L.; SHAW, R. F. Oceanic and estuarine transport of fish eggs and larvae: a review. Trans. Am. Fish. Soc., v. 113, n. 2, p. 153-165, 1984.
PAIVA FILHO, A. M.; SCHMIEGELOW, J. M. M. Estudo sobre a ictiofauna acompanhante da pesca do camarão sete-barbas (Xyphopenaeus kroyeri) nas proximidades da
Baía de Santos, SP. Bol. Inst. Oceanogr., v. 34, p. 79– 85, 1986.
PAIVA FILHO, A. M.; GIANNINI, R.; RIBEIRO NETO, F. B.; SCHMIEGELOW, J. M. M. Ictiofauna do complexo
baía-estuário de Santos e São Vicente, SP, Brasil. São
Paulo: Instituto Oceanográfico/Universidade de São Paulo, 1987. p.1–10. (Relatório Interno, v. 17).
PESSANHA, A. L. M.; ARAÚJO, F. G.; AZEVEDO, M. C. C. GOMES, I. D. Variações temporais e espaciais na composição e estrutura da comunidade de peixes jovens da baía de Sepetiba, Rio de Janeiro. Rev. Bras. Zool., v. 17, n. 1, p.251–261, 2000.
PIRES-VANIN, A. M. S.; CASTRO, B. M.; MIRANDA, L. B.; DIAS, J. F.; BICEGO, M. C.; KATSURAGAWA, M.; LOPES, R.; GIANESELLA, S. M. F.; CORBISIER, T. N. Síntese dos resultados e conclusões. In: PIRES-VANIN, A. M. S. (Coord.). A influência do complexo estuarino da Baixada Santista sobre o ecossistema da
plataforma adjacente (ECOSAN). São Paulo:
ECOSAN, 2008. 643 p. (Technical report, n. 4). RAKOCINSKI, C. F.; LYCZKOWSKI-SHULTZB, J.;
RICHARDSON, S. L. Ichthyoplankton assemblage structure in Mississippi Sound as revealed by Canonical Correspondence Analysis. Estuarine, Coastal Shelf Sci., v. 43, n. 2, p. 237-257, 1996.
SASSA, C.; KAWAGUCHI, K.; OOZEKI, Y.; KUBOTA, H.; SUGISAKI, H. Distribution patterns of larval Myctophid fishes in the transition region of the Western North Pacific. Mar. Biol., v. 144, n. 3, p. 417-428, 2004.
SCHAEFFER-NOVELI, Y.; CINTRON, G. Guia para
estudo de áreas de manguezal: estrutura, função e flora.
São Paulo: Caribbean Ecological Research, 1986. 150 p. SCHMIDT, T. C. S.; DIAS, J. F. Pattern of distribution and
environmental influences on the Sciaenidae community of the Southeastern Brazilian Coast. Braz. J. Oceanogr., v. 60, n. 2, p. 235-245, 2012.
SINQUE, C. Larvas de Sciaenidae (Teleostei) identificadas na região estuarina lagunar de Cananéia. Bol. Zool., v. 5, p. 39-77, 1980.
SMITH, P. E.; RICHARDSON, S. L. Standard techniques
for pelagic fish egg and larvae surveys. Rome: F.A.O.,
1977. 100 p. (FAO Fisheries Technical Papers, v. 175). SPACH, H. L.; GODEFROID, R. S.; SCHWARZ Jr., C. S.
VALENTINI, H.; PEZZUTO, P. R. Análise das principais pescarias comerciais da região Sudeste-Sul do Brasil com base na produção controlada do período 1986-2004. São Paulo: Instituto Oceanográfico-USP, 2006. 56 p. (Série Documentos Revizee: Score-Sul).
VAZZOLER, A. E. A. M. Síntese de conhecimentos sobre a biologia da corvina Micropogonias furnieri (Desmarest,
1823), na costa do Brasil. Atlântica, v. 13, n. 1, p. 55-74, 1991.
VIEIRA, J. P.; CASTELLO, J. P. Environment and biota of the Patos Lagoon estuary – fish fauna. In: SEELIGER, U.; ODEBRECHT, C.; CASTELLO, J. P. (Eds.).
Subtropical convergence environments: the coast and
sea in the Southwestern Atlantic. Berlin: London: Springer Verlag, 1997, p. 56-62.