Asymmetries in the contributions of On- and Off-mechanisms
to the ERG signal
Jan Kremers
University of Erlangen-Nürnberg, Erlangen, BY, Germany
Abstract
ERG responses were recorded to rapid-on and rapid-off L- and M-cone isolating sawtooth stimuli of different cone contrasts. In addition, the responses were recorded to simultaneous in-phase stimulation of the L- and M-cones at equal cone contrast. Linear responses to mirror imaged rapid-on and rapid-off sawtooth stimuli are also mirror imaged. By adding on- and off-responses, linear response components will cancel and nonlinearities will remain. Because nonlinearities that occur at a certain stage of visual processing will influence subsequent stages, linear response components will probably have an outer retinal origin and nonlinearities probably originate mainly in the inner (post-receptoral) retina. Keywords: electroretinograms, On- and Off-responses, L- and M-cones, asymmetries.
Received 31 January 2012; received in revised form 31 May 2012; accepted 31 May 2012. Available online 18 November 2013.
Jan Kremers, Department of Ophthalmology, University Hospital Erlangen, Schwabachanlage 6, 91054 Erlangen, Germany. Correspondence regarding this article should be directed to: Jan Kremers, Department of Ophthalmology, University Hospital Erlangen, Schwabachanlage 6, D-91054 Erlangen, Germany. Phone: +49 9131 8544595 E-mail: jan. [email protected]
Introduction
The form of a system’s response to a stimulus depends on the form of that stimulus. Similarly, the ERG response depends on the form of the visual stimulus. Originally, ERG recordings were mainly performed
using lashed stimuli with a short duration. These
responses are quite different from the responses to, e.g.,
a high frequency licker. Similarly, the response to step
increments and decrements in luminance are different.
The disadvantage of the short lash stimuli is that
the responses to the increase in luminance (the “on-response”) and to the decrease in luminance (the “off-response”) are merged (Sieving, 1993; Sustar, Hawlina & Brecelj, 2006). To be able to distinguish between the
“on”- and “off”-responses either long lashed or ramped stimuli can be used. In the long lashed ERG (Horn et
al., 2011; Sieving, 1993; Sustar et al., 2006) the time between the onset and the offset of the light is long enough to disentangle the responses. Ramps consist of a sudden luminance change (either rapid-on or rapid-off) and a relatively slow linear increase or decrease during the rest of the stimulus. Because the ERG response to the slow phases is small, these stimuli are suitable to isolate either “on”- or “off”-responses using rapid-on and rapid-off stimuli, respectively (Alexander, Barnes
& Fishman, 2003; Alexander, Fishman, Barnes & Grover, 2001; Barnes, Alexander & Fishman, 2002).
Although as mentioned, it can be expected that the ERG to different stimuli can be quite different, it is surprising that the responses to increments (“on”-responses) and decrements (“off”-(“on”-responses) in light intensities (or in photoreceptor excitations) are indeed so dissimilar that they seemingly bear no relationship with each other (Alexander et al., 2001; Rodrigues, Da Silva Filho, Silveira & Kremers, 2010; Sustar et al., 2006; Viswanathan, Frishman & Robson, 2000). The “on”-response shows an initial trough followed by a
positive delection that is homologue to the b-wave in the lash ERG (Frishman, 2006) and by a second trough
that has about the same latency as photopic negative
response (PhNR) of the lash ERG. The “off”-response often only shows a marked positive delection: a d-wave
followed by a PhNR-like negativity. These differences between the “on”- and “off”-responses most probably originate in asymmetries in the “on”- and “off”-post-receptoral pathways.
Several studies have used these stimuli to detect selective changes in the different components of the “on”- and “off”- responses caused by a retinal disorder (Alexander et al., 2003; Alexander et al., 2001; Alexander, Fishman, Peachey, Marchese & Tso, 1992; Barnes et al., 2002; Dryja et al., 2005). However, only a few studies have concentrated upon a direct comparison between on- and off-responses by looking at symmetrical and asymmetrical components (Luo & Frishman, 2011).
example, retinal ganglion cells belonging to the parvocellular pathway receive L- and M-cone input but no S-cone input. The L- and M-cone driven signals are about equal in strength and are in counterphase at low temporal frequencies. The responses therefore display cone opponency. In contrast, cells belonging to the magnocellular pathways receive synergistic input from the L- and M-cones with the L-cone driven signal on average about twice as strong as the M-cone driven signal. This relative strength varies substantially between subjects and is proportional to the numbers of L- and M-cones in the retina (Kremers et al., 2000).
Here I present the results of measurements to rapid-on and rapid-off sawtooth stimuli to compare the “on”- and “off”-responses quantitatively and to evaluate
features that relect asymmetrical nonlinearities in the
retinal processing stream leading to the net ERG signal. The stimuli were designed to either stimulate both L- and M-cone pathways in phase with equal cone contrasts or to selectively stimulate the L- and M-cones.
Methods
Subjects
The study was performed in accordance with the tenets of the Declaration of Helsinki. Six normal healthy subjects (two females aged 32 and 46 years and four males between 36 and 51 years old) participated in this study. All subjects had normal color vision and did not suffer from any retinal disorder. The subjects rested their heads on a chin rest and a forehead bar and were seated in front of the stimulus monitor with a distance to the observers’ eyes of 10 cm. The subjects were requested
to ixate a cross in the middle of the screen. ERGs were
recorded from one eye using DTL electrodes. Gold cup electrodes placed at the ipsilateral temple and the forehead were used as reference and ground electrodes, respectively. The other eye was covered by an eye patch. The pupils of the eyes from which the ERGs were recorded were dilated with mydriaticum (tropicamid). If requested by the subject, a topical anaesthetic (oxybuprocain) was administered.
Stimuli
The stimuli were presented on a BARCO color CRT screen (CCID 7751 MKII; 100 Hz frame rate) controlled by a VSG 2/2 (Cambridge Research Systems) graphics card. Four Hz sawtooth stimuli (period time: 250 msec) were presented. The stimuli were spatially homogeneous and subtended 124 by 108 arc deg at the 10 cm viewing distance. The mean luminance was 66 cd/m² (20, 40 and 6 cd/m² from the red, green and blue phosphors, respectively). The mean chromaticity
in the CIE 1964 large ield diagram was (0.32, 0.31).
The resultant retinal illuminance was about 3300 phot td (assuming an 8-mm pupil diameter; the Stiles-Crawford effect may decrease the effective retinal illuminance) at which rod-driven responses were strongly suppressed,
although a small inluence of rod activity cannot be
excluded (Kremers, Czop & Link, 2009). S-cones were not stimulated by any of the stimuli.
Three stimulus types were used: one in which the L- and M-cones were stimulated in phase and with equal stimulus strength (when expressed in cone contrasts; called L+M); a second in which only the L-cones were stimulated; and a third stimulus that stimulated selectively the M-cones. The maximal possible stimulus strength resulted in 76.1% cone contrast (in each cone) for the combined L+M-cone stimuli, 29.0% M-cone contrast for the M-cone isolating stimuli and 23.3% L-cone contrast for the selective L-cone stimuli. ERG responses were measured at these maximal contrasts and at 0.75, 0.5 and 0.25 times the maximal contrast.
Procedure
The signals were ampliied 100,000 times and band-pass iltered with 3 and 300 Hz cut-off frequencies by a Grass ampliier. The signals were sampled at 2 KHz
by a CED1401 on-line computer. Data acquisition was triggered by TTL pulses generated by the VSG 2/2 board. The subjects were light adapted to room illumination for at least 10 min prior to the measurements. To avoid
stimulus-onset artifacts, the irst 4 s in the recordings
were discarded. Each recording lasted 48 s. The subjects were requested to suppress blinks and eye movements during the measurements. None of the measurements were rejected even if blinks appeared during the measurements. Between the measurements at different stimulus contrasts for a particular condition the subjects were allowed to blink several times. Between the measurements at different cone stimulus conditions the subjects could pause as long as they wished. However, the subjects never required breaks longer than about 10 s.
Data analysis
The signal processing pathways that lead to an ERG response may include several nonlinearities. Once nonlinearity occurs, all subsequent processes are affected by this nonlinearity. Therefore, linear processes are expected to be visible in the ERG only when they occur early in the visual processing pathway. One of the properties of linear processes, and of simple contrast dependent nonlinearities, is that the response to an inverted stimulus is also inverted. This linear
property can be derived from the deinition of the
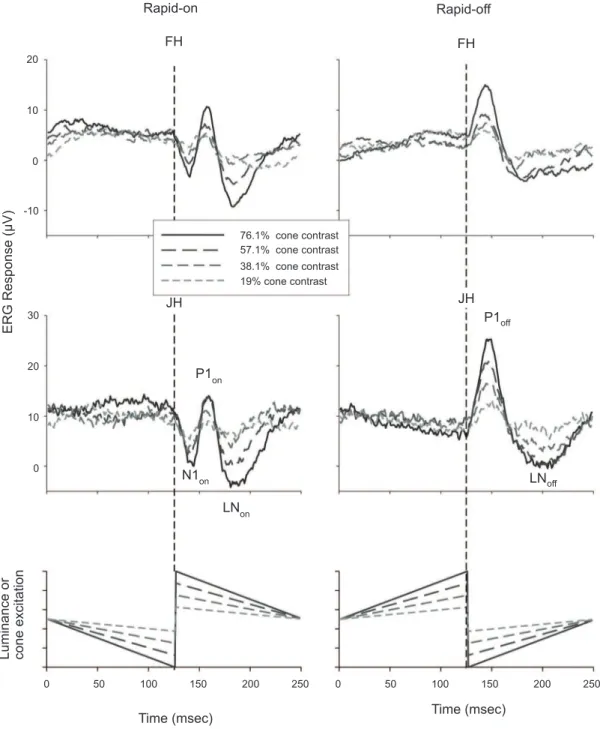
Figure 1: ERG Responses measured in two subjects to rapid-on (left plots) and rapid-off (right plots) sawtooth stimuli. The S-cone excitation was not modulated by this stimulus. L- and M-cones were modulated simultaneously in phase and with equal cone contrast. The responses to the rapid-on sawtooth stimuli display an (a-wave-like) negative N1on trough followed by a positive (b-wave-like) P1on peak and a second late negative trough (LNon). The response to the rapid-off sawtooth stimulus clearly shows a positive d-wave (P1off) followed by trough (LNoff). The dashed line indicates the time of rapid excitation transition. The
irst responses to the rapid transitions in the stimulus appear with only a few milliseconds delay.
Results
Figure 1 displays the averaged ERG responses to simultaneous in-phase sawtooth modulation of L- and M-cones presented at four different contrasts for two different subjects. Similar responses were obtained in the other subjects. In the left plots, the responses to rapid-on sawtooth modulation are presented, whereas the right plots show the responses to rapid-off ramps. Data are presented in such a manner that the rapid transitions occur in the middle of the plot (at 125 msec indicated
by the dashed lines). The responses resemble those of sawtooth luminance modulation presented previously (Alexander et al., 2003; Alexander et al., 2001; Barnes et al., 2002): rapid-on transitions elicit responses that contain a negative component (N1on; comparable to the
a-wave in the lash ERG) with an implicit time of about
20 msec followed by a positive b-wave-like peak (P1on; delay time about 40 msec) and a second (late) negative component (LNon about 70 msec after the rapid change; homologue to the PhNR). A single positive peak with a
Rapid-on
Time (msec) Time (msec)
ERG Response (µV)
Luminance or cone excitation
FH FH
JH JH
P1
P1 76.1% cone contrast
57.1% cone contrast
38.1% cone contrast 19% cone contrast
N1
LN
LN on
off
off on
on 20
10
0
-10
30
20
10
0
Rapid-off
time to peak of about 25 msec (P1off homologue to the d-wave; right plots) can be observed after the rapid-off transition. After the P1off, another trough, the LNoff, is present.
Figure 1 clearly shows that the responses to the rapid transitions in the rapid-on and rapid-off sawtooth stimuli are not mirror images of each other, indicating an asymmetry between on- and off-ERG responses. As mentioned in the Methods section, mirror-imaged responses are expected when the system leading to an ERG response is linear or involves simple contrast dependent nonlinearities (such as saturation or
thresholds) that inluence the on- and off-responses in
an identical manner.
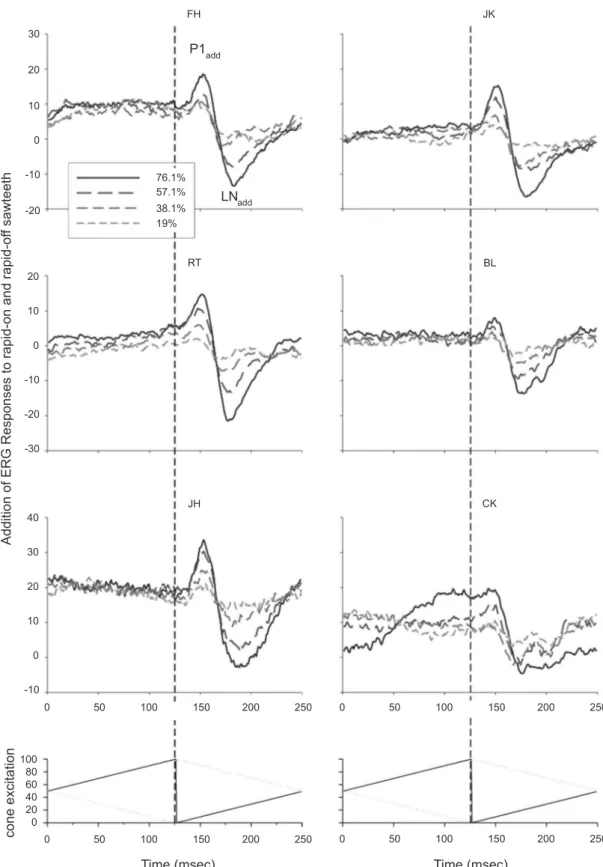
To study which ERG components are symmetrical (involving linear and simple contrast-dependent nonlinear mechanisms) and which are asymmetrical, the ERG responses to rapid-on and rapid-off stimuli were added.
In Figure 2 the response-additions are displayed for the six subjects. A positive peak (called P1add) occurs at approximately 25 msec after the rapid transition
followed by a negative delection (LNadd) about 50
msec after the rapid transition. The N1on component of the rapid-on responses partially cancelled the P1off responses, indicating that the cancelled responses are mirror images of each other. This strongly suggests that these components have identical origins (probably early in the processing pathway) and originate in linear and possibly contrast-dependent nonlinear mechanisms.
The addition of the responses reveals features that
do not cancel and relect asymmetries between the
responses to rapid-on and rapid-off ramps. I propose that these asymmetries involve differences between on- and off-pathways that most probably have post-receptoral origins (such as different numbers of on- and off-bipolar cells or rectifying nonlinearities, e.g., in the spike-generating mechanisms of the retinal ganglion cells; see Discussion). Moreover, the latencies of the P1add and the LNadd correspond to those of the b-wave and the
PhNR in the full ield lash ERG and may have similar
origins [possibly in the bipolar and retinal ganglion cells, respectively (Bush & Sieving, 1996; Viswanathan et al., 2000; Viswanathan, Frishman, Robson, Harwerth & Smith Iii, 1999; Viswanathan, Frishman, Robson & Walters, 2001)].
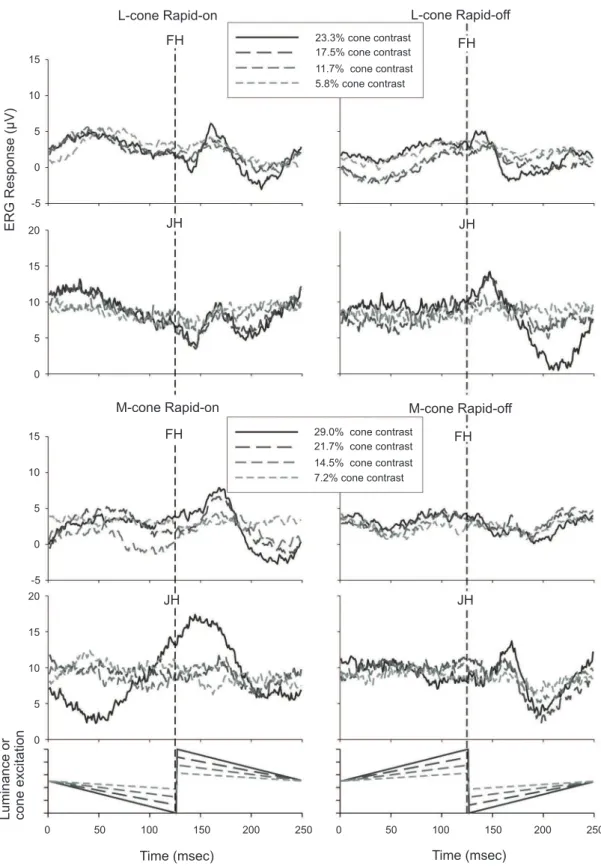
Figure 3 displays the rapid-on and rapid-off responses of the same two subjects whose responses were displayed in Figure 1 using L- and M-cone isolating stimuli. The responses are noisier than in the L+M-cone condition because the maximal possible cone contrasts (23.3% L-cone contrast; 29.0% M-cone contrast) are much smaller in the cone-isolating stimuli. Moreover, the numbers of cones that are stimulated are smaller in the cone-isolating conditions in comparison with the L+M-condition.
In addition to the differences in response amplitude, particularly the responses to M-cone-isolating stimuli have a different waveform than the responses to L+M
and to L-cone isolating stimuli. In the responses to the M-cone isolating rapid-on sawtooth stimuli an N1 is lacking. However, a small N1 can be found in the off-response. In summary, the M-on response resembles the L-off response and the M-off response resembles the L-on response. We also recently observed this in responses to M-cone isolating on- and off-responses using four primary LED stimulators (McKeefry et al. (2012) ARVO E-abstract 5710; Kremers et al. (2012) ARVO E-abstract 775).
On the other hand, the L+M-stimulus lacks a red-green component and thus mainly stimulates only two post-receptoral retinogeniculate pathways (the magnocellular pathway and the blue-sensitive koniocellular pathway). The cone isolating condition additionally stimulates the parvocellular pathway. Although the pathway leading to an ERG signal is not identical to the retinogeniculate pathways, there is evidence that there is a causal relationship between
the licker ERG and the activity in the parvo- and
magnocellular pathways (Kremers & Link, 2008; Kremers, Rodrigues, Silveira & da Silva-Filho, 2010).
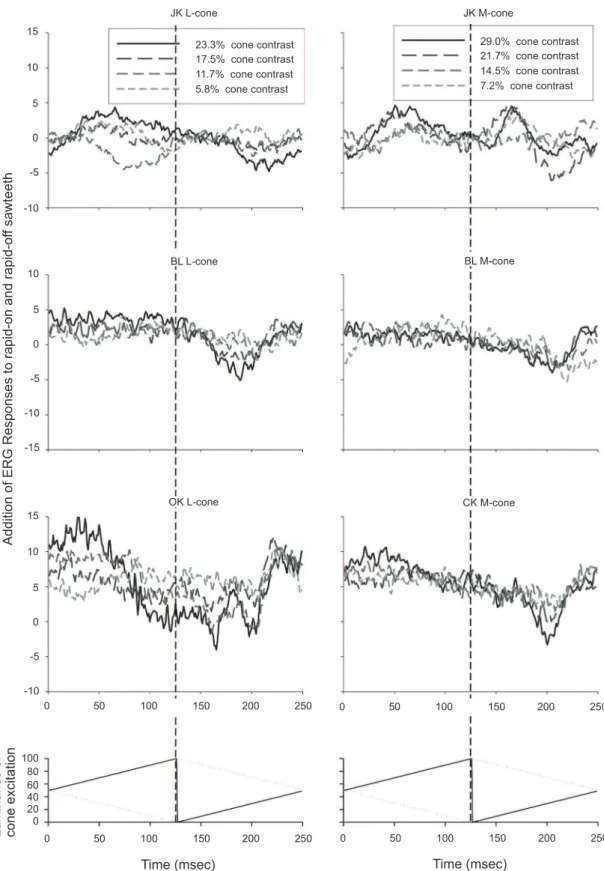
In Figure 4, the summation of the on and rapid-off responses to L- (Figure 4a) and M-cone isolating stimuli (Figure 4b) is shown, revealing the asymmetries in the responses. All subjects displayed only a small positive P1add peak in the L-cone isolating conditions, whereas for about half of the subjects a positive peak was found in the M-cone isolating conditions. The L- and M-cone isolating stimuli elicited LNadd responses that had similar amplitudes. This indicates that the LNadd responses do not depend on the number of cones
present in the retina but seem to relect post-receptoral
processing that compensates for cone numbers.
To quantify the response amplitudes in the additions, I determined the difference between the maximal potential between 0 and 46 msec after the rapid transition for the P1add and the minimal LNadd potential occurring between 0 and 125 msec after the rapid transition for all conditions and contrasts. The mean amplitudes (±s.d.) are displayed in Figure 5 as a function of cone contrast. It can be seen that the amplitude increases with increasing cone contrast. Furthermore, at similar cone contrasts the amplitudes in the three stimulus conditions are similar. I calculated individual L-/M-ratios from the ERG amplitudes using L- and M-cone isolating conditions with similar cone contrasts (23.3% L- 21.7% M-cone contrast and 17.5% L- 14.5% M-cone contrast). From the individual L-/M-ratios the mean L-/M-ratios were calculated (by calculating the logarithms of individual values before averaging the data and converting them back into a linear scale; the reason for this is that a ratio is not normally distributed, whereas its logarithm is). The mean L-/M-ratio was 1.15 for the 23.3% L-/21.7% M-cone contrasts and 1.23 for the for the 17.5% L-/14.5% M-cone contrast.
Figure 2: The addition of the responses to rapid-on and rapid-off sawtooth stimuli for the two subjects, whose responses are shown in Fig. 1, plus additional data from four other subjects. The N1on component is partially cancelled by the P1off response to the rapid-off sawtooth stimulus because the initial negative component is lacking, strongly suggesting that the cancelled response components are mainly linear, or only involve simple contrast dependent nonlinearities, and that they have similar cellular origins, probably early in the retinal processing pathway. The late trough (LNadd) is related to the two LN components in the responses to rapid-on and rapid-off sawtooth stimuli.
P1
FH JK
BL
CK RT
JH LN add
add 30
20
10
0
-10
-20
20
10
0
-10
-20
-30
40
30
20
10
0
-10
100 80 60 40 20 0
0 50 100 150 200 250 0 50 100 150 200 250
0 50 100 150 200 250 0 50 100 150 200 250
76.1% 57.1% 38.1% 19%
Time (msec) Time (msec)
Addition of ERG Responses to rapid-on and rapid-of
f sawteeth
Figure 3: L-cone driven (upper four pots) and M-cone driven (lower four plots) ERG responses measured in two subjects. The left panels display the responses to rapid-on sawtooth stimuli. The right panels show the responses to the rapid-off sawtooth stimuli.
15
10
5
0
-5
20
15
10
5
0
15
10
5
0
-5 20
15
10
5
0
0 50 100 150 200 250 0 50 100 150 200 250
Time (msec) Time (msec)
Luminance or cone excitation
ERG Response (µV)
FH
FH
FH
JH
FH L-cone Rapid-on
M-cone Rapid-on M-cone Rapid-off
L-cone Rapid-off
JH
JH JH
23.3% cone contrast 17.5% cone contrast 11.7% cone contrast 5.8% cone contrast
29.0% cone contrast 21.7% cone contrast
Figure 4a: Results of addition of the responses to rapid-on and rapid-off sawtooth stimuli for L- and M-cone isolating stimuli for the two subjects whose data are shown in Fig. 3, plus comparable data from four additional subjects. The responses are small but particularly an LNadd is present in most cases.
15
10
5
0
-5
-10
10
5
0
-5
-10
-15
30
25
20
15
10
5
100 80 60 40 20 0
23.3% cone contrast 17.5% cone contrast 11.7% cone contrast 5.8% cone contrast
29.0% cone contrast 21.7% cone contrast 14.5% cone contrast 7.2% cone contrast
FH L-cone FH M-cone
RT L-cone
JH L-cone JH M-cone
RT M-cone
0 50 100 150 200 250 0 50 100 150 200 250
0 50 100 150 200 250 0 50 100 150 200 250
Luminance or cone excitation
Time (msec) Time (msec)
Addition of ERG Responses to rapid-on and rapid-of
15
10
5
0
-5
-10
15
10
5
0
-5
-10 10
5
0
-5
-10
-15
100 80 60 40 20 0
23.3% cone contrast 17.5% cone contrast 11.7% cone contrast 5.8% cone contrast
29.0% cone contrast 21.7% cone contrast 14.5% cone contrast 7.2% cone contrast
JK L-cone JK M-cone
BL L-cone BL M-cone
OK L-cone CK M-cone
0 50 100 150 200 250 0 50 100 150 200 250
0 50 100 150 200 250 0 50 100 150 200 250
Luminance or cone excitation
Time (msec) Time (msec)
Addition of ERG Responses to rapid-on and rapid-of
f sawteeth
Figure 5: The mean (± s.d.) P1add - LNadd amplitudes measured from the added responses shown in Figs. 2 and 4 as a function
of cone contrast. Cone contrast has similar inluence on all
amplitudes although, in the cone isolating conditions, fewer cones are stimulated than in the conditions in which the two are stimulated simultaneously. Furthermore, the amplitudes in the L- and M-cone isolating conditions are similar although most subjects have fewer M- than L-cones. This suggests that cone number does not have an effect on the P1add - LNadd amplitude.
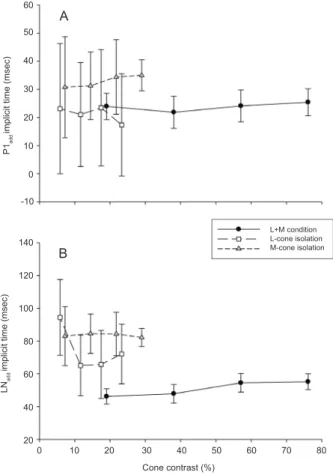
Figure 6: A: Mean P1add implicit times (± s.d.) as a function of cone contrast for the L+M stimulus condition and the M- and L-cone isolating conditions. With the L-cone isolating stimulus, a P1 was often not present. The implicit times were only measured for those responses in which a P1 component
could be identiied. Because the responses were generally
smaller and noisier in the cone isolating conditions, the variability is larger resulting in larger error bars. Cone contrast
has no clear inluence on the timing of the response. The
time to peak (implicit time) is larger in the M-cone isolating condition when compared with the L-cone condition and with the combined L+M stimulation. B: Mean LNadd implicit times (± s.d.) as a function of cone contrast for the L+M stimulus and for the two cone isolating stimulus conditions. The LNadd component is delayed in the cone isolating conditions relative to the one in the responses to simultaneous stimulus conditions. As with the P1add data, the implicit times are larger in the M-cone isolating condition than in the L-cone isolating condition. The responses in the cone isolating conditions are noisier resulting in larger standard deviations.
M-cone driven responses. The ratio between L- and M-cone driven responses at 30 Hz was found to be proportional to the ratio of L- to M-cone numbers in the retina (Brainard et al., 2000; Kremers et al., 2000). In four subjects (JK, BL, FH and RT) the measurements with 30 Hz modulation were performed (data not shown). For all four subjects, the L-cone driven response was larger than the M-cone driven response in these conditions with L-/M-ratios varying between 2.3 and 5.0. The mean L-/M-ratio with the sawtooth stimuli in these subjects was 1.26 and 1.35 for the higher and lower contrast combinations, respectively. Therefore, it seems that the ERG responses to L- and M-cone isolating sawtooth stimuli are determined by a mechanism that compensates partially for unequal numbers of cones.
The implicit times of the P1add and the LNadd components for those conditions in which amplitudes
above noise level (deined as a P1add - LNadd response
amplitude of 5 µV) could be obtained are displayed in Figures 6A and 6B, respectively. The implicit times in the M-cone isolating conditions were longer than those obtained with the L-cone isolating and the combined stimuli, suggesting that different ERG generating mechanisms are involved in these conditions. The inter-individual differences are large and only a limited number
of subjects, but a paired t-test shows a moderate signiicant
difference for the implicit time of P1add (p = 0.012).
Discussion
In the current paper the results of ERG measurements are presented using on and rapid-off sawtooth stimuli that strongly activate On- or Off-retinal pathways at the time of the rapid transition of
the sawtooth (Alexander et al., 2003; Alexander et al., 1992). The stimuli were designed to isolate the L- or M-cone responses or modulate the excitation of the two simultaneously with equal phase and contrast. None of the stimuli modulated S-cone excitation (silent S-cone substitution). A CRT screen has only three primaries, so that rod contrast cannot be controlled. To obtain full control over all photoreceptor excitations, a stimulator with four or more primaries is necessary (Pokorny, Smithson & Quinlan, 2004; Shapiro, Pokorny & Smith, 1996). In the present paper I assume that contributions of rod driven signals are small, although possibly owing
40
35
30
25
20
15
10
5
0
60
50
40
30
20
10
0
-10
140
120
100
80
60
40
20 L+M stimulation
L-cone stimulation M-cone stimulation
L+M condition L-cone isolation M-cone isolation
0 10 20 30 40 50 60 70 80
0 10 20 30 40 50 60 70 80 Cone contrast (%)
Cone contrast (%)
P1
add
implici
t time (msec)
LN
add
implici
t time (msec)
Response amplitude (P1
add
-LN
add
;µV)
A
to the abundance of rod photoreceptors, they cannot be completely excluded (Kremers et al., 2009).
The ERG responses to the rapid-on and rapid-off sawtooth stimuli were added so that any linear and simple contrast-dependent nonlinear responses (such as saturation) would cancel because they have the property that their responses to inverted stimuli are also inverted. Figure 2 shows that the response addition does not display an initial negativity, strongly suggesting that a large part of the P1off has the same cellular origin as the N1on-wave probably early in the signal processing cascade. These components are probably homologues
of the d- and a-wave in the longlash ERG. Indeed, these
components probably originate in the photoreceptors and the hyperpolarizing (off-) bipolar cells (Frishman, 2006).
The response addition can be used to extract asymmetries in the responses. The asymmetries will become more prominent the more nonlinear processes are included in the pathway leading to the ERG response. These asymmetries therefore will probably have largely
post-receptoral origins. It is dificult to speculate which
mechanisms may cause the measured asymmetries. One factor contributing to the asymmetries may be anatomical in origin: different numbers of “on”- and “off”-center bipolar and retinal ganglion cells may result in differences between “on”- and “off”-responses. Another mechanism may be the effects of intrinsic physiological rectifying nonlinearities.
The LNadd trough in the asymmetric response (Figures 2 and 4) is probably related to the photopic negative
response (PhNR) of the lash ERG, which presumably
originates in the spike-generating mechanism of the retinal ganglion cells (Viswanathan et al., 1999, 2000, 2001). Here an obvious rectifying nonlinearity is introduced because a neuron cannot generate negative numbers of spikes. As a result, an inhibiting stimulus
can only decrease the iring rate to zero. An excitatory
stimulus may result in a much larger increase in the number of action potentials so that the total number of action potentials of all (on- and off-) retinal ganglion cells increases. Such an increase would be visible both at a luminance increase (from on-cells) and a luminance decrease (from off-cells). Such rectifying nonlinearities are indeed present in the responses of retinal ganglion cells to sawtooth stimuli (Kremers, Lee, Pokorny & Smith, 1993).
Addition of responses to on and rapid-off sawtooth stimuli probably reveals response characteristics similar to the pattern ERG. In the pattern, ERG symmetric on- and off-responses are thought to be cancelled out and asymmetries in the response, mainly with post-receptoral origins, remain (Bach & Hoffmann, 2006; Luo & Frishman, 2011; Viswanathan et al., 2000). One difference between the pattern ERG and the approach in the present study is that the cancellations in the pattern ERG derive from addition of simultaneous responses from different retinal areas whereas the post hoc response additions presented here derive from
responses from the same retinal area measured at different times. Nevertheless, an experimental approach and analysis similar to ours, i.e., the addition of responses
to stimulus onset and offset of long lashes, has been
used successfully to simulate pattern ERG responses (Luo & Frishman, 2011; Simpson & Viswanathan, 2007; Viswanathan et al., 2000). Insofar as the pattern ERG has been successfully used to reveal alterations in temporal asymmetries in diseases such as glaucoma, it can be expected that this approach will prove useful in evaluation and characterization of disorders of the inner retina (Viswanathan et al., 2000; Viswanathan et al., 1999; Viswanathan et al., 2001). Indeed we recently found that the responses to sawtooth stimuli and their additions are altered in glaucoma patients (Pangeni, Lammer, Tornow, Horn & Kremers, 2012).
One advantage of the present analysis in comparison with the pattern ERG is that it is less sensitive to optical blur. This is especially important for measurements in which the optical quality is inferior. One example may be ERG measurements in mice. Nowadays many ERG responses are performed on mice, either in wild type or in animal models for retinal disorders. For example, pattern ERGs have been measured to monitor progressive retinal ganglion cell dysfunction in the DBA/2J mouse model of glaucoma (Porciatti, Saleh & Nagaraju, 2007; Saleh, Nagaraju & Porciatti, 2007). However, pattern ERGs in mice typically have very low amplitudes and thus require large numbers of averages to be able to extract a reliable response. The analysis described in the present paper may provide an alternative for the procedure of pattern ERG recordings.
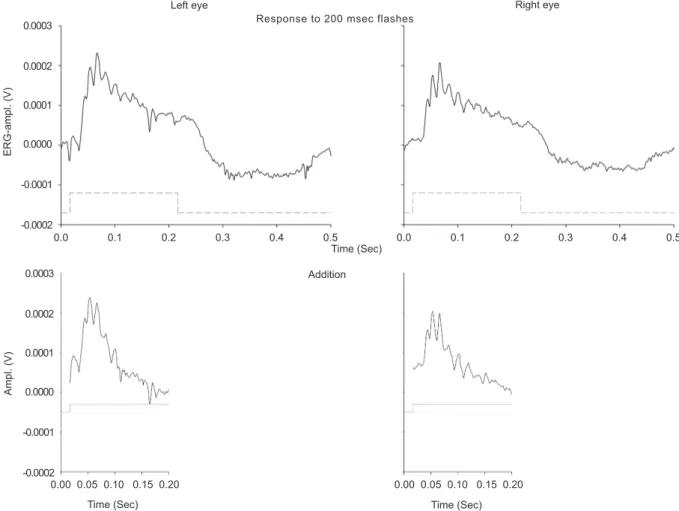
To illustrate this, in Figure 7 the responses in the
left and the right eye of a mouse to a 200 msec lash are
displayed. Details on animal treatment and recording settings have been described elsewhere (Harazny, Scholz, Buder, Lausen & Kremers, 2009). The recordings were performed with contact lens electrodes and the eyes were light adapted with a background
of 25 cd/m². The lash intensity was 133 cd/m². The
responses are averages of the ERG signals to six single
lashes. In the lower plots, the responses in 200 msec windows around lash on- and offset are summed.
It can be seen that a transient response remains. This response has an amplitude about 40 times larger than the pattern ERG measured in mice (Porciatti et al., 2007; Saleh et al., 2007). This illustrates that averaging only a
few responses (in our case six) is suficient to obtain a
reliable response with these stimulus parameters. These data are not meant to give a complete description
of long-lash ERG responses in mice. Instead, this should
Figure 7: An example of the technique of addition of rapid-on and rapid-off responses to a 200 msec pulse of light measured
in the two eyes of a C57/BL6 mouse. Responses to six lashes were averaged (top 2 panels). In the bottom panels, the results of response addition in two 200 msec windows (starting 17 msec before and 183 msec after the on- and offset of the lash) are
displayed. After addition, a transient response with superimposed oscillatory potentials remains. These responses are large and can be readily measured in the mouse, where typically pattern ERG responses are very small, requiring extensive averaging to
obtain a reliable signal. Stimulus conditions: background intensity was 25 cd/m²; lash intensity was 133 cd/m².
full ield responses), they are good approximations in
non-human primates (Luo & Frishman, 2011; Simpson & Viswanathan, 2007; Viswanathan et al., 2000) and probably emphasize responses of the inner retina.
The comparison of the responses to the cone isolating stimuli with each other and with the conditions in which the two are modulated simultaneously reveals a few interesting features. In previous measurements, using modulation at high temporal frequency, it was found that the L-cone driven responses are generally
larger than the M-cone driven responses relecting
the larger number of L-cones (Brainard et al., 2000; Kremers, Parry, Panorgias & Murray, 2011; Kremers et al., 2000). However, in Figures 4 and 5 it can be seen that the response amplitudes in the asymmetries to L- and M-cone stimuli are similar when the cone contrasts are similar. It therefore seems that the asymmetries in the ERG responses to sawtooth stimuli involve post-receptoral mechanisms that compensate for these differences in cone number so that the net L-/M-ratio manifested in the response is about unity.
There are indications that similar compensatory mechanisms are present in the parvocellular channel (Kremers, 2003, 2011; Kremers et al., 2000; Kremers, Stepien, Scholl & Saito, 2003). Perhaps the ERGs to
sawtooth stimuli relect some aspects of parvocellular
activity. Recently we found that ERG responses to 12 Hz temporal modulation containing a red-green stimulus
component relect parvocellular activity (Kremers
& Link, 2008; Kremers et al., 2010). Cone opponent mechanisms are also involved in the generation of
the b-wave in the full ield lash ERG (Kasuga, 2001;
Sperling & Harwerth, 1971; Sperling & Mills, 1991). In the L+M cone condition, no red-green component is present in the stimulus and therefore the parvocellular channel is not activated in this condition so that the ERG
cannot relect a parvocellular contribution. Although the
present research provides additional evidence now that activity of retinogeniculate pathways can be correlated
with certain aspects of the ERG, the speciic mechanisms
underlying this correlation ae unclear and need more detailed examination.
Response to 200 msec flashes
Left eye Right eye
0.0003
0.0002
0.0001
0.0000
-0.0001
-0.0002
0.0003
0.0002
0.0001
0.0000
-0.0001
-0.0002
0.0 0.1 0.2 0.3 0.4 0.5 0.0 0.1 0.2 0.3 0.4 0.5
0.00 0.05 0.10 0.15 0.20 0.00 0.05 0.10 0.15 0.20
Time (Sec)
ERG-ampl. (V)
Ampl. (V)
Time (Sec) Time (Sec)
Acknowledgements
The work was supported by DFG Grant KR1317/9-1. JK was supported by the Neuroscience Excellence Program of the Hertie Foundation. This manuscript is dedicated to two extraordinary persons: Barry Lee, who
is one of my main scientiic mentors and who showed
me what good science is, and Dora Fix Ventura, with whom I have had fantastic collaborations. I thank them for everything that was and for everything that will be.
References
Alexander, K.R., Barnes, C.S. & Fishman, G.A. (2003). ON-pathway
dysfunction and timing properties of the licker ERG in carriers
of X-linked retinitis pigmentosa. Investigative Ophthalmology and Visual Science, 44, 4017-4025.
Alexander, K.R., Fishman, G.A., Barnes, C.S. & Grover, S. (2001).
ON-response deicit in the electroretinogram of the cone system
in X-linked retinoschisis. Investigative Ophthalmology and Visual Science, 42, 453-459.
Alexander, K.R., Fishman, G.A., Peachey, N.S., Marchese, A.L. & Tso, M.O. (1992). ‘On’ response defect in paraneoplastic night blindness with cutaneous malignant melanoma. Invest.Ophthalmol Vis.Sci., 33 (3), 477-483.
Bach, M. & Hoffmann, M. (2006). The origin of the pattern electroretinogram. In Heckenlively, J.R. & Arden, G.B. (Eds.),
Principles and Practice of Clinical Electrophysiology of Vision., 2nd edition (pp. 185-196). Cambridge, London: The MIT Press.
Barnes, C.S., Alexander, K.R. & Fishman, G.A. (2002). A distinctive form of congenital stationary night blindness with cone ON-pathway dysfunction. Ophthalmology, 109, 575-583.
Brainard, D.H., Roorda, A., Yamauchi, Y., Calderone, J.B., Metha, A.B., Neitz, M., Neitz, J., Williams, D.R. & Jacobs, G.H. (2000). Functional consequences of the relative numbers of L and M cones. Journal of the Optical Society of America A, 17 (3), 607-614.
Bush, R.A. & Sieving, P.A. (1996). Inner retinal contributions to the
primate photopic fast licker electroretinogram. Journal of the Optical Society of America A, 13 (3), 557-565.
Dryja, T.P., McGee, T.L., Berson, E.L., Fishman, G.A., Sanberg, M.A., Alexander, K.R., ... Rajagopalan, A.S. (2005). Night blindness and abnormal cone electroretinogram ON responses in patients with mutations in the GRM6 gene encoding mGluR6. Proceedings National Academy of Science, 102 (12), 4884-4889.
Frishman, L.J. (2006). Origins of the electroretinogram. In Heckenlively, J.R. & Arden, G.B. (Eds.), Principles and practice of clinical electrophysiology of vision., 2nd edition (pp. 139-183). Cambridge, London: The MIT Press.
Harazny, J., Scholz, M., Buder, T., Lausen, B. & Kremers, J. (2009).
Electrophysiological deicits in the retina of the DBA/2J mouse.
Documenta Ophthalmologica.
Horn, F.K., Gottschalk, K., Mardin, C.Y., Pangeni, G., Junemann, A.G. & Kremers, J. (2011). On and off responses of the photopic
fullield ERG in normal subjects and glaucoma patients. Doc Ophthalmol, 122 (1), 53-62.
Kasuga, T. (2001). Effect of glutamate analogues on red-green opponent interaction in monkey electroretinograms. Experimental Eye Research, 73 (3), 311-320.
Kremers, J. (2003). The assessment of L- and M-cone speciic
electroretinographical signals in the normal and abnormal retina.
Progress in Retinal and Eye Research, 22, 579-605.
Kremers, J. (2011). Signal Pathways in the Electroretinogram. In
Belušič, G. (Ed.) Electroretinograms (pp. 55-78). Rijeka: InTech. Kremers, J., Czop, D. & Link, B. (2009). Rod and S-cone driven ERG
signals at high retinal illuminances. Documenta Ophthalmologica, 118, 205-216.
Kremers, J., Lee, B.B., Pokorny, J. & Smith, V.C. (1993). Responses of macaque ganglion cells and human observers to compound periodic waveforms. Vision Research, 33, 1997-2011.
Kremers, J. & Link, B. (2008). Electroretinographic responses that
may relect activity of parvo- and magnocellular post-receptoral
visual pathways. Journal of Vision, 8 (15/11), 1-14.
Kremers, J., Parry, N.R., Panorgias, A. & Murray, I.J. (2011).
The inluence of retinal illuminance on L- and M-cone driven
electroretinograms. Visual Neuroscience, 28, 129-135.
Kremers, J., Rodrigues, A.R., Silveira, L.C.L. & da Silva-Filho, M. (2010). Flicker ERGs representing chromaticity and luminance signals. Investigative Ophthalmology & Visual Science, 51, 577-587. Kremers, J., Scholl, H.P.N., Knau, H., Berendschot, T.T.J.M., Usui, T.
& Sharpe, L.T. (2000). L/M cone ratios in human trichromats assesed by psychophysics, electroretinograpy, and retinal densitometry.
Journal of the Optical Society of America B, 17, 517-526. Kremers, J., Stepien, M.W., Scholl, H.P.N. & Saito, C.A. (2003). Cone
selective adaptation inluences L- and M-cone driven signals in
electroretinography and psychophysics. Journal of Vision, 3, 146-160. Luo, X. & Frishman, L.J. (2011). Retinal pathway origins of the
pattern electroretinogram (PERG). Invest Ophthalmol Vis Sci, 52
(12), 8571-8584.
Pangeni, G., Lammer, R., Tornow, R.P., Horn, F.K. & Kremers, J. (2012). On- and off-response ERGs elicited by sawtooth stimuli in normal subjects and glaucoma patients. Documenta Ophthalmologica. Pokorny, J., Smithson, H. & Quinlan, J. (2004). Photostimulator
allowing independent control of rods and the three cone types.
Visual Neuroscience, 21 (3), 263-267.
Porciatti, V., Saleh, M. & Nagaraju, M. (2007). The pattern electroretinogram as a tool to monitor progressive retinal ganglion cell dysfunction in the DBA/2J mouse model of glaucoma.
Investigative Ophthalmology & Visual Science, 48 (2), 745-751. Rodrigues, A.R., Da Silva Filho, M., Silveira, L.C. & Kremers, J.
(2010). Spatial distributions of on- and off-responses determined with the multifocal ERG. Documenta Ophthalmologica, 120 (2), 145-158.
Saleh, M., Nagaraju, M. & Porciatti, V. (2007). Longitudinal evaluation of retinal ganglion cell function and IOP in the DBA/2J mouse model of glaucoma. Investigative Ophthalmology & Visual Science, 48 (10), 4564-4572.
Shapiro, A.G., Pokorny, J. & Smith, V.C. (1996). Cone-rod receptor spaces with illustrations that use the CRT phosphor and light-emitting-diode spectra. Journal of the Optical Society of America A, 13, 2319-2328.
Sieving, P.A. (1993). Photopic on- and off-pathway abnormalities in retinal dystrophies. Transactions of the American Ophthalmological Society, 91, 701-773.
Simpson, M. & Viswanathan, S. (2007). Comparison of uniform ield
and pattern electroretinograms of humans. Journal of Modern Optics, 54, 1281-1288.
Sperling, H.G. & Harwerth, R.S. (1971). Red-green cone interaction in the increment-threshold spectral sensitivity of primates. Science, 172, 180-184.
Sperling, H.G. & Mills, S.L. (1991). Red-green interactions in the spectral sensitivity of primates as derived from ERG and behavioral data. Visual Neuroscience, 7, 75-86.
Sustar, M., Hawlina, M. & Brecelj, J. (2006). ON- and OFF-response of the photopic electroretinogram in relation to stimulus characteristics. Documenta Ophthalmologica, 113, 43-52. Viswanathan, S., Frishman, L.J. & Robson, J.G. (2000). The uniform
ield and pattern ERG in macaques with experimental glaucoma:
Removal of spiking activity. Investigative Ophthalmology & Visual Science, 41 (9), 2797-2810.
Viswanathan, S., Frishman, L.J., Robson, J.G., Harwerth, R.S. & Smith III, E.L. (1999). The photopic negative response of the macaque electroretinogram: reduction by experimental glaucoma.
Investigative Ophthalmology & Visual Science, 40 (6), 1124-1136. Viswanathan, S., Frishman, L.J., Robson, J.G. & Walters, J.W. (2001).
The photopic negative response of the lash electroretinogram in