0103 - 5053 $6.00+0.00
Article
* e-mail: [email protected]
Sequential Injection Analysis as a Tool for On-Line Monitoring the Sorption
of Fulvic Acid onto Modified Vermiculite
Gilberto Abate,*,a Luciana B. O. dos Santos,b Sandro M. Colombob and Jorge C. Masinib
a
Departamento de Química, Universidade Federal do Paraná, CP 19081, 81531-990 Curitiba-PR, Brazil
b
Instituto de Química, Universidade de São Paulo, CP 26077, 05513-970 São Paulo-SP, Brazil
Este trabalho apresenta um sistema de injeção seqüencial associado a uma unidade de filtração tangencial e um detector na região do ultravioleta, para monitorização em linha da sorção de ácido fúlvico em duas vermiculitas modificadas. Com o sistema proposto foi possível melhorar a resolução temporal, na investigação do tempo de equilíbrio necessário para o sistema sorvente– soluto atingir o equilíbrio químico. A sorção em uma suspensão 10 g L-1 de vermiculita,
modificada por intercalação com poliidroxicátions de Fe(III) foi rápida, atingindo o equilíbrio após 4 min de tempo de contato, resultando em sorção de 97,9 % do ácido fúlvico inicialmente presente em uma solução 10 mg L-1. A sorção na suspensão 10 g L-1 de vermiculita organofílica,
obtida por troca iônica com brometo de hexadeciltrimetilamônio apresentou uma rápida taxa inicial de sorção, seguida por processos de dessorção e readsorção, atingindo o equilíbrio após 30 min de tempo de contato, com sorção de 98% do ácido fúlvico inicialmente presente em uma solução 10 mg L-1.
This paper presents a sequential injection system associated with a tangential filtration unit and an ultraviolet detector for on-line monitoring of fulvic acid sorption onto two modified vermiculites. With the proposed approach it was possible to improve the temporal resolution in the investigation of the equilibrium time needed for the system sorbent-sorbate to reach the chemical equilibrium. Sorption onto a 10 g L-1 suspension of vermiculite material modified by intercalation
of polyhydroxycations of Fe(III) was fast, reaching the equilibrium after 4 min of contact time, and resulting in sorption of 97.9 % of the initial 10 mg L-1 fulvic acid concentration. Sorption onto
a 10 g L-1 suspension of an organic vermiculite which was modified by ion exchange with
hexadecyltrimethylammonium bromide exhibited a fast initial rate of sorption, followed by desorption and re-adsorption processes, reaching the equilibrium after 30 min of contact time, with sorption of 98% of the initial 10 mg L-1 fulvic acid concentration.
Keywords: flow analysis, natural organic matter, sorption, real-time analyses
Introduction
The removal of natural organic matter (NOM) components from water supplies has demanded great attention because they are precursors of potentially carcinogenic chlorinated disinfection by-products in chlorine disinfection processes.1-3 Besides to adsorption
onto activated carbon, sorption onto clay minerals is among the main processes that have been studied aiming
the removal of NOM from aqueous medium.4-10 Humic
and Fulvic acid (HA and FA) are the major components of NOM, but HA is more easily removed from waters.
This fact has been explained by the intrinsic characteristics of humic substances such as the higher molar volume of humic acids.11 Contrary to humic acids, fulvic acids do
not coagulate even under low pH values, increasing the difficulty of their removal from aqueous medium. The lesser extent of fulvic acids sorption in comparison to humic acids has been reported for tobermorite,5 xonotlite,9
and vermiculite.12 Development of new materials for this
temporal resolution for fast surface reactions, so that real time monitoring of the free concentrations would be necessary in these cases.
Sequential injection analysis (SIA) was proposed as a robust single channel flow technique that would meet the requirements for industrial process control, with minimal needs for maintenance and recalibration.13,14 Additionally,
the system is designed to perform different liquid handling processes with minimal mechanical reconfiguration. Operations such as on-line filtration, in-line reactions, dilution, pre-concentration and standard additions have been described.15-16 Monitoring sorption processes require
separation of the solid phase, a task that can be accomplished by on-line filtration using tangential filters coupled to the SIA system, as has been previously described in the real time monitoring of nutrients and metabolites in bioprocesses.17,18
In the present paper we describe a sequential injection method for on-line monitoring the sorption of fulvic acid (FA) onto two modified vermiculite materials: the Fe(III) polyhydroxy cations intercalated vermiculite (VT-OH/Fe) and the organoclay obtained by ion exchange with the quaternary ammonium salt hexadecyltrimethylammonium (HDTMA-VT). The study revealed that the temporal resolution provided by the proposed method allows one to speculate on distinct sorption mechanisms occurring between FA and the modified clay materials.
Experimental
Apparatus and reagents
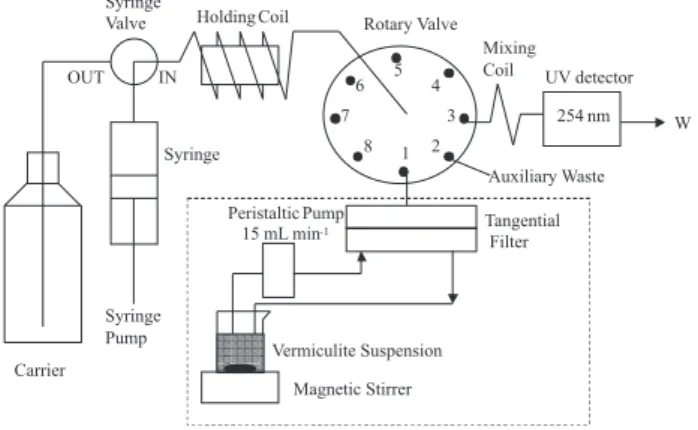
The determination of the soluble fraction of fulvic acid (FA) was automated by Sequential Injection Analysis (SIA) using a Fialab 3500 (FIAlab Instruments, Inc., Bellevue, WA) instrument according to Figure 1. Solutions were driven by a 5.00 mL syringe pump and an eight port rotary valve (Valco Instrument Co., Houston, TX). The control of the syringe pump and the rotary valve was made with the Fialab 5.0 software. The holding coil was made of 3 m of 0.8 mm i.d. Teflon (PolyTetraFluoroEthylene, PTFE) tubing. The mixing coil connecting the rotary valve to the flow cell was 27 cm long, made of 0.5 mm i.d PTFE tubing. All other tubing connections were made of 0.5 mm i.d. PTFE tubing and PTFE nuts and ferrules (Upchurch, Oak Harbor, WA). For the kinetic experiments, an auxiliary peristaltic pump was used to continuously pump the suspension through an A-SEPTM (Applikon, Schiedam, The Netherlands) tangential
filter at a flow rate of 15 mL min-1. Filtration was performed
by 0.45 mm polyvinylidene difluoride (PVDF) membranes with 47 mm of diameter from Millipore.
An SPD 6 AV UV ultraviolet flow detector from Shimadzu was used for the FA quantification employing the Workstation Class-LC 10 software for data acquisition and integration of the peak areas.
Surface area and pore volume of the modified vermiculites were obtained by BET measurements of N2 adsorption isotherms using a Gemini 2375 V5.00 instrument from Micromeritics Instr. Corp. The basal spacing was determined by X-ray diffraction (XRD) using a Siemens D-5000 diffractometer. Carbon, H and N contents of the organic vermiculite and FA were determined by elemental analysis using a Perkin-Elmer analyzer 2400. Iron content in starting and modified vermiculite was determined by flame atomic absorption spectrometry using a Perkin-Elmer 703 spectrometer after proper treatment with 5% (v/v) HCl.21
Water used in all experiments was distilled and deionized using the Simplicity 185 system from Millipore coupled to an UV lamp. All reagents used in this work were of analytical grade from Merck, Sigma or Aldrich.
Sequential injection procedure for off-line determination of fulvic acid
The procedures are based on the scheme showed in Figure 1. The first step of the procedure is to fill the holding coil and the detector UV flow cell with the carrier
solution composed by 2.5 mmol L-1 acid acetic/
flushed through the auxiliary waste represented by port 2 in Figure 1. To start the automatic analyses the syringe valve is set at position OUT and the syringe pump aspirates 700 µL of carrier solution inside the syringe at a flow rate of 500 µL s-1. Next, the syringe valve switches to position IN and, with the rotary valve at position 1, the syringe pump aspirates 20 µL of sample inside the holding coil at a flow rate of 50 µL s-1. In the final step the rotary valve switches to port 3 and the syringe pump discharge the syringe at a flow rate of 16 µL s-1, injecting the sample zone through the mixing coil and the flow cell of the UV detector. As the sample zone travels from the holding coil to the detector, it is buffered by axial dispersion in the carrier solution. The procedure is repeated three times for each sample/standard. Standard fulvic acid with concentrations 0.10, 0.25, 1.00, 2.50
and 10.0 mg L-1 were used for construction of the
analytical curve using the peak area provided by the data acquisition software.
Sequential injection procedure for on-line determination of fulvic acid
For studying the sorption kinetic, the components showed inside the dotted line of Figure 1 are used. In a closed loop system, 50.00 mL of a 10.0 mg L-1 FA solution
maintained under vigorous stirring is continuously pumped by a peristaltic pump at a flow rate of 15 mL min-1 through
the tangential filter fitted out to a 0.45 μm PVDF membrane. The outlet of the tangential filter is connected to port 1 of the rotary valve. To fill the tubing connecting the outlet of the tangential filter to the rotary valve with representative solution flowing through the closed loop, the following steps are performed: with the syringe valve at position OUT, the syringe pump aspirates 700 μL of carrier inside the syringe at 500 μL s-1. The syringe valve
switches to position IN and the rotary valve to position 1. After that, the syringe pump aspirates 150 μL of filtered sample inside the holding coil at a flow rate of 100
μL s-1. The excess of sample is flushed from the system
with 300 μL of carrier at a flow rate of 300 μL s-1 through
port 2 of the rotary valve (auxiliary waste). The rotary valve turns back to position 1 and the syringe pump aspirates 20 μL of sample (at a flow rate of 100 μL s-1) for
the holding coil. Finally, the rotary valve switches to position 3 and the syringe pump discharge the syringe at a flow rate of 16 μL s-1, injecting the sample volume and
the carrier buffer toward the detector flow cell. To start the kinetic measurements, a mass of 500 mg of the Fe(III) polyhydroxy cation intercalated vermiculite or organically modified vermiculites is added to the FA solution and,
simultaneously, the SIA system starts performing sampling and analysis of FA in the filtered solution.
Fulvic acid
The humic material was extracted from a vermi-compost material rich in organic matter, according to the protocol described by the International Humic Substances Society (IHSS). The FA was concentrated from the solutions resulting from the humic acid extraction, and
purified according to Thurman and Malcolm.19 To
protonate the ionizable sites, the FA solution was passed through a strongly acid Amberlyst15 cation exchange column in the H+ form. The concentration of FA stock
solution was 1.07 ± 0.05 g L-1, determined by dry weight
of 20.00 mL aliquots.
Vermiculite
It was supplied by Eucatex Química e Mineral Ltda, from the Massapê mine located in Paulistana, PI, Brazil, with grains < 1 mm. This material was ground, and the fraction with grain diameters between 0.27 and 56 μm was separated by decantation. Further preparation of the K+ saturated vermiculite (KVT) is described elsewhere.4
The cation exchange capacity (CEC) was determined by the method of sodium saturation,20 resulting the value of
1.17 ± 0.01 mmol g-1 (n = 3).
Intercalated vermiculite
An intercalating Fe(III) suspension was prepared by pumping 50 mL of 0.8 mol L-1 NaOH solution into 50 mL of
0.4 mol L-1 FeCl
3 solution at a flow rate of 1.0 mL min-1
using a peristaltic pump. The reaction medium was maintained under stirring while the NaOH solution was pumped, providing a 0.75:1 molar ratio of [OH–]:[Fe(III)].
The solution was maintained at 50 oC for 48 h. Next, the
KVT suspension was heated at 50 oC and the intercalating
suspension was added at a flow rate of 1.0 mL min-1 under
strong stirring, providing 10 mmol of Fe(III) per gram of clay mineral. The suspension was left to rest for 72h. Detailed description of the clay modification is given elsewhere.21 The
resulting material is denoted by VT-OH 0.75Fe.
Organic vermiculite
This modified clay mineral was prepared by cation
exchange with a 10 mmol L-1
hexadecyltrimethyl-ammonium bromide (HDTMA) solution.22 A suitable
under vigorous stirring, to a volume of HDTMA solution to provide a relations of 1:1 of the Cation Exchange Capacity (CEC) of vermiculite, previously determined as 1.17 mmol g-1. The suspensions were kept under agitation
in an orbital shaker for 24 h at room temperature, and the products were washed five times with 40 mL of deionized water, separating the solid phase by centrifugation. These organoclays were freeze-dried, crushed and dried at 60
oC for 48h. The solids were stored in a desiccator.
Results and Discussion
Characterization of the materials
Table 1 shows the characterization parameters for the materials studied. The surface area and pore volume of the intercalated clay, VT-OH 0.75Fe,was enhanced in comparison with KVT. Similarly, the basal spacing increased from 10.8 to 14.5 Å, indicating that the vermiculite interlayer space was occupied by the Fe(III) polyhydroxy cations. Furthermore, the iron contents of VT-OH 0.75Fe is almost three times larger than in KVT. On the other hand, the surface area and porosity of organically modified vermiculite were greatly reduced because of the incorporation of the HDTMA molecules, which clog up the interlayer space, hindering the N2 access to the internal surface during the BET experiments.23 The
basal spacing of HDTMA-VT1.0 was 14.4 Å. The elemental analysis is consistent with the incorporation of C, H and N in the mineral structure because these elements were not detected in the starting material (VTK). The carbon percentages indicate that there is no excess of organic cations in relation to the CEC value.
The elemental analysis of FA resulted 46.8% C, 4.0% H and 1.1 % N. The acid-base properties were studied using a discrete site distribution model,24 revealing five
kinds of ionizable groups, with pKa values of 1.9±0.1, 4.2±0.3, 5.9±0.1, 8.2±0.2 and 9.7±0.1. The concentrations of these ionizable groups were 5.8±0.4, 3.2±0.3, 1.5±0.2, 0.50±0.08 and 0.52±0.09 mmol g-1,respectively. Ionizable
species with pKa < 7 can be assigned carboxylic groups
and species with pKa > 7 can be assigned to phenolic or amine groups. Although the composition of functional groups in aquatic fulvic acids may be quantitatively different from the sample studied in the present work, the predominance of carboxylic and phenolic groups is observed for humic substances in general. As a consequence, we assumed that the sorption mechanism would not be significantly different for aquatic or terrestrial fulvic acids. This approach has also being used by other authors evaluating the performance of sorbent materials for humic acids. For example, Kaneco et al.5 studied the adsorption of humic and fulvic acids isolated from peat soil onto tobermorite, whereas Han et al.25 determined the adsorption capacity and kinetic of a commercial humic acid onto nanoporous carbon materials.
Figures of merit of the analytical method
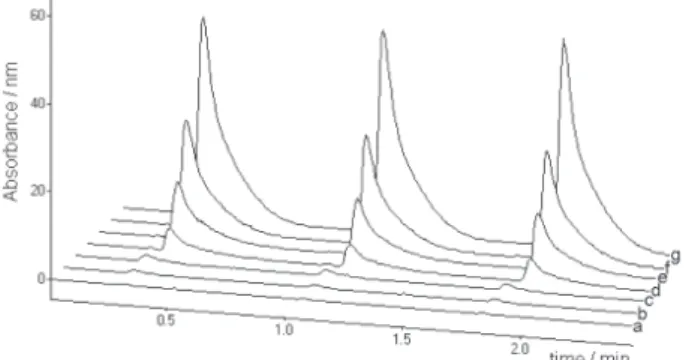
Analytical curves were prepared by monitoring the absorbance at 254 nm and integrating the peak areas (Figure 2), which exhibited a linear relation with fulvic acid concentrations between 0.10 and 10.0 mg L-1. The
linear equation was y= [(3.31± 0.04)x + (3 ± 2)].103, where y is the peak area (expressed in arbitrary units) and x is the fulvic acid concentration in mg L-1. The slope and the
intercept are mean values followed by their respective standard errors, computed from calibration curves obtained daily in four different working days. The limit
of detection (LOD) computed by the equation
LOD = 3sb
/
m was 0.020 mg L-1, where sb is the standard deviation of peak areas obtained from ten injections of the blank solution, constituted by deionized water, and m is the slope of the analytical curve. The limit of quantification (LOQ) was 0.066 mg L-1, being computed by the equation LOQ = 10sb/
m.26 Because the dissolved organic carbon (DOC) in streams and rivers range from 2 to 100 mg L-1,27 the LOD and LOQ of the proposedanalytical method, as well as its linear dynamic range, Table 1. BET Surface area, porosity, d(001), iron contents and elemental
analysis of the vermiculite materials
Sorbent Area Porosity d(001) Iron Elemental (m2 g-1) (μL g-1) (Å) (%) Analysis (%)
C H N
VT-OH0.75Fe 48.8 21 14.5 11.5±0.6 ND ND ND HDTMA-VT1.0 11.4 4.2 14.4 - 18.9 4.11 1.18
KVT 31.4 14 10.8 4.0±0.1 ND ND ND
ND = Not Determined.
Figure 2. SIA readoutsat 254 nm forFA concentrations of 0 (a); 0.10
(b); 0.25 (c); 0.50 (d); 1.0 (e); 5.0 (f) and 10.0 (g) mg L-1. Absorbance
are suitable to investigate the removal of fulvic acid. Considering an initial FA concentration of 10 mg L-1 and
the LOQ of 0.066 mg L-1, adsorption percentages as high as 99.3% can be quantified by the proposed method. The sampling throughput is 72 analyses per hour, allowing one to obtain detailed kinetic profile for the FA adsorption, as will be shown in the next section.
Sorption of fulvic acid
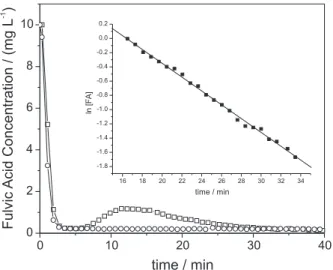
Figure 3 shows that, for VT-OH 0.75Fe, an equilibrium FA concentration is reached within 4 min of contact time, remaining constant until the end of the experiment. The suspension pH drops from 4.37 at the time just after mixing the FA solution with the modified clay to 3.78 after 60 min of contact time. The intercalation caused a significant enhancement of FA adsorption in comparison with the starting KVT material, for which the FA adsorption was negligible. This enhancement may be explained by the increase of surface area, basal spacing and porosity of the modified vermiculite. Additionally, interaction between both materials may occur by specific interactions involving surface coordination of carboxylate and phenolic groups to the Fe(III) species incorporated in the clay interlayers. The equilibrium FA concentration was 0.21 ± 0.01 mg
L-1 (n=45 measurements), implying in 97.9% of FA
removal from the solution.
For HDTMA-VT1.0, Figure 3 shows a sorption profile similar to the one observed for VT-OH 0.75Fe during the first 5 min of contact time, but after 7.5 min a perceptible FA desorption is observed, reaching a maximum solution
concentration of 1.18 mg L-1 at 12 min, remaining
approximately constant until about 16 min. After this desorption process, the soluble concentration of FA decreases slowly, suggesting a slow diffusion process of FA through the layers of HDTMA phase adsorbed onto the surface of the clay mineral. This re-sorption process follows a first order kinetics, as evidenced by the insert in Figure 3, with a rate constant of 0.097 ± 0.001 mg L-1
min-1 (n=3). In this case the pH of the suspension decreased
from 6.55 just after mixing, to 5.45 after 1 h of contact time. The equilibrium concentration was determined with the last 9 measurements (Figure 3), at contact times between 32 and 40 min, resulting the value of 0.20 ± 0.02 mg L-1, which implies in 98% of FA adsorption.
Zhao and Vance,28 based on a previous paper by Xu
and Boyd,29 have attributed the high affinity of humic and
fulvic acid to HDTMA modified montmorillonite to a slight excess of organic cation retained by the organic clay via hydrophobic bonding, causing a charge reversal. The extra positive charge would contribute to retention of hydrophilic fulvic acid by the organoclays. Xu and
Boyd29 demonstrated that for HDTMA to CEC ratios
higher than 0.5 a significant contribution of hydrophobic adsorption is likely to occur because of the limited access of HDTMA molecules to interlayer sites, resulting in dense packing of HDTMA even at low loading levels, leading to lateral tail to tail HDTMA interactions. Thus, even for HDTMA to CEC ratios lower than 1, the occurrence of these tail to tail hydrophobic interactions is possible, resulting free positive charges that can interact with the negative carboxylate groups of FA. Xu and Boyd29 also
demonstrated that hydrophobic interactions between HDTMA molecules and soils are reversible, so that the release of FA observed in the present study might be explained by desorption of FA-HDTMA molecules. The re-sorption mechanism is not clear, but it is possible that HDTMA molecules desorbed from the solid phase may neutralize the negative charges of FA, forming neutral species that might be sorbed again by the organic phase strongly bound to the solid material.
Conclusions
The high temporal resolution allowed by the sequential injection systems coupled tangential filtration has already been explored for environmental monitoring.30
In the present paper this methodology was proven to be also suitable to investigate sorption processes. Both modified vermiculites were efficient sorbents for FA, although the VT-OH 0.75Fe has a technological advantage because the equilibrium is reached quickly and no significant desorption was observed under the Figure 3. Solution concentrations of FA as a function of the contact time
with (c) VT-OH 0.75Fe and ( ) VT-HDTMA1.0. Initial FA concentra-tion = 10.0 mg L-1. The insert shows that re-sorption of FA onto
experimental conditions used. The SIA system with UV detection was an efficient tool to monitor the sorption of FA onto both modified materials, allowing us to obtain real time solution concentrations of the sorbate. The approach proposed in the present work is fast and less expensive than determining the dissolved organic carbon using Total Organic Carbon (TOC) analyzers, instruments that are based on combustion of the organic matter followed by infrared detection of evolved CO2.
Acknowledgments
Authors are grateful to FAPESP, CNPq and CAPES for financial support and fellowships.
References
1. Rook, J.J.; J. Water Treat. Exam. 1974, 23, 234.
2. Rook, J.J.; Environ. Sci. Technol.1977, 11, 478.
3. Carvalho, E.R.; Martin-Neto, L.; Millori, D.M.B.P.; Rocha, J.C.; Rosa, A.H.; J. Braz. Chem. Soc.2004, 15, 421.
4. Abate, G.; Masini, J.C.; Colloids Surf. A 2003, 226, 25.
5. Kaneco, S.; Itoh, K.; Katsumata, H.; Suzuki, T.; Masuyama, K.; Funasaka, K.; Hatano, K.; Ohta, K.; Environ. Sci. Technol.
2003, 37, 1448.
6. Teermann, I.P.; Jekel, M.R.; Water Sci. Technol. 1999, 40, 199.
7. Hagare, P.; Thiruvenkatachari, R.; Ngo, H.H.; Sep. Sci. Technol.
2001, 36, 2547.
8. Juhna, T.; Klavins, M.; Eglite, L.; Chemosphere 2003,51, 861.
9. Katsumata, H.; Kaneco, S.; Matsuno, R.; Itoh, K.; Masuyama, K.; Suzuki, T.; Funasaka, K.; Ohta, K.; Chemosphere2003,
52, 909.
10. Katsumata, H.; Kaneco, S.; Kasai, H.; Itoh, K.; Masuyama, K.; Suzuki, T.; Funasaka, K.; Ohta, K.; Environ. Eng. Sci.2004,
21, 341.
11. Vermeer, A.W.P.; Koopal, L.K.; Langmuir1998, 14, 4210.
12. Jelinek, L.; Inoue, K.; Miyajima, T.; Chem. Lett.1999, 65.
13. Ruzicka, J.; Marshall, G.D.; Anal. Chim. Acta1990, 237, 329.
14. Christian, G.D.; Analyst1994, 119, 2309.
15. Galhardo, C.X.; Masini, J.C.; Anal. Chim. Acta2001, 438, 39.
16. Silva, M.S.P.; Masini, J.C.; Anal. Chim. Acta 2002, 466, 345.
17. Masini, J.C.; Baxter, P.J.; Detwiler, K.; Christian, G.D.; Analyst
1995, 120, 1583.
18. Shu, H.C.; Hakanson, H.; Mattiasson, B.; Anal. Chim. Acta
1995, 300, 277.
19. Thurman, E.M.; Malcolm, R.L.; Environ. Sci. Technol.1981,
15, 463.
20. Hesse, P.R.; A Textbook of Soil Chemical Analysis, John Murray
Publishers: London, 1971.
21. Abate, G.; Masini, J.C.; J. Agric. Food Chem.2005, 53, 1612.
22. Abate, G.; Masini, J.C.; J. Braz. Chem. Soc. 2005, 16, 936.
23. Bartelt-Hunt, S.L.; Burns, S.E.; Smith, J.A.; J. Colloid Interface Sci.2003, 266, 251.
24. Masini, J.C.; Abate, G.; Lima, E.C.; Hahn, L.C.; Nakamura, M.S.; Lichtig, J.; Nagatomy, H.R.; Anal. Chim. Acta1998, 364,
223.
25. Han, S.; Kim, S.; Lim, H.; Choi, W.; Park, H.; Yoon, J.; Hyeon,
T.; Microporous Mesoporous Mater. 2003, 58, 131.
26. Miller, J.C.; Miller, J.N.; Statistics for Analytical Chemistry,
2nd ed., Ellis Horwood Series in Analytical Chemistry:
Chichester, 1988.
27. Buffle, J.; Complexation Reactions in Aquatic Systems, an
Analytical Approach;Ellis Horwood Series in Analytical
Chemistry: Chichester, 1990.
28. Zhao, H.; Vance, G.F.; Water Res.1998, 32, 3710.
29. Xu, S.; Boyd, S.A.; Environ. Sci. Technol.1995,29, 312.
30. Hanrahan, G.; Gledhill, M.; Fletcher, P.J.; Worsfold, P.J.; Anal.
Chim. Acta 2001, 440, 55.
Received: August 15, 2005 Published on the web: March 10, 2006