Printed in Brazil - ©2004 Sociedade Brasileira de Química 0103 - 5053 $6.00+0.00
Article
* e-mail: [email protected]
Vibrational Spectra of Bis(dmit) Complexes of Main Group Metals:
IR, Raman and
Ab Initio
Calculations
Glaucio B. Ferreiraa, Nadia M. Comerlatoa, James L. Wardella and Eduardo Hollauer*,b
a
Instituto de Química, Universidade Federal do Rio de Janeiro, CP 68563, 21945-970 Rio de Janeiro - RJ, Brazil
b
Instituto de Química, Universidade Federal Fluminense, Outeiro de São João Batista s/n, Centro, 24210-130 Niterói - RJ, Brazil
Este trabalho apresenta uma investigação teórico-experimental dos espectros infravermelho/ Raman de diversos metais representativos coordenados com 1,3-ditiol-2-tiona-4,5-ditiolato (dmit), a saber [NEt4]2[Zn(dmit)2], [NEt4][Sb(dmit)2] e [NEt4][Bi(dmit)2]. Os espectros IV/Raman de todos os sólidos e também o espectro IV em solução do composto [NEt4]2[Zn(dmit)2] foram registrados de 4000 a 100 cm-1. Duas regiões foram claramente identificadas: abaixo de 380 cm-1 os modos
apresentaram forte contribuição metal-ligante, e acima, os modos indicaram majoritária contribuição do ligante. Os espectros IV/Raman do NEt4Br também foram registrados. As bandas vibracionais foram atribuídas a partir da análise de compostos relacionados, de publicações prévias e comparadas com amplo conjunto de cálculos ab initio realizados com diversos ECPs (SBK, Sttutgart), conjunto de bases (com e sem funções d) e metodologias (RHF, DFT e MP2). As geometrias, freqüências e intensidades foram calculadas e comparadas com as freqüências experimentais visando atribuições seguras. Assim, uma excelente concordância foi obtida para diversas bandas experimentais.
This work reports a theoretical-experimental investigation of the infrared/Raman vibrational spectra of several metal 1,3-dithole-2-thione-4,5-dithiolate (dmit) complexes; [NEt4]2[Zn(dmit)2], [NEt4][Sb(dmit)2] and [NEt4][Bi(dmit)2]. IR/Raman spectra of all the solids and the solution IR spectrum of [NEt4]2[Zn(dmit)2] were recorded from 4000 to 100 cm-1. Two regions were clearly
identified: below 380 cm-1, the modes presented significant metal-ligand contributions, and above,
the modes indicated major ligand contributions. IR/Raman spectra of NEt4Br have also been recorded. The vibrational bands have been assigned starting from the analysis of related compounds, of previous published spectra and compared to several ECPs (SBK, Stuttgart), basis sets (with and without functions d) and methodologies (RHF, MP2 and DFT). Geometries, frequencies and intensities were calculated and compared to the experimental frequencies seeking secure assignment. Thus, an excellent agreement was obtained for several experimental bands.
Keywords: IR, Raman, ab initio, RHF, DFT, MP2, dmit complexes, Zn, Sb, Bi
Introduction
The syntheses and properties of metal complexes with 1,2-dithiolato-polysulfido ligands have been intensely studied1-3 particularly since the discovery, by Cassoux and
co-workers4 in 1986, of the first metallic molecular
superconductor, [TTF][Ni(dmit)2]2, where dmit is the 1,3-dithiole-2-thione-4,5-dithiolate ligand. Presently dmit ligand complexes are the best studied.
The publication of Cassoux and co-workers4 seminal
paper led a new impetus for the study of the applications
of metal dmit compounds as super-conducting complexes, materials with non-linear optical properties and materials for electronic molecular devices. Such properties arise in part, from the rich redox chemistry of these compounds and the large polarizability of sulfur atoms.
An additional important feature for the super-conducting property on metal bis(dmit) complexes, such as [TTF][Ni(dmit)2]2, is the planar geometry of the anions,3-5
2-which allows the formation of one and three-dimensional packing stacks in the solid state. However, a wide range of symmetries, coordination shells and solid state arrangements have been reported for [M(dmit)2]y/x- in ionic [Q]
x[M(dmit)2]y/x
species [e.g., Q = onium cation].1-15 For instance, D
2d symmetry
is present in Cu(II) and Zn(II) complexes, D2h symmetry in Ni(II) complexes and C2 symmetry for complexes of the Group 15 elements, Sb and Bi, in their trivalent oxidation state.
Despite the large volume of work on metal-dmit complexes, very few efforts have been devoted to the interpretation of their spectroscopic features. Actually most of the reported IR and Raman spectra have been used essentially for identification and characterization purposes.18-24 A full vibrational assignment of the IR and
Raman spectra for most of the metal-dmit complexes is now required to assess features of the charge-transfer process and the superconductivity properties. Therefore we are presently starting a careful analysis of IR and Raman spectra concerning fundamental vibrational assignment, overtones, combination bands, and extensive ab initio calculations of all such properties. Such information is considered to be essential in providing a clear understanding of properties such as local symmetry and the crystal environment, inter and intra-molecular charge-transfer processes and its correlation to the molecular and crystalline vibration spectra. The main goal of the work now reported was to study the vibrational spectra of the representative metal bis(dmit) complexes, [NEt4]2[Zn(dmit)2], [NEt4][Sb(dmit)2] and [NEt4][Bi(dmit)2], and to provide a full assignment of their
IR and Raman bands, assisted by ab initio calculations
carried out with different effective core potentials, basis sets and calculation levels. Up to now, the only species
previously studied with ab initio calculations and Raman
spectroscopy were TTF[Ni(dmit)2]2, TTF[Pd(dmit)2]2 and the neutral [M(dmit)2] (M = Ni, Pd, Pt).20-22 A low resolution
Raman spectrum of [NEt4]2[Zn(dmit)2] has been previously reported;24 however it suffered from sample decomposition
in the laser beam.
The choice of bis(1,3-dithiole-2-thione-4,5-dithiolato)-zincate, -antimonate and -bismuthate complexes presents a very convenient probe for family behaviour study. All
the crystal structures of these complexes are known,6-15
including those of the tetraethylammonium salts, a family showing an increasing degree of inter-anion interactions from the Zn to Bi complex. Therefore we could assess M-S inter-anion interactions in the solid state, by carefully comparing the gas-phase calculation to the solid-state bulk
spectra of these systems. The [Zn(dmit)2]-2 anions in
complex salts [Q]2[Zn(dmit)2] (Q = NEt4, NBu4, ferrocenyl-CH2NMe3, 1,4-Me2-pyridinium, PPh4 and AsPh4)6-9 in the
solid state, invariably have distorted tetrahedral
geometries, and four coordinate zinc centres, with no anion-anion interactions apart for very weak S---S contacts close to its van der Waals radii sum. The distortion from an ideal zinc tetrahedral coordination is a consequence of the near
95o bite angles of the chelating dmit ligands. Each dmit
ligand is symmetrically coordinated, or nearly so, to zinc, with the Zn-S bond lengths for all compounds falling in the narrow range of 2.3285(8) to 2.3522(10)Å. While the cation, Q, has little or no effect on the zinc coordination geometry, the overall shape of the anion, and also the extent of the S---S contacts, do vary with Q.
The situation is different in the case of the anions in [Q][M(dmit)2] (M = Sb10-12 or Bi13-15): here there are
metal-sulfur inter-anion interactions, that raise the coordination number of the metal to 6, and that including the lone pair on the metal, provide highly distorted pseudo pentagonal bipyramidal geometries for Sb and Bi. While the cation, Q+,
in each of the series, influences the anion arrangements and also the very weak S---S inter-anion interactions, the basic geometries about each of the two metals remain unaffected. The inter-anion M-S interactions, either with thiolato or thione S atoms, are considerably weaker than the intra-anion M-S bonds. As each of the dmit ligands is asymmetrically bound to the metal, three distinct regions of M-S bond lengths are found. For [Q][Sb(dmit)2] (Q =NEt4, PPh4 and AsPh4), the Sb-S bond lengths fall into the ranges: 2.4679(18) to 2.527(3), 2.6047(15) to 2.7311(6) [both intra anion bonds] and 3.271(4) to 3.5495(15)Å [inter-anion bond]. For [Q][Bi(dmit)2] (Q = NEt4, NBu4 and Ph4As), the Bi-S bond lengths fall into three groups: 2.5872(10) to 2.527(3), 2.7299(11) to 2.87(1) [both intra bonds] and 3.0391(14) to 3.4628(13)Å [inter bonds]. Comparisons of the bond lengths suggest that the inter-anion interactions are relatively stronger for Bi than for Sb.
Experimental
Compounds
The complexes [NEt4]2[Zn(dmit)2],7 [NEt
4][Sb(dmit)2]12
and [NEt4][Bi(dmit)2]15 were obtained through well known
published procedures. All complexes had physical properties, melting point and elemental analysis in agreement with the published values. A commercial sample of tetraethylammonium bromide was used as received.
Ab initio calculations
are robustness, reliability, facility to use, and economical,
i.e., it must be executed on personal computers presently
available. Therefore, it should employ ECPs with double-zeta basis function set easily available with RHF, DFT or, at most, MP2 methodologies.
Previous experiences showed that minimal basis provide unreliable frequencies and assignments while triple-zeta plus polarization led to intense geometry corrections but minor frequency switches when compared to our results. Considering the excessive costs and minor modifications we shall explore a compact easy-to-use ECP + double-zeta + polarization scheme along this work.
The calculations employed the programs GAMESS R525 on a Red Hat 7.3 Linux cluster and the Gaussian 9826
on a Window platform. The 6-31G basis set was employed for all elements except the central metallic atom. This basis set was chosen due to our previous experience with this basis set in several vibrational studies carried out in this
group.33,34 This experience shows most frequencies
regularly scaled by a factor of 0.8953.33 For the central
metal atom, different basis set were tested. In the SBK calculation, the compact effective pseudopotential of Stevens et al.27 with double-zeta basis set was employed
for the metal atom. We also applied this basis set extended
with metal d functions (SBKd). In the Stuttgart28
pseudopotential/basis set, the electron core potential (ECP) from Stuttgart University was used.
Three alternative methods were studied: restricted Hartree-Fock calculations (RHF), Moller-Plessett perturbation theory of second order (MP2), and the functional density theory (DFT-B3LYP) by employing the B3 potential for the coulomb and LYP for the exchange correlation term. All calculations started with SCF convergence, geometry optimisation and after obtaining a stable minimum, the frequencies were calculated. This minimum was accepted as long as no imaginary molecular frequencies were detected. Once the normal modes were obtained, the IR and Raman intensities were evaluated. All modes were visually characterized through the
graphical MOLDEN 3.7 and Molekel programs.29,30
These calculations provide qualitative and quantitative consistent results for each of the three complexes. For this reason, only tables and figures related to the SBKd ECP/ basis set will be presented. However, whenever a significant difference is observed between the different ECPs, this will be indicated in the text.
Vibrational spectra
The infrared spectra, from 4000 to 150 cm-1, were
recorded in CsI pellets using a Nicolet Magna-IR 760
Fourier transform instrument at room temperature, with a 4 cm-1 resolution. The FT-IR spectrum of [NEt
4]2[Zn(dmit)2],
from 4000 to 600 cm-1, was also recorded in
dichloro-methane solutions [concentrations: 5, 2 and 0.5 m/v]. Raman spectra were obtained as powder in glass capillaries on a Nicolet FT Raman 950 spectrophotometer. The spectra were recorded at room temperature with a germanium detector, maintained at liquid nitrogen temperature and using 1064.0 nm radiation, generated by
a Nd-YAG laser with a resolution of 2 cm-1. The samples
were exposed to an average of 500 to 800 mW of laser intensity during the spectral recording.
Results
[Zn(dmit)2]-2 geometry optimization
The [Zn(dmit)2]-2 anion, of D
2d symmetry, has the highest
symmetry found among the studied anions. The absence of significant interactions with neighbour dmit units should result in reduced environment effects in the IR and Raman spectra.
Figure 1 presents the [Zn(dmit)2]-2 optimized structure
and its atomic numbering scheme. Table 1 lists the main geometrical parameters obtained from the geometry optimization with the basis SBKd at RHF, DFT and MP2 level: no significant differences were found between the gas phase calculated values and those obtained in the crystal structure determination. Calculated parameters using the Stuttgart effective core potential were similar and hence are not displayed here. As the ligands share the same basis sets, any difference between these calculation procedures will result from the metal ECP and its basis set. Zn(II) has a filled d shell and provides its unoccupied 4s and 4p orbitals for binding to the ligands. Therefore the most important electrons in the Zn-S bonding must arise from the ligands.
Calculations using the MP2 methodology provide Zn-S bond lengths closest to those determined experimentally. Furthermore, intra-ligand bond lengths increase and the Zn-S bond length decrease in going from the RHF to the MP2 and DFT calculations. This might be an indication that the main correlation energy process is related to the electronic delocalization from the dmit ligands toward the central metallic atom.
Figure 1. Three-dimensional representation of complex anion
[Zn(dmit)2]-2 experimental frequencies
All the IR/Raman peaks associated with the [NEt4]+
cation were found in the spectra of the complex,
[NEt4]2[Zn(dmit)2], see electronic supplementary
information. The anion, [Zn(dmit)2]-2, belongs to the D 2d
point group. By analyzing the molecular cartesian displacement representation and its irreducible composition, all genuine vibrations are given by: Γvibration
= 8A1 + 2A2 + 3B1 + 8B2 + 12E. Therefore 45 vibrational
modes are expected, from which 32 are infrared active (B2
and E) and 43 Raman active (A1, B1, B2 and E). A Raman spectrum of solid [NEt4]2[Zn(dmit)2] has been published.24
Unfortunately, the complex decomposed in the laser beam with a 10 to 800 mW output and the use of an indium-gallium-arsenic (InGaAs) detector only led to a low resolution spectrum. In our work, the use of a germanium detector and a lower laser intensity lead to a higher resolution spectrum, without decomposition.
The infrared absorption spectrum and the Raman scattering spectrum of solid [NEt4]2[Zn(dmit)2] are shown in Figures 2 and 3. Several main spectral features should
be noted. The intense band at 1417 cm-1 was assigned by
Cassoux3 to the C=C ligand stretching vibration. Between
1060 and 1010 cm-1, two very intense bands at 1059 and
1039 cm-1 were assigned as C=S terminal stretching. These
bands are generally used to confirm the presence of dmit
ligands in complexes.7,8 Other assignments are: bands at
995 and 887 cm-1 to C-S stretches, the low intensity band
at 524 cm-1, a breathing mode of the heterocycle dmit
Table 1. Main geometrical parameters for the complex anion
[Zn(dmit)2]-2 with ab initio calculations and the SBKd basis set
RHF DFT MP2 Exp.7
Bond (Å)
S16=C14 1.7055 1.7154 1.7274 1.6590 S11-C14 1.7706 1.7995 1.8057 1.7210
S11-C7 1.8338 1.8499 1.8475 1.7520
S3-C7 1.8064 1.8035 1.8200 1.7415
C6=C7 1.3285 1.3607 1.3730 1.3540
Zn-S3 2.4473 2.4251 2.3903 2.3503
Bending (º)
S11C14S16 123.8 124.2 124.0 123.7
C7S11C14 97.7 98.3 98.1 98.4
S11C7C6 116.1 115.8 115.9 115.3
ZnS3C7 96.1 95.6 95.2 95.9
S2ZnS3 118.6 117.7 116.6 115.9
S2ZnS5 118.6 117.7 116.6 116.7
S2ZnS4 118.6 117.7 116.6 119.4
S3ZnS4 118.6 117.7 116.6 113.1
Dihedral (º)
ZnS3C7C6 0.0 0.0 0.0 3.3
S3C7S11C14 180.0 180.0 180.0 177.6 C7S11C14S16 180.0 180.0 180.0 179.4
Figure 3. Vibrational Raman spectrum of the metal complex salt [NEt4]2[Zn(dmit)2]: (a) 4000-600 and (b) 600-150 cm-1.
complex, and the bands below 500 cm-1, to angular
deformation and Zn-S stretching modes.
Similar bands are found between 500 and 140 cm-1 in
both the IR and the Raman spectra, e.g., the band at 524/ 525 cm-1, that is probably related to an E vibrational band.
An intense band at 461 cm-1 with a low intensity shoulder at
450 cm-1 in the infrared spectrum corresponds to the single
band at 465 cm-1 in the Raman spectrum. At 388 cm-1 (IR) and
at 390 cm-1 (Raman), low intensity bands were observed. A
band is observed at 349 cm-1 in the Raman spectrum. A
central band is observed at 314 cm-1 in the IR spectrum,
with shoulders at 322, 306 and 300 cm-1, while in the Raman
spectrum, only a single band at 306 cm-1 is observed. The
bands at 249 cm-1 (IR) and 247 (Raman) have not been
assigned. A very strong band at 195 cm-1 in the IR spectrum
corresponds to the low intensity Raman band at 198 cm-1.
Similarly, a weak IR band at 158 cm-1 corresponds to the
strong band at 161 cm-1 in the Raman spectrum.
Several low intensity bands between 2100 and
1700 cm-1 in the IR have been assigned as overtone and
combination bands, e.g., the 2065, 1986 and 1776 cm-1
bands have wavenumbers twice those at 1039, 995 and 888 cm-1, respectively. Furthermore, the 2081 and 1880 cm-1
can be considered as the combination of 1059, 1039 and 1417, 461 cm-1 bands.
[Zn(dmit)2]-2 frequency calculations
Calculations have employed two different basis sets and ECPs (SBKd and Stuttgart) and three different methodological levels (RHF, DFT and MP2) for the vibration spectra calculation. Intensities were calculated for the infrared and Raman spectra. All frequencies showed real modes as expected for an equilibrium geometry. The results are presented on Table 2, where the following conventions should apply over all article: ν = stretching mode, σ = scissoring mode, τ = twisting mode, ω = wagging mode, ρ = rocking mode, φ = torsion, χ = out of plane.
The most noticeable observation concerns the constancy of the results with the different calculation methods. Even in the low frequency vibrational modes related to the Zn-S stretching frequencies, the order and intensity of bands do not change either with the basis sets or with the methods. As expected, RHF calculated frequencies are greater than found experimentally, but with scaling factors smaller than those reported in the literature for most vibrations.33,34 An exception
is the C=C stretching frequency which was calculated to be 20% greater. For the low frequency modes, the results are remarkable, with most vibrations showing differences less than 1% of the experimental results. DFT and MP2 calculations overestimated most of the stretching vibrations,
as expected, however in these cases the error was less than 7% for the DFT-B3LYP and 3% for the MP2 method. Other frequencies showed a slight tendency to be under estimated. It is remarkable that for all calculations, the same ordering of the vibrational modes was obtained, with the
exceptions for the angular deformation ω(SCtS)
out-of-plane at 515 cm-1 in the RHF and 445 cm-1 in the MP2
calculation and in the case of χ(SC=CS) out-of-plane in
the C=C bond at 306 cm-1 in the RHF calculation. Such
consistent ordering allowed the assignments of several bands not previously mentioned in the literature. Among
these are the Zn-S stretching modes at 314 and 306 cm-1,
the Zn-S stretching coupled to the σ(SC=S) bending at
248 cm-1 and the dmit bending around the zinc
coordination at 195 and 158 cm-1, where the first mode
was clearly assigned as asymmetric bending. Modes
between 350 and 320 cm-1 were readily assigned to the
ligand in-plane bending with a small metal participation. A mode of medium intensity, not previously assigned, was the dmit ring SCtS bend at 461 cm-1, an useful mode for the
dmit ring identification.
Between 1100 and 990 cm-1,the experimental spectra
show three intense bands assigned as C=S stretching modes. However, theoretical calculations show a pair of a1 / b2
bands at 1057/1055 cm-1 and a pair of degenerate e bands
at 1038 cm-1 at RHF infrared spectrum.
According to previous studies,24 the assignment of these
bands is not an easy task. A tentative assignment defines
these three bands at 1059, 1039 and 995 cm-1 as C=S
stretch, C-S stretch and SCtS angular deformation and an
overtone of C-S stretch, respectively.24 Other possibility
would be the first as C=S stretch combined with SCS angular deformation, the second would be C=S and C-S stretch combined to the ring deformation, leaving the last
unassigned.24 Another possibility would consider
crystalline network splitting of the e modes, not previously mentioned.
In order to explore the problem we recorded the infrared spectra in dichloromethane solution, which showed three bands with similar wavenumbers, with the central (1039 cm-1) being the most intense. The presence of similar bands
in solution discards any suggestion of crystalline net effect in this multiplet. Therefore, we assign this band as an asymmetrical C=S stretching while the other bands were
assigned as symmetrical C=S stretching and the e C-S
stretching modes. This assignment is consistent with a related unpublished work where we synthesized the corresponding dmio complex (C=S changes to C=O),
observing that bands at 1039/1059 cm-1 disappear.
1059 cm-1, an asymmetrical C=S stretching at 1039 cm-1
and a C-S stretching at 995 cm-1.
[Sb(dmit)2]-1 geometry optimization
The individual anion [Sb(dmit)2]-1 in [NEt
4][Sb(dmit)2]
in the solid state has C2 symmetry. Figure 4 represents the optimised structure of the [Sb(dmit)2]-1 and its atomic
numbering scheme, while Table 3 lists the structural data
obtained from the SBKd calculation using the three methods. All of which provided similar results, except for the dihedral angle SbSCC that presented a difference among the DFT method in comparison with the RHF and
MP2 methods. The calculated optimised C2 gas phase
structure is just the same as that found in the solid state, ignoring the inter-anionic Sb-S interactions: the gas-phase calculated and experimental solid state intra-atomic distances differed by less than 6%.
Table 2. Comparison between the observed and calculated wavenumbers (cm-1) of vibrational spectra of [NEt
4]2[Zn(dmit)2]
RHF DFT MP2 Symm. Exp. Mode
cm-1 I
IR IRA cm-1 IIR* cm-1 IIR IR(s) R(s) Assignment
1732 0.00 213.60 1516 0 1457 0.00 A1 ν(C=C)
1732 2.54 11.72 1512 681 1455 13.45 B2 1417 1421 ν(C=C)
1057 0.00 26.14 1007 0 1021 0.00 A1 1059 ν(C=S)
1055 23.02 0.09 1006 738 1016 27.81 B2 1039 1030 ν(C=S)
1038 0.04 0.00 928 1 1 950 0.25 E ν(Ce-Sm)
1038 0.04 0.00 928 1 1 950 0.25 E ν(Ce-Sm)
926 0.51 10.38 830 3 2 836 1.10 E 910 902 ν(Ct-Sa)
926 0.51 10.39 830 3 2 836 1.10 E ν(Ct-Sa)
879 0.00 7.15 803 0 819 0.00 A1 ν(Ce-Sm) + ν(Ce-Sa)
878 2.76 1.63 801 221 817 1.96 B2 887 ν(Ce-Sm) + ν(Ce-Sa)
765 0.01 0.16 700 1 714 0.10 E ν(Ce-Sm) + ν(Ce-Sa) +ν(Ct-Sa)
765 0.01 0.15 700 1 714 0.10 E ν(Ce-Sm) + ν(Ce-Sa) + ν(Ct-Sa)
644 0.00 4.53 528 0 512 0.00 B1 τ(SC=CS)
644 0.00 0.00 527 0 510 0.00 A2 τ(SC=CS)
537 0.00 16.38 494 0 497 0.00 A1 ν(C=S) + ν(Ct-S)
537 0.61 6.84 494 2 6 496 1.60 B2 524 525 ν(C=S) + ν(Ct-S)
474 0.00 6.13 439 0 438 0.00 A1 σ(SCtS) + ν(Ce-Sm) + ν(Ce-Sa)
474 1.75 6.00 438 8 9 435 3.05 B2 461 465 σ(SCtS) + ν(Ce-Sm) + ν(Ce-Sa)
515 0.00 0.68 436 2 445 0.10 E ω(SCtS)
515 0.00 0.68 436 2 445 0.10 E ω(SCtS)
411 0.06 8.63 375 4 381 0.07 E 388 390 σ(CCSm) + ρ(SCtS)
411 0.06 8.63 375 4 381 0.07 E σ(CCSm) + ρ(SCtS)
350 0.00 0.58 329 2 333 0.25 B2 σ(CeSaCt) + σ(SCtS)
348 0.00 61.75 326 0 330 0.00 A1 349 σ(CeSaCt) + σ(SCtS)
347 0.00 1.33 321 0 327 0.00 E σ(CeSaCt) + σ(SC=S) + ν(Zn-S)
347 0.00 1.20 321 0 327 0.00 E σ(CeSaCt) + σ(SC=S) + ν(Zn-S)
314 3.42 4.86 305 111 316 3.01 B2 314 ν(Zn-S)
306 0.00 4.45 290 0 299 0.00 A1 306 ν(Zn-S)
307 0.00 1.74 267 0 261 0.01 E χ(SC=CS)
307 0.00 1.74 267 0 261 0.01 E χ(SC=CS)
249 0.49 1.05 238 1 4 253 0.39 E 249 247 ν(Zn-S) + σ(SC=S)
249 0.49 1.05 238 1 4 253 0.39 E ν(Zn-S) + σ(SC=S)
198 1.91 0.31 192 8 3 198 1.56 B2 195 198 σ(SZnS)
158 0.21 3.93 147 4 156 0.10 E 158 161 ω(SZnS) + σ(SC=S)
158 0.21 3.91 147 4 156 0.10 E ω(SZnS) + σ(SC=S)
131 0.00 0.06 112 0 116 0.00 B1 τ(SaCeSm)
130 0.00 0.00 111 0 114 0.00 A2 τ(SaCeSm)
105 0.17 1.28 9 6 5 9 6 0.12 E ω(SZnS) + τ(SaCeSm)
105 0.17 1.30 9 6 5 9 6 0.12 E ω(SZnS) + τ(SaCeSm)
9 5 0.00 6.79 9 2 0 9 6 0.00 A1 ω(SZnS)
7 4 0.00 3.39 7 0 0 7 4 0.00 E σ(SZnS) + χ(SC=CS) + σ(SC=S)
7 4 0.00 3.39 7 0 0 7 4 0.00 E σ(SZnS) + χ(SC=CS) + σ(SC=S)
4 2 0.00 9.21 3 2 0 3 9 0.00 B1 σ(SZnS) + χ(SmCeSa)
1 6 0.00 0.04 1 4 0 1 3 0.00 E χ(SC=CS)+ χ(SC=S) + σ(SZnS)
1 6 0.00 3.41 1 4 0 1 3 0.00 E χ(SC=CS)+ χ(SC=S) + σ(SZnS)
a Calculated infrared intensities (I
The results between the three basis functions do not exhibit significant variations as also found for the zincate complex discussed earlier, an indication that polarization functions do not play a qualitative role in this geometry calculation. Analysing the differences between the several calculations methods, it is noticeable that the RHF method provided the closest match to the experimental values, similarly as observed for the dmit zinc complex. The description of the correlation energy through the DFT or MP2 methods showed an increase on the Sb-S bonds.
[Sb(dmit)2]-1 experimental frequencies
The molecular cartesian displacement reducible
representation for C2 symmetry leads to the following
genuine vibration space composition: ΓVibration = 23A +
22B. All 45 expected vibrational modes are both infrared and Raman active.
We are not aware of any previous Raman spectra recorded for solid [Q][Sb(dmit)2] complexes. The infrared
and the Raman spectra, from 4000 to 150 cm-1, for the
solid [NEt4]2[Sb(dmit)2], are shown in Figures 5 and 6. The
strong band at 1435 cm-1 is assigned as the C=C dmit
stretch. Between 1060 and 1010 cm-1 two intense bands
are assigned as C=S stretches. These three bands, also present in the infrared/Raman spectra of [Q]2[Zn(dmit)2], have been used to confirm the presence of the dmit group in such complexes.10-12 The bands at 993, 895 and 881 cm-1
are assigned as C-S stretches. At 524 cm-1, the breathing
mode of the dmit ligant was observed.
It should be pointed out that no assignment of vibrational frequencies below 500 cm-1 has been previously
made, even though a list of IR spectral bands was presented in a recent article.10 The infrared spectrum between 500 and
140 cm-1, showed eleven main bands, while the Raman
presented just nine bands. Between 470 and 440 cm-1 in the
infrared and Raman spectra, two bands are observed, an intense band at 461 cm-1 and a low intensity band at 445 cm-1.
A low intensity band at 386 cm-1 is present in the IR
spectrum, but not in the Raman spectrum. There are three bands at 351, 336 and 328 cm-1 in the infrared spectrum: of
these, the first two are Raman active as well. Between 300 and 260 cm-1, three infrared active bands were observed at
295, 283 and 274 cm-1, of these the first and the last were
also Raman active. The peak in the IR spectrum at 220 cm-1
and the shoulder at 226 cm-1 are matched in the Raman spectra
by two distinct bands at 231 and 222 cm-1. At 150 cm-1, in the
infrared and at 158 cm-1 on the Raman spectra a very intense
band was observed.
Several low intensity bands have been assigned in this work as overtones and combination bands. Between 2100 and 1700 cm-1, not previously reported in the literature,
we assign the bands at 2044, 1969 and 1757 cm-1 as
overtones of the fundamental modes present at 1028, 993
and 881 cm-1. On the other hand, the bands at 2063, 1896
and 1782 cm-1 correspond to the combination of the
respective fundamental modes at 1049,1028 and 1434,
463 and 895, 881 cm-1. Clearly the low frequency region
of the infrared and Raman spectra, from 360 to 150 cm-1,
can be considered as a characteristic fingerprint region for metal-dmit complexes. The larger number of bands
observed in this region for [NEt4][Sb(dmit)2] than for
[NEt4]2[Zn(dmit)2], can be related to the reduced symmetry of the anion in [NEt4][Sb(dmit)2] (C2) compared to that in [NEt4]2[Zn(dmit)2] (D2d).
[Sb(dmit)2]-1 frequency calculations
From the optimized geometries we carried out a hessian calculation and frequency evaluation of all vibrational modes of [Sb(dmit)2]-1. All frequencies showed real modes,
Table 3. Main geometrical parameters for the complex anion
[Sb(dmit)2]-1 with ab initio calculations and the SBKd basis set
RHF DFT MP2 Exp.7
Bond (Å)
S17=C15 1.6809 1.6917 1.7033 1.6800 S13-C15 1.7847 1.8122 1.8237 1.7250
S13-C9 1.8219 1.8394 1.8420 1.7400
S4-C9 1.8052 1.8102 1.8243 1.7250
C7=C9 1.3226 1.3513 1.3648 1.3800
Sb-S 2.7215 2.7337 2.7345 2.6720
2.5438 2.5808 2.5737 2.4960 Bend (º)
S13C15S17 123.6 124.0 123.8 123.4
C15S13C9 96.7 97.2 96.9 97.7
S13C9C7 116.9 116.7 116.9 115.6
SbS4C9 100.3 100.9 99.8 101.2
S2SbS4 82.8 83.2 83.7 83.2
S5SbS4 165.4 167.0 165.8 158.8
S5SbS2 88.0 88.9 87.4 83.5
S3SbS2 101.3 104.9 102.5 101.6
Diedral (º)
SbS4C7C9 13.3 8.9 14.6 8.1
S2C7S11C15 178.7 178.8 178.3 174.5 C7S11C15S17 178.8 178.7 178.8 174.9
Figure 4. Three-dimensional representation of complex anions
as expected for an equilibrium geometry. The frequencies and the corresponding intensities are shown in Table 4. As observed for the zinc complex, only minor differences between the various basis sets and the metallic ECP used were detected. Larger variations were observed between the different computational methods/electron correlation descriptions. For instance, the RHF results shown in Table 4, clearly overestimated all frequencies, with the largest difference found for the C=C stretch (20%). Below 500 cm-1, most of the calculated frequencies were overestimated
between 5 and 10%. In the DFT and MP2 calculations, all deviations were found to be smaller, e.g., deviations for the C=C stretch were 8% and 5% from DFT-B3LYP and MP2 methods respectively. For the other modes above 300
cm-1, most were overestimated between 1 to 10%. However
below 300 cm-1, much better agreement with experimental
results were obtained, with discrepancies between 1 and 3%. Remarkable is the prefect match between the frequency ordering found among all calculations carried out and the experimental results. Two exceptions, also observed for the zinc-dmit complex, should be pointed:
w(SCtS) out-of-plane bending between 450 and 430 cm-1,
for the DFT-B3LYP and MP2 methods. This reordering was not observed for the corresponding RHF calculation
between 510 and 480 cm-1.
The calculations confirmed the assignments previously reported in the literature.10 The C=C, C=S and C-S stretches
were recognized at 1435, 1028 and 881 cm-1, respectively.
The bands at 522 and 463 cm-1 were assigned as breathing
mode from the dmit ring and SCtS bending mode,
respectively. Between 360 and 300 cm-1, a series of bands
was assigned as SaCeSm bending mode slightly coupled to
the Sb-S stretching mode. The bands at 295 and 283 cm-1
were assigned as symmetrical and asymmetrical Sb-S stretches coupled to C=C out-of-plane twisting and SC=S in-the-plane bending. These modes were assigned from their symmetry and spectroscopic activity. While the symmetric stretch is Raman-active, the asymmetrical stretch occurs in the infrared. The band at 274 cm-1 arises
from the C=C out-of-plane. The band at 222 cm-1 results
from the Sb-S stretching coupled to the S=CtS bending.
Finally the 150 cm-1 band was assigned as the
five-members-ring deformation formed by the metal coordination to the thiolate sulfur.
[Bi(dmit)2]-1 geometry optimizations
The symmetry of the [Bi(dmit)2]-1 anion in
[NEt4][Bi(dmit)2] is C2. Table 5 lists the results for the geometry optimization carried out with the SBKd basis set and ECP pseudopotential. As previously mentioned
Figure 6. Vibrational Raman spectrum of the metal complex salt [NEt4][Sb(dmit)2]: (a) 4000-600 and (b) 600-150 cm-1.
for the zinc and antimony systems, only minor differences have been found between the calculations using the main geometrical optimized parameters with other basis sets and ECP. Therefore these results will be not presented. Similarly as found for zinc and antimony, most of the calculated geometrical parameters for the isolated anion in the gas phase showed small differences compared to those obtained in the X-ray diffraction study: differences were less than 6% for bond lengths and 10% for the angle between the
Table 4. Comparison between the observed and calculated wavenumbers (cm-1) of vibrational spectra of [NEt
4][Sb(dmit)2]
RHF DFT MP2 Symm. Exp. Mode
cm-1 I
IR IRA cm-1 IIR* cm-1 IIR IR(s) R(s) Assignment
1774 0.96 17.38 1560 111 1511 2.38 B 1435 1435 ν(C=C)
1774 0.35 50.51 1560 3 4 1510 1.08 A ν(C=C)
1090 10.34 0.68 1036 238 1052 8.71 A 1049 ν(C=S)
1088 13.88 0.48 1034 564 1050 12.39 B 1028 1022 ν(C=S)
1068 0.01 3.28 938 4 956 0.12 A 993 989 ν(Ce-Sm)
1068 0.00 4.24 937 4 956 0.08 B ν(Ce-Sm)
917 0.01 23.00 819 2 9 832 0.64 A ν(Ct-Sa)
917 0.83 3.85 816 5 0 830 1.22 B 895 890 ν(Ct-Sa)
915 0.84 21.79 816 103 814 0.09 A ν(Ce-Sm) + ν(Ce-Sa)
913 1.11 15.68 815 1 4 813 0.78 B 881 ν(Ce-Sm) + ν(Ce-Sa)
794 0.05 5.64 712 3 718 0.09 A ν(Ce-Sm) + ν(Ce-Sa) + ν(Ct-Sa)
793 0.20 1.02 712 1 2 718 0.53 B ν(Ce-Sm) + ν(Ce-Sa) + ν(Ct-Sa)
654 0.00 0.90 540 0 529 0.00 A τ(SC=CS)
652 0.01 0.73 539 0 527 0.00 B τ(SC=CS)
526 0.32 22.06 482 1 3 476 0.87 A ν(C=S) + ν(Ct-S)
526 0.42 4.92 481 3 2 475 1.19 B 522 522 ν(C=S) + ν(Ct-S)
487 0.59 9.26 446 1 1 445 0.44 A σ(SCtS) + ν(Ce-Sm) + ν(Ce-Sa)
486 1.24 3.92 446 2 3 444 0.23 B 463 463 σ(SCtS) + ν(Ce-Sm) + ν(Ce-Sa)
509 0.00 0.57 444 0 443 0.03 A ω(SCtS)
509 0.01 4.43 444 1 6 443 0.81 B 445 445 ω(SCtS)
419 0.04 7.09 380 1 384 0.03 A σ(CCSm) + ρ(SCtS)
417 0.06 5.32 379 3 382 0.05 B 386 σ(CCSm) + ρ(SCtS)
379 0.12 12.83 336 8 339 0.06 A 351 351 σ(CeSaCt) + σ(SCtS) + ν(Sb-S)
375 0.35 2.20 335 1 338 0.24 B σ(CeSaCt) + σ(SCtS) + ν(Sb-S)
360 0.02 22.18 331 1 332 0.00 A 336 336 σ(CeSaCt) + ν(Sb-S)
358 0.05 13.42 325 3 328 0.01 B 328 σ(CeSaCt) + ν(Sb-S)
330 0.28 28.42 296 8 298 0.25 A 295 295 ν(Sb-S) + χ(SC=CS) + σ(SC=S)
326 1.31 2.92 288 109 291 2.21 B 283 ν(Sb-S) + χ(SC=CS) + σ(SC=S)
304 0.65 9.70 270 1 6 265 0.08 B 274 275 χ(SC=CS) + ν(Sb-S)
303 0.08 12.85 266 0 258 0.01 A χ(SC=CS) + ν(Sb-S)
255 0.00 32.88 230 0 235 0.00 A 231 ν(Sb-S) + σ(SC=S)
245 2.46 0.45 232 6 1 236 2.08 B 222 ν(Sb-S) + σ(SC=S)
168 2.14 10.90 152 6 158 0.17 A 158 σ(SSbS)
176 0.25 10.06 158 7 8 158 1.84 B 150 σ(SSbS)
152 1.34 1.87 142 5 146 0.10 B σ(SSbS) + w(SC=S)
158 0.01 8.00 131 0 143 0.01 A τ(SmCeSa)
134 0.04 0.24 113 0 115 0.02 B τ(SmCeSa)
125 0.02 11.69 112 0 110 0.01 A τ(SSbS) + τ(SmCeSa)
118 0.08 5.62 9 8 3 103 0.06 A ω(SSbS) + τ(SmCeSa)
9 8 0.11 2.51 9 2 3 8 9 0.07 B ω(SSbS) + τ(SC=S)
7 7 0.01 4.06 6 6 0 6 6 0.00 A ω(SSbS) + χ(SC=CS) + τ(SC=S)
6 1 0.01 2.63 5 0 0 5 0 0.00 B τ(SSbS) + χ(SmCeSa)
5 3 0.00 7.72 4 2 0 4 5 0.00 A χ(SmCeSa)
3 0 0.00 2.35 2 6 0 2 5 0.00 B σ(SSbS) + χ(SmCeSaCt)
1 3 0.01 1.30 1 2 0 1 1 0.00 A σ(SSbS) + χ(SmCCSa)
a Calculated infrared intensities (I
IR) are in Debye2(Å-2-AMU). Raman scattering activities (IRA) are in Å4AMU-1. Calculated infrared intensities (IIR*) are in KMmol-1. b Ce = carbon ethylenic, Ct = carbon of thione, Sm = linked sulfur to the metal, Sa = sulfur of the ring.
Table 5. Main geometrical parameters for the complex anion
[Bi(dmit)2]-1 with ab initio calculations and the SBKd basis set
RHF DFT MP2 Exp.7
Bond (Å)
S17=C15 1.6816 1.6919 1.7035 1.6455 S13-C15 1.7834 1.8110 1.8225 1.7231
S13-C9 1.8244 1.8425 1.8452 1.7493
S4-C9 1.8069 1.8099 1.8248 1.7327
C7=C9 1.3233 1.3527 1.3658 1.3402
Bi-S 2.7861 2.7991 2.8053 2.8339
2.6012 2.6565 2.6520 2.6668 Bend (º)
S13C15S17 123.7 124.0 123.9 124.4
C15S13C9 96.9 97.4 97.1 99.2
S13C9C7 116.8 116.6 116.7 115.1
BiS4C9 100.5 100.9 100.3 96.9
S2BiS4 81.9 81.8 82.5 76.5
S5BiS4 166.8 169.2 167.1 152.5
S5BiS2 89.8 91.8 89.7 84.2
S3BiS2 101.9 108.0 105.7 89.6
Dihedral (º)
BiS2C7C9 9.7 5.9 9.2 30.3
S2C7S11C15 179.4 179.5 179.3 177.4 C7S11C15S17 179.1 178.9 178.9 177.6
[Bi(dmit)2]-1 experimental frequencies
The [Bi(dmit)2]-1 and [Sb(dmit)
2]-1 structures have the
same symmetry and both exhibit 45 vibrational infrared and Raman active modes. The infrared and Raman spectra of solid [NEt4][Bi(dmit)2], from 4000 to 120 cm-1, are shown
in Figures 7 and 8.
The intense band at 1421 cm-1 was assigned to the
C=C stretch.14 Two other very strong bands, 1057 and 1022
cm-1, have been assigned as symmetrical and asymmetric
C=S stretches. A band at 883 cm-1 and a shoulder at 997
cm-1 were assigned as C-S stretches. At 534 and 518 cm-1,
two other bands have been assigned as dmit ring breathing modes.
Six high intensity bands occur in the infrared spectrum
between 500 and 140 cm-1, while seven high intensity
bands were detected in the Raman spectrum. In the region
from 470 to 440 cm-1, in both the infrared and Raman
spectra, an intense band at 463 cm-1 and a shoulder at 447
cm-1 are found. Following these bands, a central and more
intense band at 386 cm-1 and two weak bands at 397 and
376 cm-1 are observed. In the Raman spectrum a single
band was identified at 389 cm-1. Three bands were observed
at 350, 331 and 328 cm-1 in the infrared spectrum, but only
the first was actually observed in Raman spectrum.
Between 320 and 300 cm-1, a shoulder at 310 cm-1 and a
band at 302 cm-1 are observed in infrared spectrum. In the
Raman spectrum, the main band in this region was observed at 310 cm-1 with a shoulder at 302 cm-1. At 279 cm-1 in the
Figure 7. Infrared vibrational spectrum of the metal complex salt
[NEt4][Bi(dmit)2]: (a) 4000-600 and (b) 600-150 cm-1.
infrared spectrum a band was observed, while the Raman
band in this region was found at 283 cm-1 with a low
intensity. In the region between 260 and 240 cm-1, two
bands at 252 and 247 cm-1 were observed in the infrared,
while in the Raman spectrum just one band was observed
at 249 cm-1. Between 230 and 180 cm-1, several low
intensity bands were observed in the infrared and Raman.
At 134 cm-1 in the Raman spectrum, a single intense band
was observed, assigned as the five-members-ring deformation formed by the metal coordination to the thiolate sulfur. This band has been found to have a linear dependency with the mass of the M-S bond along the bis(dmit) complex of zinc, antimony and bismuth.
The region from 2100 to 1700 cm-1 was investigated
for overtones and combination bands. The bands at 2081 and 1880 cm-1, might be interpreted as combination of the
Table 6. Comparison between the observed and calculated wavenumbers (cm-1) of vibrational spectra of [NEt
4][Bi(dmit)2]
RHF DFT MP2 Symm. Exp. Mode
cm-1 I
IR* IRA cm-1 IIR* cm-1 IIR IR(s) R(s) Assignment
1770 4 3 1 7 1553 9 3 1506 103 B 1427 1427 ν(C=C)
1770 1 4 6 3 1553 2 5 1505 4 0 A ν(C=C)
1089 374 0 1037 201 1051 295 A 1057 1056 ν(C=S)
1086 684 0 1035 641 1049 675 B 1020 1013 ν(C=S)
1059 1 3 934 4 950 5 A 997 999 ν(Ce-Sm)
1059 0 3 933 3 950 5 B ν(Ce-Sm)
918 0 2 4 818 6 822 2 4 A ν(Ct-Sa)
918 2 1 6 817 3 7 821 7 0 B ν(Ct-Sa)
904 3 0 3 9 809 2 9 816 3 A 879 ν(Ce-Sm) + ν(Ce-Sa)
903 6 9 1 6 808 124 814 3 5 B 883 ν(Ce-Sm) + ν(Ce-Sa)
791 2 6 711 2 717 4 A ν(Ce-Sm) + ν(Ce-Sa) + ν(Ct-Sa)
790 8 1 711 1 1 716 2 0 B ν(Ce-Sm) + ν(Ce-Sa) + ν(Ct-Sa)
652 0 1 540 0 528 0 A τ(SC=CS)
650 0 1 539 0 526 0 B τ(SC=CS)
528 1 1 2 3 483 1 0 477 3 0 A 534 534 ν(C=S) + ν(Ct-S)
528 2 0 5 482 3 4 476 6 4 B 518 ν(C=S) + ν(Ct-S)
485 2 2 1 0 445 9 443 6 A σ(SCtS) + ν(Ce-Sm) + ν(Ce-Sa)
484 5 9 4 445 2 7 441 5 4 B 463 466 σ(SCtS) + ν(Ce-Sm) + ν(Ce-Sa)
510 1 5 444 0 444 1 3 A 447 443 ω(SCtS)
510 0 0 443 1 3 444 2 B ω(SCtS)
415 1 8 377 1 382 2 A 386 389 σ(CCSm) + ρ(SCtS)
414 2 5 376 3 382 4 B σ(CCSm) + ρ(SCtS)
371 2 8 332 0 337 1 1 B 350 349 σ(SmCeSa) + σ(SC=S) + ν(Bi-S)
367 8 2 333 4 344 1 4 A σ(SmCeSa) + σ(SC=S) + ν(Bi-S)
358 0 1 7 329 0 330 0 A 331 333 σ(CeSaCt) + σ(CtSaCe) + ν(Bi-S)
354 1 1 1 322 2 329 0 B 328 σ(CeSaCt) + σ(CtSaCe) + ν(Bi-S)
324 1 2 3 5 293 6 298 4 A 310 ν(Bi-S) + χ(SC=CS) + σ(SC=S)
320 4 6 2 282 103 287 108 B 302 ν(Bi-S) + χ(SC=CS) + σ(SC=S)
300 6 5 1 1 270 4 0 264 5 B 279 283 χ(SC=CS) + ν(Bi-S)
304 4 1 7 270 0 262 0 A χ(SC=CS) + ν(Bi-S)
256 0 2 7 232 0 240 0 A ν(Bi-S) + σ(SC=S)
243 9 3 1 229 4 0 234 7 5 B 247 249 ν(Bi-S) + σ(SC=S)
152 3 1 134 1 6 143 3 B σ(SBiS)
148 9 4 133 3 139 1 2 A 135 σ(SBiS) + σ(SC=S)
138 9 6 6 133 5 0 133 5 2 B σ(SBiS) + τ(SmCeSa)
142 6 1 2 119 2 126 2 A σ(SBiS) + σ(SC=S)
122 0 8 111 0 109 0 A σ(SBiS) + τ(SmCeSa)
128 2 0 110 0 108 0 B τ(SBiS) + τ(SmCeSa)
108 5 1 5 9 3 3 9 5 4 A ω(SBiS) + τ(SmCeSa) + χ(SC=CS)
+ τ(SC=S)
9 5 5 3 9 0 3 8 6 3 B ω(SBiS) + τ(SC=S)
7 1 0 3 5 9 0 5 9 0 A ω(SBiS) + χc(SC=CS) + τ(SC=S)
5 3 1 2 4 4 0 4 5 0 B χ(SmCCSa) + σ(SBiS) + τ(SC=S)
4 7 0 8 3 7 0 4 3 0 A χ(SmCeSa) + σ(SBiS)
2 5 0 3 2 4 0 2 3 0 B σ(SBiS) + χ(SmCeSaCt)
1 0 0 1 2 1 1 0 1 0 0 A σ(SBiS) + χ(SmCCSa)
a Calculated infrared intensities (I
1057, 1022 cm-1 and 1421, 463 cm-1 bands. On the other
hand, the bands at 1975 and 1764 have been assigned as
overtones of the 997 and 883 cm-1 fundamental bands.
[Bi(dmit)2]-1 frequency calculations
From the optimized geometries a hessian matrix calculation and frequency determination of all vibrational modes of [Bi(dmit)2]-1 was carried out. All frequencies
showed real modes. The frequencies and the corresponding intensities are shown in Table 6. As observed previously, only minor differences between the various basis sets/metal ECPs were detected. The results followed trends similar to the ones previously discussed in the zinc and antimony cases.
Conclusions
This work reports a combined theoretical-experimental investigation of the infrared and Raman vibrational spectra of three metal complexes with the 1,3-dithiole-2-thione-4,5-dithiolate (dmit) ligand, namely, [NEt4]2[Zn(dmit)2], [NEt4][Sb(dmit)2] and [NEt4][Bi(dmit)2]. The IR and Raman spectra of all complexes have been recorded, and assigned, with an extensive set of ab initio calculations carried out for validation and cross-checking.
Calculations carried out with several basis set and ECP potentials generated very similar results among them, as well as to the X-ray diffraction experimental results. Actually only minor differences were pointed in the text. The authors, however, claim this should not be considered a general conclusion for other metals and complexes. The metal-ligand character of dmit-complexes might be an important part of this observed behaviour. For other metal complexes and metal clusters molecular systems an additional study must be carried out. Within this possibility we still expect that the ECP and basis set choice should have an important role in the quality of the results. Major differences have been observed however with the use of different methodologies. RHF showed the worst results while DFT and MP2 calculations presented equivalent quality.
Starting from the observation of the spectra in solution
of the [NEt4]2[Zn(dmit)2], C=S symmetrical and
asymmetrical stretching modes were defined more clearly than in the solid state, becoming easily distinguishable and coherent with the present theoretical observations in 1059 and 1039 cm-1.
Most of the spectral data exhibit a spectrum composed of isolated fundamental bands for the systems without a strong M-S inter-molecular interaction. Within this pattern very few overtones, combinations bands and crystalline
lattice vibrations have been observed in the spectra of the dmit-metal complexes. For the zinc complex, independently of the cation size, a similar spectrum was observed. On the other hand, for the dmit compounds where strong M-S inter-molecular interactions are present, significant deviations are observed, depending on the cation size and crystalline environment. The most clarifying example was found for the tetraethylammonium bismuth dmit complex for which a large difference among the BiSCC dihedral angle (20/25 degrees) was found between calculated and experimental results. Similarly significant overtones, combinations bands and crystalline effects appear in the spectrum. Although present on bismuth, for the antimony complex, whose is the same but with weaker M-S inter-molecular interactions, the spectra showed a simple fundamental behaviour.
Acknowledgments
Four authors (GBF, NMC, JLW and EH) acknowledge CNPq for financial support, and thank Dr. Nelson Morgon, from Universidade Estadual de Campinas, for submitting the MP2 jobs to Free-BSD Linux cluster, and Dr. Claudio Alberto Téllez Soto (UFF), for helpful discussions. The Pontifícia Universidade Católica do Rio de Janeiro is particularly acknowledged for the use of the Raman Nicolet FT-950 spectrophotometer.
Electronic Supplementary Information
Theoretical and vibrational analysis of tetraethyl-ammonium bromide are available as a PDF file at http:// jbcs.sbq.org.br
References
1. Robertson, N.; Cronin, L.; Coord. Chem. Rev.2002, 227, 93. 2. Pullen, A.E.; Olk, R.M.; Coord. Chem. Rev.1999, 188, 211.
3. Cassoux, P.; Coord. Chem. Rev. 1999, 185, 213.
4. Brossard, L., Ribault, M., Bousseau, M., Valade, L., Cassoux, P.; C. R. Sci. (Paris) A Serie II1986, 302, 205.
5. Akutagawa, T.; Nakamura, T.; Coord. Chem. Rev.2000, 198,
297; Xue, G.; Yu, W. T.; Fang, Q.; Acta Cryst.2003, 59C, m27; Cronin, L.; Clark, S. J.; Parsons, S.; Nakamura, T.; Robertson, N.; J. Chem. Soc.Dalton Trans.2001, 1347. 6. Comerlato, N. M.; Harrison, W. T. A.; Howie, R. A.; Low, J. N.;
Silvino, A. C.; Wardell, J. L.; Wardell, S. M. S V.; Acta Cryst. 2002, 58C, m105.
8. Chohan, Z. H.; Howie, R. A.; Wardell, J. L.; Wilkens, R., Doidge-Harrison, S. M. S. V.; Polyhedron1997, 16, 2689.
9. Wang, H.; Zhu, D.; Zhu, N.; Fu, N.; Acta Phys. Sin.1986, 35, 378.
10. Aupers, J. H.; Chohan, Z. H.; Comerlato, N. M.; Howie, R. A.; Silvino, A. C.; Wardell, J. L.; Wardell, S. M. S. V.; Polyhedron 2002, 21, 2107.
11. Marton, D.; Ganis, P.; Marton, D.; Spencer, G.M.; Wardell J.L.; Wardell, S.M.S.V.; Inorg. Chim. Acta2000, 308, 139. 12. Doidge-Harrison, S. M. S. V.; Irvine, J. T. S.; Spencer, G. M.;
Wardell, J. L.; Ganis, P.; Valle, G.; Tagliavini, G.; Inorg. Chem. 1995, 34, 4581.
13. Sheng, T.; Wu, X.; Lin, P.; Zhang, W.; Wang, Q.; Chen, L.; Polyhedron1999, 18, 1049.
14. Comerlato, N. M.; Harrison, W. T. A.; Howie, R. A.; Silvino, A. C.; Wardell, J. L.; Wardell, S. M. S. V.; Inorg. Chem. Commun. 2000,3, 572.
15. Comerlato, N. M.; Costa, L. A. S.; Howie, R. A.; Pereira, R. P.; Rocco, A. M.; Silvino, A. C.; Wardell, J. L.; Wardell, S. M. S. V.; Polyhedron2001, 20, 415.
16. Matsuda, F.; Tamura, H.; Matsubayashi, G.; Inorg. Chim. Acta 1999, 295, 239.
17. Siimann, O.; Fresco, J.; Inorg. Chem.1971, 10, 297. 18. Schläpfer, C. W.; Nakamoto, K.; Inorg. Chem.1975, 14, 1338.
19. Barreto, W. J.; Santos, P. S.; J. Coord. Chem. 1993, 30, 337. 20. Aragoni, M. C.; Arca, M.; Demartin, F.; Devillanova, F. A.;
Garau, A.; Isaia, F.; Lelj, F.; Lippolis, V.; Verani, G.; J. Am. Chem. Soc.1999, 121, 7098.
21. Ramakumar, R.; Tanaka, Y.; Yamaji, K.; Phys. Rev. B1997, 52, 795.
22. Ramakumar, R.; Yamaji, K.; Synth. Met.2001, 120, 769. 23. Pokhodnya, K. I.; Faulmann, C.; Malfant, I.; Andreu-Solano,
R.; Cassoux, P.; Mlayah, A.; Smirnov, D.; Leotin, J.; Synth. Met.1999, 103, 2016.
24. Dyer, C. D., Kilburn, J. D.; Maddams, W. F.; Walker, P. A.; Spectrochim. Acta1991, 47A, 1225.
25. Schmidt, M. W.; Baldridge, K. K.; Boatz, J. A.; Elbert, S. T.; Gordon, M. S.; Jensen, J. H.; Koseki, S.; Matsunaga, N.; Nguyen, K. A.; Su, S. J.; Windus, T. L.; Gamess Version R5; Iowa State University, 2001.
26. Frisch, M. J.; Trucks, G. W.; Schlegel, H. B.; Scuseria, G. E.; Robb, M. A.; Cheeseman, J. R.; Zakrzewski, V. G.; Montgomery, J. A.; Stratmann, R. E.; Burant, J. C.; Dapprich,
S.; Millam, J. M.; Daniels, A. D.; Kudin, K. N.; Strain, M. C.; Farkas, O.; Tomasi, J.; Barone, V.; Cossi, M.; Cammi, R.; Mennucci, B.; Pomelli, C.; Adamo, C.; Clifford, S.; Ochterski, J.; Petersson, G. A.; Ayala, P. Y.; Cui, Q.; Morokuma, K.; Malick, D. K.; Rabuck, A. D.; Raghavachari, K.; Foresman, J. B.; Cioslowski, J.; Ortiz, J. V.; Baboul, A. G.; Stefanov, B. B.; Liu, G.; Liashenko, A.; Piskorz, P.; Komaromi, I.; Gomperts, R.; Martin, R. L.; Fox, D. J.; Keith, T.; Al-Laham, M. A.; Peng, C. Y.; Nanayakkara, A.; Gonzalez, C.; Challacombe, M.; Gill, P. M. W.; Johnson, B.; Chen, W.; Wong, M. W.; Andres, J. L.; Gonzalez, C.; Head-Gordon, M.; Replogle, E. S.; Pople, J. A.; Gaussian 98, Revision A.7; Gaussian, Inc.: Pittsburgh PA, 1998. 27. Stevens, W. J.; Krauss, M.; Basch, H.; Jasien, P. G.; Can. J.
Chem. 1992, 70, 612.
28. Dolg, M.; Stoll, H.; Preuss, H.; Pitzer, R. M.; J. Phys. Chem.
1993, 97, 5852.
29. Noordik, J. H.; Schaftenaar, G.; J. Comput.-Aided Mol. Design 2000, 14, 123.
30. Flükiger, P.; Lüthi, H. P.; Portmann, S.; Weber, J.; MOLEKEL 4.3, Swiss Center for Scientific Computing, Manno (Switzerland), 2000.
31. Hooper, M. A.; James, D.W.; Austr. J. Chem.1971, 24, 1345. 32. Cassoux, P.; Pokhodnya, K. I.; Faulmann, C.; Malfant, I.; Andreu-Solano, R.; Mlayah, A.; Smirnov, D.; Leotin, J.; Synth. Met.1999, 103, 2016.
33. Radom, L.; Scott, A. P.; J. Phys. Chem. 1996, 100, 16502.
34. Hollauer, E., Ramos; J. C. S.; Quim. Nova 1999, 22, 684; Carauta, A. N. M.; Souza, V.; Hollauer, E.; Soto, C. A. T.; Spectrochim. Acta A2004, 60, 41; Soto, C. A. T; Hollauer, E.; Felcman, J.; Lopes, D. C. N.; Cattapan, R.; Spectrochim. Acta A2002, 58, 1853; Soto, C. A. T; Hollauer, E.; Pais da Silva, M. I.; Mondragón, M. A.; Haiduc, I.; Curtui, M.; Spectrochim. Acta A2001, 57, 1149; Soto, C. A. T; de la Riva, S.; Hollauer, E.; Haiduc, I.; Silvestru, C. S.; Spectrosc. Lett.1998, 31, 1469. 35. Ratajczak, H.; Baran, J.; Sledz, M.; Drozd, M.; Pietraszko, A.;
Haznar, A.; J. Mol. Struct.2000, 526, 361.
36. Zeegers-Huyskens, T.; Bator, G.; Vib. Spectrosc. 1996, 13, 41.
37. Beer, W. H. J., Heyns, A. M.; Spectrochim. Acta1981, 37A, 1099.
Printed in Brazil - ©2004 Sociedade Brasileira de Química 0103 - 5053 $6.00+0.00
Supplementary Material
* e-mail: [email protected]
Vibrational Spectra of Bis(dmit) Complexes of Main Group Metals:
IR, Raman and
Ab Initio
Calculations
Glaucio B. Ferreiraa, Nadia M. Comerlatoa, James L. Wardella and Eduardo Hollauer*,b
a
Instituto de Química, Universidade Federal do Rio de Janeiro, CP 68563, 21945-970 Rio de Janeiro - RJ, Brazil
b
Instituto de Química, Universidade Federal Fluminense, Outeiro de São João Batista s/n, Centro, 24210-130 Niterói - RJ, Brazil
Results
Tetraethylammonium bromide NEt4Br
The infrared and Raman spectra of NEt4Br were
obtained and a complete assignment of all the vibrations
associated with the cation was made, aided by ab initio
calculations.
[NEt4]+ geometry optimization
Several symmetries have been found for the [NEt4]+
cation35-37 in its various salts: the one found by X-ray
crystallography for the salts studied here is D2d,7,12,15 Figure
1. As no metal atom is present, all atoms in the calculations were represented by a single basis set. Table 1 lists the main geometrical parameters calculated by the different
ab initio methods for the [NEt4]+ cation. It is clear that the
calculated main geometric parameters are insensitive to the method used, all indeed giving geometric parameters
close to those found in the the X-ray diffraction study. [NEt4]+ experimental frequencies
For the D2d point group, the molecular cartesian
displacement representation and its irreducible composition lead to 81 vibration modes; Γvibration = 12A1 +
8A2 + 9B1 + 12B2 + 20E. From these, 52 are infrared active (B2 and E) and 73 are Raman active (A1, B1, B2 and E).
The infrared and Raman spectra of several
tetraethyl-ammonium salts have been reported.31,32 Figures 2 and 3
show the infrared and Raman spectra of tetraethyl-ammonium bromide, respectively. According to Hooper
and James,31 the modes at 2999 and 2983 cm-1 in the
infrared spectrum are assigned as asymmetric stretches, within CH3 and CH2 respectively, while the bands at 2970
and 2944 cm-1 in the Raman spectrum are symmetrical
CH3 and CH2 stretches, respectively. Bands between 2960
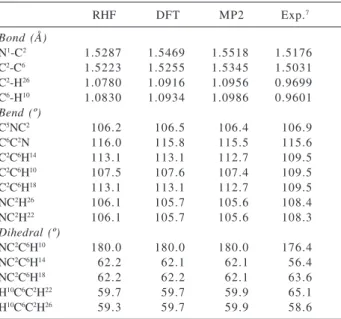
Table 1. Main geometrical parameters for the tetraethylammonium
cation calculated with ab initio methods and 6-31G basis set
RHF DFT MP2 Exp.7
Bond (Å)
N1-C2 1.5287 1.5469 1.5518 1.5176
C2-C6 1.5223 1.5255 1.5345 1.5031
C2-H26 1.0780 1.0916 1.0956 0.9699
C6-H10 1.0830 1.0934 1.0986 0.9601
Bend (º)
C5NC2 106.2 106.5 106.4 106.9
C6C2N 116.0 115.8 115.5 115.6
C2C6H14 113.1 113.1 112.7 109.5
C2C6H10 107.5 107.6 107.4 109.5
C2C6H18 113.1 113.1 112.7 109.5
NC2H26 106.1 105.7 105.6 108.4
NC2H22 106.1 105.7 105.6 108.3
Dihedral (º)
NC2C6H10 180.0 180.0 180.0 176.4
NC2C6H14 62.2 62.1 62.1 56.4
NC2C6H18 62.2 62.2 62.1 63.6
H10C6C2H22 59.7 59.7 59.9 65.1
H10C6C2H26 59.3 59.7 59.9 58.6
Figure 1. Three-dimensional representation of tetraethylammonium
and 1500 cm-1 are, most probably, overtone and
combinations bands. The region between 1500 and 1100
cm-1 is characteristic of HCH bending modes, including
scissoring, wagging, twisting and rocking modes. A set of
bands between 1493 and 1440 cm-1 has been assigned as
asymmetric and symmetric CH3 scissoring modes. The
bands between 1415 and 1390 cm-1 and the band at 1378
cm-1 are assigned as CH
2 scissoring modes. The Raman
active band at 1304 cm-1 has been assigned as CH
2 twisting
mode. Two very intense bands at 1183 and 1175 cm-1 in
the infrared spectrum have been assigned to CH3
asymmetrical rocking modes and that at 1116 cm-1 to a
symmetrical rocking mode in the Raman spectrum.
In the region below 1100 cm-1, many C-N and C-C
stretching modes are present. Low intensity bands at 1071
and 1050 cm-1 have been assigned as C-C asymmetrical
stretching. A shoulder at 1030 cm-1 has been assigned as
an asymmetric C-N stretch, while the intense band present at 1009 cm-1 in the infrared spectrum is assigned as a CH
3
rocking mode. Two low intensity bands at 910 and 898 cm-1 have been considered C-C symmetric stretching, while
the bands at 802 and 789 cm-1 have been assigned as
rocking of the CH2 group. The Raman active band at 679
cm-1 was considered by Hooper and James as the C-N
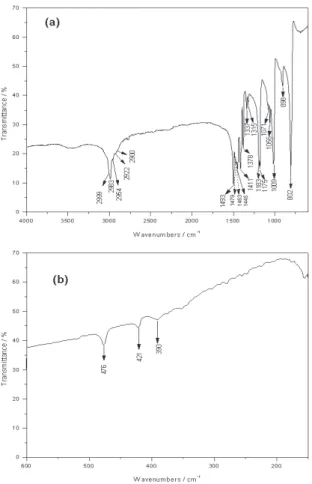
Figure 2. Infrared vibrational spectrum of the tetraethylammonium bromide: (a) 4000-600 and (b) 600-100 cm-1.
Figure 3. Vibrational Raman spectrum of the tetraethylammonium bromide: (a) 4000-600 and (b) 600-150 cm-1.
characteristic symmetric stretching mode.
In the low wavenumber region of the spectra, the few low intensity bands have been assigned to the deformation of the CCN frame. Only in the Raman spectrum was
observed an intense mode at 422 cm-1
. The 476, 421 and
390cm-1 bands in the infrared spectrum have been assigned
to the asymmetric CNC, CCN and symmetric CNC vibrational modes. Hooper and James no inform about the
presence of bands below 390 cm-1.
[NEt4]+ frequency calculations
Frequencies and intensities were calculated for the infrared and Raman spectra. All frequencies showed real modes, as expected for an equilibrium geometry. The proposed assignments, based on ab initio calculations for
all 81 vibrational modes present in NEt4Br, is found on
Table 2, with the previous conventions adopted.
For this molecule we employed RHF, DFT and MP2 methods with a single basis set to check the identification of the IR/Raman cationic bands in the spectra of the
complex salts.33,34 The most significant bands of [NEt
4]+
were observed from 3000 to 2900 cm-1, from 1500 to 1100
Table 2. Comparison between the observed and calculated wavenumbers (cm-1) of vibrational spectra of NEt 4Br
RHF DFT MP2 Symm. Exp. Mode
cm-1 I
IR IRA cm-1 IIR* cm-1 IIR IR(s) R(s) Assignment
3346 0.50 42.2 3180 2 6 3193 0.65 E ν(C-H) / (CH3+CH2)
3346 0.50 42.2 3180 2 6 3193 0.65 E 2999 2996 ν(C-H) / (CH3+CH2)
3342 0.00 3.0 3179 0 3195 0.00 B1 ν(C-H) / (CH3+CH2)
3331 0.00 0.0 3169 0 3182 0.00 A2 ν(C-H) / (CH3+CH2)
3307 0.38 120.3 3155 6 3175 0.06 E ν(C-H) / (CH3+CH2)
3307 0.38 120.3 3155 6 3175 0.06 E ν(C-H) / (CH3+CH2)
3306 0.00 0.0 3156 0 3174 0.00 A2 ν(C-H) / (CH3+CH2)
3301 1.12 15.3 3149 2 8 3172 0.44 B2 2983 ν(C-H) / (CH3+CH2)
3298 0.00 33.0 3147 0 3170 0.00 B1 ν(C-H) / (CH3+CH2)
3292 0.00 31.4 3145 0 3168 0.00 E ν(C-H) / (CH2)
3292 0.00 31.4 3145 0 3168 0.00 E ν(C-H) / (CH2)
3292 0.00 166.3 3146 0 3163 0.00 A1 2970 ν(C-H) / (CH3+CH2)
3279 0.00 160.3 3119 1 0 3123 0.36 B2 2954 ν(C-H) / (CH2)
3289 0.00 96.0 3121 0 3122 0.00 A1 2944 ν(C-H) / (CH2)
3275 0.11 24.4 3112 3 3115 0.05 E 2922 ν(C-H) / (CH2)
3275 0.11 24.4 3112 3 3115 0.05 E ν(C-H) / (CH2)
3221 0.12 2.7 3075 6 3087 0.10 B2 ν(C-H) / (CH3)
3220 0.18 15.6 3075 3 3087 0.06 E 2900 ν(C-H) / (CH3)
3220 0.18 15.6 3075 3 3087 0.06 E ν(C-H) / (CH3)
3220 0.00 392.2 3074 0 3086 0.00 A1 ν(C-H) / (CH3)
1693 1.49 0.2 1570 5 2 1590 1.23 B2 1493 1493 σ(HCH) / (CH2)
1691 0.00 9.3 1571 0 1588 0.00 A1 σ(HCH) / (CH2)
1679 0.19 1.0 1566 1 7 1585 0.36 E 1479 σ(HCH) / (CH2+CH3)
1679 0.19 1.0 1566 1 7 1585 0.36 E σ(HCH) / (CH2+CH3)
1663 0.00 59.4 1547 0 1574 0.00 A1 σ(HCH) / (CH3)
1657 0.03 5.0 1546 4 1570 0.06 E σ(HCH) / (CH3+CH2)
1657 0.03 5.0 1546 3 1570 0.06 E σ(HCH) / (CH3+CH2)
1657 0.00 80.8 1549 0 1569 0.00 B1 1466 σ(HCH) / (CH3)
1656 0.00 0.0 1548 0 1568 0.00 A2 σ(HCH) / (CH3)
1650 0.51 0.0 1537 3 3 1563 0.54 B2 1463 σ(HCH) / (CH3)
1642 0.77 0.3 1524 2 2 1547 0.48 E 1445 1444 σ(HCH) / (CH3+CH2)
1642 0.77 0.3 1524 2 2 1547 0.48 E σ(HCH) / (CH3+CH2)
1601 0.00 13.9 1482 0 1500 0.00 A1 1394 ω(HCH) / (CH3)
1604 0.04 2.6 1481 3 1500 0.07 B2 ω(HCH) / (CH3)
1600 0.81 1.2 1480 3 5 1500 0.78 E 1411 ω(HCH) / (CH3)
1600 0.81 1.2 1480 3 5 1500 0.78 E ω(HCH) / (CH3)
1587 0.00 5.6 1461 0 1474 0.03 B2 1378 ω(HCH) / (CH3+CH2)
1582 0.00 4.3 1456 0 1469 0.00 A1 ω(HCH) / (CH3+CH2)
1533 0.61 0.8 1409 1 8 1421 0.32 E 1335 τ(HCH) + ω(HCH) / (CH2)
1533 0.61 0.8 1409 1 8 1421 0.32 E τ(HCH) + ω(HCH) / (CH2)
1506 0.02 0.7 1388 0 1396 0.04 E 1317 τ(HCH) + ω(HCH) / (CH2)
1506 0.02 0.7 1388 0 1396 0.04 E τ(HCH) + ω(HCH) / (CH2)
1455 0.00 36.0 1343 0 1351 0.00 B1 1304 ω(HCH) / (CH2)
1433 0.00 0.0 1324 0 1337 0.00 A2 ω(HCH) / (CH2)
1352 0.11 0.1 1242 2 1266 0.04 E ρ(HCH) / (CH2)
1352 0.11 0.1 1242 2 1266 0.04 E ρ(HCH) / (CH3)
1306 0.00 0.0 1203 0 1222 0.00 B1 ρ(HCH) / (CH2+CH3)
1306 1.31 4.1 1194 2 9 1212 0.66 B2 1185/75 1174 ω(HCH) / (CH3)
1248 0.00 13.3 1157 0 1168 0.00 A1 1116 ω(HCH) / (CH3)
1244 0.00 0.0 1140 0 1157 0.00 A2 ρ(HCH)+ σCCN(CH3 +CH2)
1200 0.19 2.5 1109 7 1116 0.13 E 1071 1069 ω(HCH) / (CH3)
1200 0.19 2.5 1109 7 1116 0.13 E ω(HCH) / (CH3)
1141 0.50 1.5 1065 1 6 1082 0.33 B2 1056 ν(C-C) + ν(N-C)
1121 0.00 4.4 1052 0 1058 0.00 A1 ν(C-C) + ν(N-C)
1094 0.64 9.8 1020 2 1 1030.6 0.42 E 1010 1007 ν(C-C) + ν(N-C)
1094 0.64 9.8 1020 2 1 1031 0.42 E ν(C-C) + ν(N-C)
990 0.08 8.4 904 0 910 0.00 B2 898 910 ω(CCH) + σ(CCN)
974 0.03 1.2 902 0 909 0.00 E ν(N-C) + ρ(CCH)
974 0.03 1.2 902 0 909 0.00 E ν(N-C) + ρ(CCH)
916 0.00 0.7 850 0 852 0.00 B1 ρ(HCH) / (CH2+CH3)
Table 2. Comparison between the observed and calculated wavenumbers (cm-1) of vibrational spectra of NEt 4Br
RHF DFT MP2 Symm. Exp. Mode
cm-1 I
IR IRA cm-1 IIR* cm-1 IIR IR(s) R(s) Assignment
846 1.22 3.4 777 4 3 782 0.76 E 802 789 ν(N-C) + ρ(HCH)(CH2+CH3)
846 1.22 3.4 777 4 3 782 0.76 E ν(N-C) + ρ(HCH)(CH2+CH3)
711 0.00 12.3 662 0 654 0.00 A1 679 ν(N-C) + σ(CCN) + ω(HCH)
564 0.00 0.2 532 0 525 0.01 E σ(CCN) + ρ(HCH)
564 0.00 0.2 532 0 525 0.01 E σ(CCN) + ρ(HCH)
441 0.03 5.2 414 1 420 0.03 B2 476 σ(CCN)
433 0.00 9.9 406 0 407 0.00 A1 421 422 σ(CCN)
394 0.00 0.0 369 0 370 0.00 E 390 ρ(CNC)
394 0.00 0.0 369 0 370 0.00 E ρ(CNC)
377 0.00 0.6 356 0 360 0.00 B1 370 τ(CNC)
364 0.00 0.0 352 0 337 0.00 A2 φ(C-C)
311 0.00 0.1 298 0 288 0.00 B2 ρ(CCN) + ρ(HCH)
254 0.00 0.0 270 0 237 0.00 B1 φ(CH3)
254 0.00 0.1 267 0 237 0.00 E φ(CH3)
254 0.00 0.1 267 0 237 0.00 E φ(CH3)
204 0.00 0.2 196 0 191 0.00 A1 212 σ(CCN)
121 0.00 0.0 129 0 114 0.00 A2 φ(C-C)
110 0.02 0.0 106 1 103 0.01 E σ(CCN)
110 0.02 0.0 106 1 103 0.01 E σ(CCN)
7 5 0.00 0.2 7 5 0 5 9 0.00 B1 φ(C-N)
a Calculated infrared intensities (I
![Figure 2. Infrared vibrational spectrum of the metal complex salt [NEt 4 ] 2 [Zn(dmit) 2 ]: (a) 4000-600 and (b) 600-150 cm -1 .](https://thumb-eu.123doks.com/thumbv2/123dok_br/18990023.460290/4.892.477.758.605.1062/figure-infrared-vibrational-spectrum-metal-complex-salt-net.webp)
![Table 2. Comparison between the observed and calculated wavenumbers (cm -1 ) of vibrational spectra of [NEt 4 ] 2 [Zn(dmit) 2 ]](https://thumb-eu.123doks.com/thumbv2/123dok_br/18990023.460290/6.892.72.798.136.870/table-comparison-observed-calculated-wavenumbers-vibrational-spectra-net.webp)
![Table 3. Main geometrical parameters for the complex anion [Sb(dmit) 2 ] -1 with ab initio calculations and the SBKd basis set](https://thumb-eu.123doks.com/thumbv2/123dok_br/18990023.460290/7.892.144.389.315.437/table-main-geometrical-parameters-complex-anion-initio-calculations.webp)
![Figure 5. Infrared vibrational spectrum of the metal complex salt [NEt 4 ][Sb(dmit) 2 ]: (a) 4000-600 and (b) 600-150 cm -1 .](https://thumb-eu.123doks.com/thumbv2/123dok_br/18990023.460290/8.892.107.372.619.1066/figure-infrared-vibrational-spectrum-metal-complex-salt-net.webp)
![Table 4. Comparison between the observed and calculated wavenumbers (cm -1 ) of vibrational spectra of [NEt 4 ][Sb(dmit) 2 ]](https://thumb-eu.123doks.com/thumbv2/123dok_br/18990023.460290/9.892.96.818.135.868/table-comparison-observed-calculated-wavenumbers-vibrational-spectra-net.webp)
![Figure 8. Vibrational Raman spectrum of the metal complex salt [NEt 4 ][Bi(dmit) 2 ]: (a) 4000-600 and (b) 600-10 cm -1 .](https://thumb-eu.123doks.com/thumbv2/123dok_br/18990023.460290/10.892.490.758.615.1060/figure-vibrational-raman-spectrum-metal-complex-salt-net.webp)
![Table 6. Comparison between the observed and calculated wavenumbers (cm -1 ) of vibrational spectra of [NEt 4 ][Bi(dmit) 2 ]](https://thumb-eu.123doks.com/thumbv2/123dok_br/18990023.460290/11.892.94.827.322.1071/table-comparison-observed-calculated-wavenumbers-vibrational-spectra-net.webp)