Analysis of the Mortality Trend due to Cerebrovascular Accident in
Brazil in the XXI Century
Célia Regina Garritano
1, Paula Mendes Luz
2, Maria Lucia Elias Pires
1, Maria Teresa Serrano Barbosa
1, Keila Moreira Batista
3 Universidade Federal do Estado do Rio de Janeiro1; Instituto de Pesquisa Clínica Evandro Chagas - Fundação Oswaldo Cruz2, Rio de Janeiro, RJ; Universidade Federal do Vale de São Francisco3, Petrolina, PE - BrazilAbstract
Background: Although it is the second leading cause of deaths worldwide, the cerebrovascular accident (CVA) has shown a significant reduction in mortality rates in recent decades.
Objective: To evaluate the trend of CVA mortality rate in Brazil, in both sexes, older than 30 years old, between 2000 and 2009.
Methods: Population data were obtained from the database of the Brazilian Institute of Geography and Statistics (IBGE) and deaths through the Mortality Information System of the Health Surveillance Secretariat of the Ministry of Health, and included codes I60 to I69 according to 10th International Classification of Diseases. We calculated the incidence of deaths/1,000 inhabitants, gross and standardized mortality rates /100,000 inhabitants. The modeling of the trend of rates was performed using regression models.
Results: There was an increase in mortality until 2006, followed by a decline until 2009, when the incidence was the lowest. Comparing the years 2000 and 2009, there is a downward trend in standardized mortality rate in both sexes (male = -14.69% and female = -17%) and total (-14.99%), with fluctuations during the period. Between 30 and 49 years in both sexes, there was a trend of continuous and linear decrease in mortality rate, while the other age groups showed a curvilinear function, leading to an effective decrease in values.
Conclusion: There was a downward trend in mortality in all age groups and both sexes. The reduction in gross mortality rate was more pronounced in males, while the standardized mortality rate showed a greater reduction in females. (Arq Bras Cardiol 2012;98(6):519-527)
Keywords: Stroke/mortality; epidemiology; Brazil.
Mailing Address: Célia Regina Garritano •
Rua Uruguai, 124/402, Tijuca. Postal Code 20510-060, Rio de Janeiro, RJ - Brazil
E-mail: [email protected]
Manuscript received 15/08/11; manuscript revised 16/08/11; accepted 14/12/11.
Introduction
The number of individuals aged > 60 years has significantly increased in recent decades in the world, with projections indicating that by 2050 this group will have approximately 1,900 million people1. In Brazil, this segment of the population
grew by 33.65% over the period 2000 to 20092, and with it,
the chronic noncommunicable diseases (NCDs) have become predominant3,4, especially cardiovascular disease (CVD), which
became the leading cause of death in both sexes in Brazil5,6.
Within the CVD group, cerebrovascular accident (CVA) has become a major cause of death and disability and is considered the second leading cause of death in world7-10. Among all Latin
American countries, Brazil is the one with the highest rates of CVA mortality and the main cause of death among women11.
Even though there has been a decrease in mortality in recent decades, these rates remain very high7,8,12-15.
The aim of this study is to analyze the trend of CVA mortality rates in Brazil (BR) between 2000 and 2009 in both sexes and in different age ranges.
Methods
Data collection
Population data were obtained from the 2000 census and intercensal projections from 2001 to 2009 of the population living in Brazil, carried out by the Brazilian Institute of Geography and Statistics (IBGE)16, and stratified by sex and age range at ten-year
intervals, starting at 30 to 39 years to 80 years or older.
The causes of death were selected according to the International Classification of Diseases (ICD 10) and codes I60 to I69 were included. The number of deaths was obtained through the Mortality Information System (SIM) of the Health Surveillance Secretariat of the Ministry of Health (Datasus)17.
The incidence of deaths was calculated in relation to gender and in total/1,000 inhabitants. The gross mortality rate was calculated according to gender and age range, having as reference the estimated population for each age group and sex in the corresponding year16. To calculate the adjusted mortality,
the one described by the World Health Organization (WHO) in 200018. All calculations were performed with annual data
between 2000 and 2009.
Statistical Methods
For all estimated epidemiological measures, data concerning the incidence of deaths were plotted and the scatter plot showed that a linear or quadratic function should be adjusted. The coefficient of determination (R2) and the maximum point were
determined in each quadratic function, and the years 2000 to 2009 were replaced by 0-9, respectively. The level of significance was set at 5% of probability (α = 0.05).
The graphical presentation of the trend of gross and standardized mortality rates by CVA/100,000 inhabitants was determined by scatter plot.
Statistical analysis was performed using the software Statistical Package for Social Sciences V13.0 (SPSS Inc. Chicago, Illinois, USA) and StatDisk V 8.4 (Addison Wesley Longman Inc).
Results
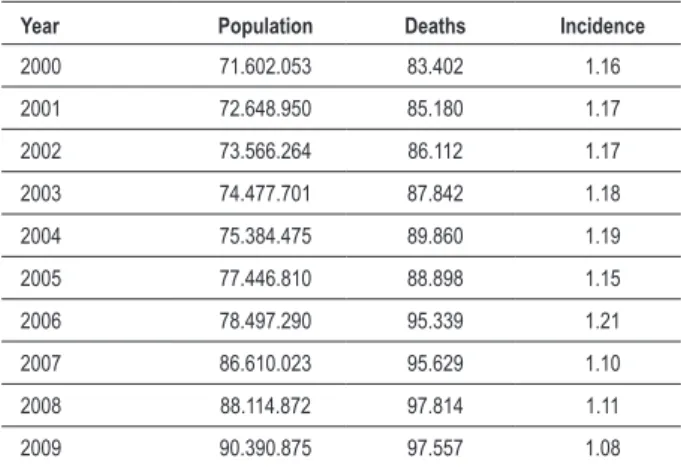
Table 1 (a, b , c) shows the number of deaths from CVA, the population and the incidence of deaths per 1,000 inhabitants in Brazil in the years 2000 to 2009, regarding gender and total numbers.
The tables show an increased incidence of deaths up to a certain year, followed by a decline until 2009, when it reaches the minimum value, suggesting the adjustment of data as a second-degree function, which provided that the functions shown in table 2.
The analysis of Table 2 shows that, statistically (p < 0.05), the data indicate a quadratic function, where the peak incidence of deaths of the male and female sex is close to that of the year 2003, as well as in both sexes.
Considering the absolute number of total deaths, there is a predominance of males (50.61%) over females (49.39%), but when comparing the years 2009 and 2000 there is a greater increase in the number of deaths among women (19.11 +%) when compared to men (+14.92%). Associating age and gender, the number of deaths among women showed a continuous rise with increasing age, whereas among men, the number of deaths in the group aged > 80 years was lower than that in the group aged 70-79 years.
The Gross mortality rate from CVA/100,000 inhabitants, comparing 2009 with 2000, showed a decline of 7.34%, with a greater reduction in males (-8.46%) than in females (- 6.13%). However, fluctuations occurred throughout the period, with the year 2006 showing the highest rates, especially in males. When analyzed by age, it is observed that these oscillations were more pronounced in the group aged > 70 years or older, being more marked in males and that the decrease was continuous only in the range of 30-39 years among men and 30 - 49 and 60-69 years among women (data not shown). Chart 1 shows the curve of the regression trend of the gross mortality rate from CVA /100,000 inhabitants from 2000 to 2009 in both sexes and in total.
The standardized mortality rate from stroke also showed a decrease when comparing the year 2009 with 2000, being in total -14.99%, -14.69% for the male sex and -17% for the female sex (Table 3) .
Table 1 – Incidence of deaths by CVA/1,000 inhabitants from 2000
to 2009
1a – In both sexes
Year Population Deaths Incidence
2000 71.602.053 83.402 1.16
2001 72.648.950 85.180 1.17
2002 73.566.264 86.112 1.17
2003 74.477.701 87.842 1.18
2004 75.384.475 89.860 1.19
2005 77.446.810 88.898 1.15
2006 78.497.290 95.339 1.21
2007 86.610.023 95.629 1.10
2008 88.114.872 97.814 1.11
2009 90.390.875 97.557 1.08
1b – Male sex
Year Population Deaths Incidence
2000 34.187.421 42.569 1.25
2001 34.691.239 43.673 1.26
2002 35.131.298 43.780 1.25
2003 35.569.204 44.934 1.26
2004 36.004.920 45.636 1.27
2005 36.996.001 44.577 1.20
2006 37.500.676 47.864 1.28
2007 41.148.050 48.124 1.17
2008 41.847.966 49.249 1.18
2009 42.918.691 48.921 1.14
1c – Female sex
Year Population Deaths Incidence
2000 37.414.632 40.833 1.09
2001 37.957.711 41.507 1.09
2002 38.434.966 42.332 1.10
2003 38.908.497 42.908 1.10
2004 39.379.555 44.224 1.12
2005 40.450.809 44.321 1.10
2006 40.996.614 47.475 1.16
2007 45.461.973 47.505 1.04
2008 46.266.906 48.565 1.05
2009 47.472.184 48.636 1.02
Table 2 – Quadratic functions related to the adjustment of incidence of death/1,000 inhabitants in relation to years 2000 to 2009, considering the genders and the total
Gender Model Coeficient of determination p Maximum point
Male Yi=1.2273 + 0.0192 xi – 0.0028 xi
2 0.74 0.009 3.42
Female Yi=1.0799 + 0.0216 xi – 0.0031 xi
2 0.61 0.038 3.48
Both Yi=1.1581 + 0.0179 xi – 0.0030 xi2 0.64 0.018 2.98
x = year.
Table 3 – Rate of mortality standardized by CVA /100,000 inhabitants, according to gender, from 2000 ato 2009
Male Female Both
2000 155.54 119.33 135.88
2001 157.96 119.78 137.13
2002 157.24 120.83 137.35
2003 159.69 121.08 138.57
2004 160.8 123.55 140.38
2005 153.8 120.8 135.83
2006 164.05 127.96 144.26
2007 139.13 106.52 121.11
2008 138 105.33 119.97
2009 132.69 99.04 115.51
V% -14.69% -17.00% -14.99%
Chart 1 – Curve of the regression trend of the gross mortality rate/100,000, between 2000 and 2009, according to gender.
10,00 8,00
6,00 4,00
2,00 0,00
130,00
125,00
120,00
115,00
110,00
105,00
100,00
Feminino Masculino Ambos
R Sq Quadratic =0,602 R Sq Quadratic =0,737
R Sq Quadratic =0,606
ano
S
tandardi
zed m
ortal
ity
rate/100.000
Both Male Female
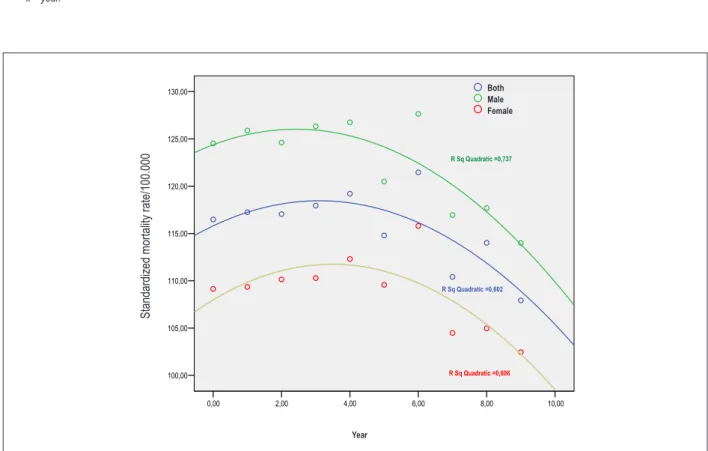
By analyzing Table 4 it can be stated statistically (p <0.05) than the data indicate a quadratic function where the peak incidence of the standardized mortality among men occurred around the year 2002, while among women and in both sexes, it happened in 2003.
Chart 2 shows the curve of the regression trend of the standardized mortality rate from CVA/100,000 inhabitants in both sexes, according to gender in the studied period.
Considering age range and gender, and comparing the year 2009 with 2000, the standardized mortality rate for women showed a greater decline in the age groups of 30-39 years (-33.92%), 70-79 (-13.71 %) and > 80 years (-8.95%) compared to men, who showed respectively -33.10% -10.04% and -0.85%. In other groups there was a slight predominance of decrease in the mortality rate in the male sex (40-49 years = -32.38%, 50-59 years = -29.70%, 60-69 = -21.54%) compared to females (respectively -32.06% -26.77% and -21.51%).
Except for he age groups 30-39 years and 40-49 years, the other age groups showed a fluctuation in the standardized mortality rates, also suggesting the adjustment of data to a second degree function (Table 5).
Chart 3 shows the curve of the regression trend for both sexes according to age range. It can be observed that between 30 and 49 years there was a continuous and linear downward trend of the standardized mortality rate /100,000 in the evaluated period, contrary to the other groups, which showed variations during the study period, but culminating in an effective decrease of the values from the maximum point.
Discussion
CVA is a leading cause of death and disability worldwide, and it has been reported as the cause of approximately 5.7 million deaths in 2005, of which 87% occurred in middle and
Table 4 – Quadratic functions related to the adjustment of the standardized mortality rate/100,000, from 2000 to 2009, considering the genders
and the total
Gender Model Coeficient of determination (R2) p Maximum point
Male Yi=154.309 + 4.373 xi – 0.775 xi2 0.78 0.004* 2.82
Female Yi=111.717 + 5.931 xi – 0.725 xi
2 0.79 0.004* 4.09
Both Yi=129.233 + 5.630 xi – 0.717 xi
2 0.79 0.005* 3.92
x = year.
Chart 2 – Curve of the regression trend of the mortality rate standardized by CVA/100,000, according to gender (2000-09).
10,00 8,00
6,00 4,00
2,00 0,00
160,00
140,00
120,00
100,00
Feminino Masculino Ambos
R Sq Quadratic =0,785
R Sq Quadratic =0,801
R Sq Quadratic =0,791
ano
S
tandardi
zed m
ortal
ity
rate/100.000
Year
Table 5 – Linear and quadratic functions related to adjustment of standardized mortality rate/100,000 in relation to years 2000 to 2009,
considering genders and age ranges
Gender Age range Model Coeficient of determination (R2) p Maximum
point
Male
30-39 years Yi=2.859 - 0.103 xi 0.96 0.000
40-49 years Yi=9.719 - 0.361 xi 0.91 0.000
50-59 years Yi=20.941 + 0.257 xi – 0.089 xi
2 0.92 0.000 1.44
60-69 years Yi=34.906 + 0.213 xi – 0.096 xi
2 0.93 0.000 1.10
70-79 years Yi=45.098 + 1.544 xi – 0.194 xi2 0.78 0.005 3.97
> 80 years Yi=35.502 + 4.213 xi – 0.383 xi
2 0.61 0.003 5.5
Female
30-39 years Yi=2.797 - 0.111 xi 0.96 0.000
40-49 years Yi=8.841 - 0.305 xi 0.91 0.000
50-59 years Yi=13.989 + 0.429 xi – 0.079 xi
2 0.86 0.001 2.71
60-69 years Yi=21.785 + 0.208xi – 0.066 xi2 0.94 0.000 1.57
70-79 years Yi=30.857 + 1.647 xi – 0.193 xi
2 0.74 0.009 4.26
> 80 years Yi=33.494 + 3.833 xi – 0.366 xi
2 0.61 0.036 5.23
Both sexes
30-39 years Yi=2.827 - 0.107 xi 0.98 0.000
40-49 years Yi=9.267 - 0.332 xi 0.92 0.000
50-59 years Yi=17.339 + 0.341 xi – 0.083 xi2 0.90 0.000 2.05
60-69 years Yi=27.864 + 0.214xi – 0.080 xi
2 0.94 0.000 4.33
70-79 years Yi=37.156 + 1.624 xi – 0.197 xi
2 0.77 0.006 4.12
> 80 years Yi=34,746 + 3,691 xi – 0,338 xi
2 0.56 0.005 5.46
x = year.
low-income countries19. This study shows a significant increase
in deaths from CVA when comparing the year 2009 with 2000, especially in females, although the absolute numbers of deaths among men was higher than among women. Lotufo12 reported a
high rate of mortality from CVA in Brazil in the late 1980s, even higher than those found in developed countries. The author also reports that, considering all causes of death in Brazil, CVA has become the main one, bypassing coronary heart disease. This study, when comparing the year 2009 and 2000 and taking into account all causes of death, shows that CVA was responsible for 10.70% of the deaths in 2000 and 10.18% in 2009. Women had higher values in 2000 (F = 12.07%, M = 9.65%) and 2009 (F = 11.38%, M = 9.21%) (data not shown), data similar to those reported by the Pan American Health Organization (Opas)20.
The reduction in CVA mortality began in the mid-1960s and was stabilized at the end of the twentieth century21-24. This
decline was more pronounced in the United States, Canada, Australia, the Western Europe countries and Japan23-26, whereas
the rates are higher in South America and Eastern Europe and still increasing in Eastern Europe countries23-27. Brazil is included in
the context of decrease in the rates of CVA mortality with values that are similar to those of developing countries11,12.28, showing
the highest rates when compared to countries in Latin America12
and South America29.
In this study, we observed that this trend of reduction in CVA mortality in the twentieth century continued into the first decade
of this century. The gross mortality rate showed a slight decrease, which was more evident in males, similar to that found by Smith et al30, while the standardized mortality rate showed a greater
reduction, especially among women, corroborating the results of other studies6,28,30-32.
This decline in CVA mortality is well observed when comparing 2009 with 2000, as the values of these rates varied during this period. We observe that the year 2006 showed the highest values of the incidence of deaths and mortality rates. In fact, when comparing the years 2006 and 2005, we observe that the increase in the number of deaths was much higher (men = 7.12%, females = 7.37%, both = 7.25%) than the increase in population growth during the same period (men = 1.36%, females = 1.35%, both = 1.36%), which did not happen in other years.
Even as the present study confirmed this trend of decrease in CVA mortality in Brazil, the numbers remain high, being higher than those of developed countries and of countries in South America, being considered the four-highest rate among all Latin American countries, which was also reported in other studies8,20,32.
10,00 8,00
6,00 4,00
2,00 0,00
8,00
6,00
4,00
2,00
40-49 anos 30-39 anos
R Sq Linear = 0,981
R Sq Linear = 0,925
ano
Chart 3a – Regression trend of the mortality rate standardized by CVA/100,000, both sexes (2000-09): Trend line of regression of the mortality rate standardized by CVA/100,000, both sexes, from 30 - 49 years (2000-09).
S
tandardi
zed m
ortal
ity
rate/100.000
Year
30 - 39 years 40 - 49 years
10,00 8,00
6,00 4,00
2,00 0,00
50,00
40,00
30,00
20,00
10,00
> 80 anos 70-79 anos 60-69 anos 50-59 anos
R Sq Quadratic =0,9
R Sq Quadratic =0,936
R Sq Quadratic =0,767
R Sq Quadratic =0,564
ano
Chart 3b – Regression trend of the mortality rate standardized by CVA/100,000, both sexes (2000-09): Curve of the regression trend of the mortality rate standardized by CVA/100,000, both sexes, from 50 - > 80 years (2000-09).
S
tandardi
zed m
ortal
ity
rate/100.000
Year
secondary prevention of circulatory diseases and improving the socioeconomic conditions of the population may lead to a decrease in mortality. In addition, the high-tech procedures (angioplasty), a larger number of equipment in hospitals for more accurate diagnosis (CT, MRI) and faster care also help to reduce mortality. However, due to its dimensions, Brazil shows great regional inequality, and healthcare resources are scarce; thus the population of some areas might not be treated with these procedures.
One should also reflect on the death and population data, which may not always correspond to reality. There is no doubt that population studies show results closer to reality than those based on secondary data. However, it should be noted that the secondary data are official and originate from the Ministry of Health, and even though they might contain flaws, they are used for the creation of public policies, and thus should be considered. It is possible that the underreporting or deaths due to ill-defined causes are most often observed among the elderly, especially due to the coexistence of multiple chronic diseases.
According to Jorge et al4, there was a significant decrease
in the proportion of deaths due to ill-defined causes between 1996 and 2005; however, values higher than 20% were recorded in the North and Northeast Brazil. Using the Datasus17 database, we extended this evaluation to 2009
and observed that the North remains with a high percentage (15%), while other regions have values below 10%, although they are still considered significant. We agree with Jorge et al4
about the inappropriate use of terms such as “cardiac arrest”, “multiple organ failure”, “cachexia” and others, when filling out death certificates, often in cases with diagnosis that have been already defined, which compromise a more specific evaluation of the causes of deaths.
Thus, it becomes necessary to raise awareness among health professionals for the correct filling out of forms, certificates or other documents, which are important in the
development of scientific research and implementation of government programs designed to improve the quality of life of the population.
Conclusion
The results of this study show that there was a downward trend in mortality due to CVA when comparing the years 2009 and 2000 and that between 30 and 49 years of age this reduction was linear, while in the others there were fluctuations during the period, culminating in a decrease from a certain point.
The findings showed that the reduction in CVA mortality during the study period was more pronounced in females.
CVA is a public health problem that could worsen if there is no continuity in the improvement of socioeconomic conditions, education, quality of hospital care, primary and secondary control of risk factors.
Acknowledgements
We thank Professor Lauro Boechat for his help with the statistical analyses.
Potential Conflict of Interest
No potential conflict of interest relevant to this article was reported.
Sources of Funding
There were no external funding sources for this study.
Study Association
This article is part of the thesis of Doctoral submitted by Célia Regina Garritano, from Universidade Federal do Estado do Rio de Janeiro.
References
1. Why population aging matters: a global perspective. Bethesda (MD): National Institute on Aging, National Institutes of Health, US Department of Health and Human Services, US Department of State; 2007.p.1-32.
2. World population prospects, the 2010 revision. New York: United Nations, Department of Economic and Social Affairs. Population Division, Population estimates and Projections Sections; 2011. [Cited 2010 Nov 10]. Available from: http://esa.un.org/unpd/wpp
3. Ministério da Saúde. A vigilância, o controle e a prevenção das doenças crônicas não-transmissíveis: DCNT no contexto do Sistema Único de Saúde brasileiro / Brasil. Brasilia: Organização Pan-Americana da Saúde; 2005.
4. Jorge MHPM, Laurenti R, Lima-Costa MF, Gotlieb SLD, Chiavegatto Filho ADP. A mortalidade de idosos no Brasil: a questão das causas mal definidas. Epidemiol Serv Saúde. 2008;17(4):271-81.
5. Barreto ML, Carmo EH. Padrões de adoecimento e de morte da população brasileira: os renovados desafios para o Sistema Único de Saúde. Cienc Saúde Coletiva. 2007;12(supl):1179-90.
6. de Souza Mde F, Alencar AP, Malta DC, Moura L, Mansur Ade P. Serial temporal analysis of ischemic heart disease and stroke death risk in five regions of Brazil from 1981 to 2001. Arq Bras Cardiol. 2006;87(6):735-40.
7. Cabral NL. Avaliação da incidência, mortalidade e letalidade por doenças cerebrovascular em Joinville, Brasil: comparação entre o ano de 1995 e o período de 2005-6. (Projeto JOINVASC). [tese de doutorado]. São Paulo: Universidade de São Paulo; 2008.
8. Lavados PM, Hennis AJ, Fernandes JG, Medina MT, Legetic B, Hoppe, et al. AVC epidemiology, prevention, and management strategies at a regional level: Latin America and the Caribbean. Lancet Neurol. 2007;6(4):362-72.
9. Feigin VL, Lawes CM, Bennett DA, Barker-Collo SL, Parag V. Worldwide stroke incidence and early case fatality reported in 56 population-based studies: a systematic review. Lancet Neurol. 2009;8(4):355-69.
11. Lotufo PA. Stroke in Brazil: a neglected disease. São Paulo Med J. 2005;123(1):3-4.
12. Andre C, Curioni CC, Braga da Cunha C, Veras R. Progressive decline in stroke mortality in Brazil from 1980 to 1982, 1990 to 1992, and 2000 to 2002. Stroke. 2006;37(11):2784-9.
13. Lotufo PA, Bensenor IM.Stroke mortality in São Paulo (1997-2003): a description using the Tenth Revision of the International Classification of Diseases. Arq Neuropsiquiatr. 2004;62(4):1008-11.
14. Cabral NL, Gonçalves AR, Longo AL, Moro CH, Costa G, Amaral CH, et al. Trends in stroke incidence, mortality and case fatality rates in Joinville, Brazil: 1995–2006. J Neurol Neurosurg Psychiatry. 2009;80(7):749-54.
15. Mansur Ade P, Favarato D, Avakian SD, Ramires JA. Trends in ischemic heart disease and stroke death ratios in brazilian women and men. Clinics. 2010;65(11):1143-7.
16. Instituto Brasileiro de Geografia e Estatística (IBGE) [homepage na Internet]. Informações de saúe: estatísticas vitais. Dados censitários e de pesquisas nacionais. [Citado em 2010 set 18]. Disponível em: www.ibge.gov.br
17. Ministério da Saúde. [homepage na Internet]. DATASUS. Informações de Saúde. Estatísticas Vitais. [Citado em 2010 out 12]. Disponível em http://tabnet.datasus.gov.br
18. Ahmad O, Boschi-Pinto C, Lopez AD, Murray CJL, Lozano R, Inoue M. Age standardization of rates: a new WHO standard. Geneva, World Health Organization, 2001.[Cited 2011 Nov 09] Available from: http:// www3.who.int/whoses/discussion_papers/pdf
19. Strong K, Mathers C, Bonita R. Preventing stroke: saving lives around the world. Lancet Neurol. 2007; 6(2):182-7.
20. Pan American Health Organization. PAHO. [homepage na Internet]. Causas principales de mortalidad (Lista Becker) .[Citado 2011 jan 12]. Disponível em: http://ais.paho.org/phip/viz/mort_causasrpincipales
21. Goldacre MJ, Duncan M, Griffith M, Rothwell PM. Mortality rates for stroke in England from 1979 to 2004: trends, diagnostic precision, and artifacts. Stroke. 2008;39(8):2197-203.
22. Peeters A, Bonneux L, Barendregt JJ, Mackenbach JP; Netherlands Epidemiology and Demography Compression of Morbidity Research
Group. Improvements in treatment of coronary heart disease and cessation of stroke mortality rate decline. Stroke. 2003;34(7):1610-6.
23. Ma E, Takahashi H, Mizuno A, Okada M, Yamagishi K, Iso H. Stratified age-period-cohort analysis of stroke mortality in Japan, 1960 to 2000. J Stroke and Cerebrovasc Dis. 2007;6(3):91-102.
24. British Heart Foundation.. Heart Statistics. Statistics Database. [homepage na Internet]. [Citado 2011 jan 21]. Disponível em: http:// www.heartstats.org/homepage.asp
25. Bogousslavsky J, Liu M, Moncayo J, Norrving B, Tsiskaridze A, Yamaguchi T, et al. Stroke In neurological disorders public health challenges. Geneva: World Health Organization ;2006.p.151-63.
26. Liu M, Wu B, Wang WZ, Lee LM, Zhang SH, Kong LZ. Stroke in China: epidemiology, prevention, and management strategies. Lancet Neurol. 2007; 6(5):456-64.
27. Sarti C, Stegmayr B, Tolonen H, Mähönen M, Tuomilehto J, Asplund K; WHO MONICA Project. Are changes in mortality from stroke caused by changes in stroke event rates or case fatality? Results from the WHO MONICA Project. Stroke. 2003;34(8):1833-41.
28. Mansur Ade P, Lopes AI, Favarato D, Avakian SD, César LA, Ramires JA. Transição epidemiológica da mortalidade por doenças circulatórias no Brasil Arq Bras Cardiol. 2009;93(5):506-10.
29. World Health Organization. [homepage na Internet]. WHO Statistical information System (WHOSIS). [Cited 2011 jan 12]. Available from: http://www.who.int/gho/database/WHS2010_Part2
30. Soares GP, Brum JD, Oliveira GM, Klein CH, Silva NA. Mortalidade por todas as causas e por doenças cardiovasculares em três estados do Brasil, 1980 a 2006. Rev Panam Salud Publica. 2010;28(4):258-66.
31. Soares GP, Brum JD, Oliveira GMM, Klein CH, Silva NAS. Mortalidade por doenças isquêmicas do coração, cerebrovasculares e causas mal definidas nas regiões do estado do Rio de Janeiro, 1980-2007. Rev SOCERJ. 2009; 22(3):142-50.