CHARACTERISTICS OF AREAS VULNERABLE TO CLIMATE
CHANGE IN THE ROMANIAN TISA CATCHMENT AREA
ALEXANDRU IONUł PETRI OR
1,
GEORGIANA TOTH
2,
ALINA CHICO
3ABSTRACT – The article summarizes the analysis carried out in two European projects in progress on the Romanian territory of the Tisa Catchment Area and aims to identify areas vulnerable to climate change, and their socio-demographic characterization. In areas identified, the most exposed category of the population is elderly and the most affected economic activity is agriculture.
Keywords: Tisa Catchment Area, climate change, vulnerable areas, socio-demographic profile
In this article, we propose to identify vulnerable areas (of the Tisa Catchment Area) to climate change caused by variations in temperature and precipitation, and their characteristics in terms of socio-demographic indicators. The Tisa Catchment Area represents the studied territory of two European projects in progress: TICAD and ESPON, projects aiming set the base for development policies in this space.
The project “Climate Change and Territorial Effects on Regions and Local Economies in Europe” - ESPON Climate - (project funded under Priority 1 of the ESPON Programme) aims at assessing the impact of climate change on regions of Europe, especially on local and regional economies. As one of the most important resources in development of local economies is human resource, we briefly present the demographic characteristics of the most vulnerable areas delineated in the basin.
Harnessing the results obtained so far through the analysis in the two projects, the first part of the article will summarize the main trends of climate change and land-use patterns, the second part will present the general socio-demographic characteristics of the studied area, while the final part will sketch the demographic profile of the area identified as most vulnerable to climate change.
CHARACTERISATION OF THE TISA CATCHMENT AREA AND CLIMATE CHANGE
Natural conditions
The best description of the natural conditions for a large territory with the size of Tisa river basin is provided by a simple look at the complexes of ecosystems, reflected by the biogeographical regions and ecological zones (Petri or, 2008). Figure 1 reflects the biogeographical coverage, and Figure 2 displays the ecological zoning. The figures indicate that from a biogeographical standpoint, the region covers the alpine region (29.47% of its territory), the continental region (52.56 %), and the Pannonian region (17.97%). The ecological zones consist of Carpathian montane forests (21.74% of its territory) and Pannonian mixed forests (68.26%). Both regional classifications reflect the increased diversity of the area.
1 Scientific researcher, 3rd degree, Urbanproiect, 53-55, Nicolae Filipescu Street, Sector 2, Bucure ti, Romania. E-mail: [email protected]
2 Scientific researcher, 3rd degree, Urbanproiect, 53-55, Nicolae Filipescu Street, Sector 2, Bucure ti, Romania. E-mail: [email protected]
Land use
Land cover and use can easily be described by the CORINE classification (de Lima, 2005). The classification has three levels; the first one reflects land cover, while the next two describe either land use, for man-dominated systems (urban and rural systems and agro-ecosystems), or a more detailed classification of the natural systems (Petri or et al., 2010). While at the scale of the analyzed territory the first level of CORINE has more relevance (Petri or, 2008), especially when analyzed by visualization, Table 1 looks at its coverage at both the first and third level of classification. The situation of land cover is displayed in Figure 3.
At the first level of the classification, agricultural areas and forested or semi-natural areas compose the largest part of the territory (53.74%, respectively 39.64%). Artificial surfaces make up only 5.54% of it, especially the large red spots from Figure 3, corresponding to the municipalities – residence of the counties. At the third level, if looking only at the categories covering at least roughly 5% of the territory, the most important are non-irrigated arable lands (23.34%), pastures (16.78%), areas principally occupied by agriculture, with significant areas of natural vegetation (6.64%), and complex cultivation patterns (5.04%) among the agricultural areas, broad-leaved (24.42%) and coniferous (6.11%) forests among the natural areas, and the discontinuous urban fabric (4.95%) composing most artificial surfaces.
Table 1.Land cover and use in the Romanian Tisa Catchment Area
CORINE
level 1 % CORINE level 2 CORINE level 3 %
Continuous urban fabric 0.01
Urban fabric
Discontinuous urban fabric 4.95
Industrial or commercial units 0.46
Road and rail networks and associated land 0.01 Industrial,
commercial and
transport units Airports 0.02
Mineral extraction sites 0.07
Mine, dump and
construction sites Dump sites 0.02
Green urban areas 0.01
Artificial
surfaces 5.54
Artificial, non-agricultural
vegetated areas Sport and leisure facilities 0.01
Non-irrigated arable land 23.34
Arable land
Rice fields 0.02
Vineyards 0.98
Permanent crops
Fruit trees and berry plantations 1.11
Figure 1. Biogeographical regions of the Romanian Tisa Catchment Area
Pastures Pastures 16.78
Complex cultivation patterns 5.04
Heterogeneous
agricultural areas Land principally occupied by agriculture, with significant
areas of natural vegetation 6.48
Broad-leaved forest 24.42
Coniferous forest 6.11
Forests
Mixed forest 3.43
Natural grasslands 1.53
Moors and heathland 0.32
Forest and semi natural areas
Transitional woodland-shrub 3.71
Beaches, dunes, sands 0.01
Bare rocks 0.02
Forest and semi natural areas
39.64
Open spaces with little or no
vegetation Sparsely vegetated areas 0.11
Wetlands 0.67 Inland wetlands Inland marshes 0.67
Water courses 0.23
Water
bodies 0.41 Inland waters Water bodies 0.18
Apart from the CORINE classes, such analyses allow for looking at the changes as well. Provided the availability of 1990 and 2000 data, the changes occurring at this time were mapped in Figure 4. The image displays land cover changes, consisting of a change of the level 1 CORINE class, and changes at the 3rd level of CORINE classification. The first one may indicate important environmental changes, while the next ones might not be relevant for importance, but provide a general idea of the total magnitude of territorial dynamics (Petri or, 2008; Petri or et al., 2010).
The results indicate that the changes at the first level of the classification are almost invisible, covering 0.04% of the entire territory, while level 3 changes cover 1.12% of it. The latter seem to cluster in some areas in the center, as well as on the eastern and southern borders of the area, and are due to the massive forest cuts (Petri or et al., 2010).
Figure 4.CORINE level 1 and 3 changes in the Romanian Tisa Catchment Area
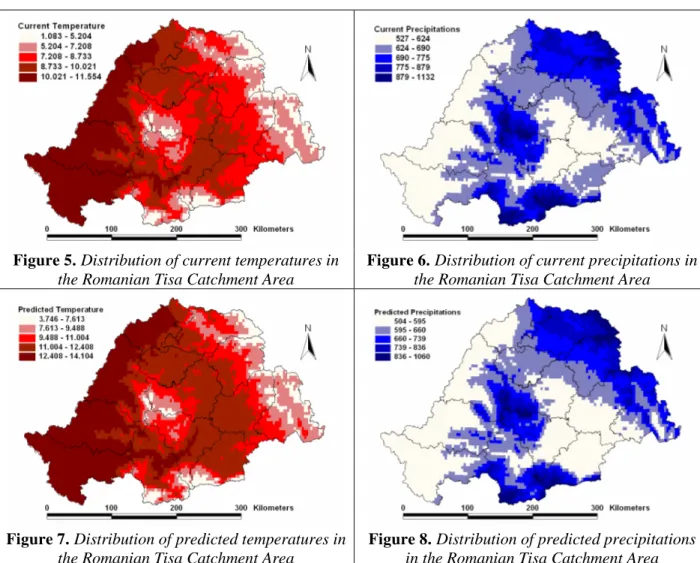
Climatology and climate change
Clime data were available from the DIVA-GIS project developed by Robert Hijmans, freely available from http://www.diva-gis.org. Two data sets were downloaded and used:
1. The actual clime data set was described by Hijmans et al. (2005). Two subsets, referring to temperatures and precipitations, were used. Data were computed for a 2.50 longitude × 2.50 latitude grid and cover the period 1950-2000.
2. Predicted climate data for 2100, described by Govindasamy et al. (2003), are based on 2×CO2 concentration and CCM3 model, and use SSTs based on those from NCAR coupled model, Climate System Model (CSM). Data were computed for a 2.50 longitude × 2.50 latitude grid and cover the period 1950-2000.
State of the environment
Based on the data provided freely on the website of the Romanian Ministry of the Environment, several types of natural protected areas were mapped:
(a) NATURA 2000 sites, consisting of three categories: Sites of Community Importance, Special Protection Areas, and Special Areas of Conservation;
(b) National and natural parks, protected areas defined by the Romanian legislation corresponding to the 2nd, respectively Vth categories of the International Union for the Conservation of Nature and Natural Resources (IUCN, 1994);
(c) Scientific reserves, natural reserves, and natural monuments, protected areas defined by the Romanian legislation corresponding to the 1st, IVth, respectively IIIrd categories of the International Union for the Conservation of Nature and Natural Resources (IUCN, 1994); however, the ministry provides data only for sites with a total area of at least 5 hectares; (d) The area under the incidence of the Convention for the Protection and Sustainable
Development of the Carpathians (Carpathian Convention), which cannot be considered a protected area in the true sense.
The figure underlines the overlaps among the protected areas; nationwide, 49.61% of the NATURA 2000 sites overlap, while if accounting for all categories the overlap between NATURA 2000 areas and the existing national protected areas is 96.19% (Pătroescu et al., 2010). Accounting for
the overlaps, NATURA 2000 areas cover 19.29% of the Romanian part of the Tisa river basin, while all protected areas cover 20.66% of it.
Figure 5.Distribution of current temperatures in the Romanian Tisa Catchment Area
Figure 6.Distribution of current precipitations in the Romanian Tisa Catchment Area
Figure 7.Distribution of predicted temperatures in the Romanian Tisa Catchment Area
Apart from the Carpathian Convention, most and largest protected areas seem to be clustered in the middle and at the eastern and southern edges of the area, regions coinciding with those most severely affected by the climate change (Figures 7 and 8).
Figure 9.Natural protected areas in the Romanian Tisa Catchment Area
SOCIO-DEMOGRAPHIC CHARACTERISTICS OF THE TISA CATCHMENT AREA
The total population of the Romanian Tisa Catchment Area is of 6,035,425 inhabitants (in 2007), representing 28% of the total population in Romania. Analyzing the distribution of population in relation with the settlement size, it results that 33.3% of the population lives in the 15 cities and 33% in rural areas with less than 5000 inhabitants.
The most inhabited counties of the studied zone are Cluj (693,691 inhabitants) and Timi
(665,956 inhabitants), the population if each of these counties being almost 11% of the region’s population. The population in the counties of Maramure , Mure and Bihor is between 500,000-600,000 inhabitants, meaning 8-10% of the total population in the region. On the last places, having less than 350,000 inhabitants, meaning 4-5% of the total population in the studied zone, are the counties of Sălaj, BistriŃa-Năsăud and Harghita.
During 1990-2007, there was a negative growth in the evolution in the number of inhabitants, diminishing with 665001 persons, meaning approximately 10%. The population in the Romanian Tisa Catchment Area diminished with 375809 inhabitants during 1990-2000 and with 289192 during 2000-2007.
Figure 10.Changes in population number between 2002-2007 in the Romanian Tisa Catchment Area
Population density in the Romanian Tisa Catchment Area was of 73 inhabitants per square
kilometre in 2007, less than the national average value of the same year – 90.3 inhabitants per square kilometre. During 2002-2007, the population density decreased steadily from year to year due to fewer inhabitants.
In Cluj, there is the highest value for the population density (103.9 inhabitants per square kilometre in 2002 and 2007), indicating an area of population concentration. The counties of Timi (76.6 inhabitants per square kilometre), Sibiu (77.9 inhabitants per square kilometre), Bihor (78.8 inhabitants per square kilometre), Maramure (81.5 inhabitants per square kilometre), Satu Mare (83 inhabitants per square kilometer) and Mure (86.7 inhabitants per square kilometre) have population densities above the average population density of the studied area in 2007. With low population densities, well below the average of the studied area, both in 2002 and 2007, are the counties of Bistrita (59.2 inhabitants per square kilometre), Arad (59.1 inhabitants per square kilometre) and Harghita (49.1 inhabitants per square kilometre).
At NUTS 5 level there is a high population density in urban poles and their suburban areas. Very low density is localized in the settlements in the south-western parts of the Romanian Tisa Catchment Area, particularly in eastern parts of Arad and Timi and also in the western parts of Cluj and Hunedoara.
Natural reproduction rate recorded in the studied area, in 2007, a negative value (-1.6‰),
During 2002-2007, the natural reproduction recorded negative annual values, with a slight growth trend from year to year, reaching from (-2.6‰) in 2002 (-1.6‰) in 2007. This trend of increase in the natural reproduction occurs in most of the counties in the studied area during 2002-2007. Counties that consistently recorded the lowest levels of natural reproduction are Arad, Hunedoara Sălaj and Alba.
Table 2.Natural reproduction rate in the Romanian Tisa Catchment Area
At NUTS 5 level, the settlements in the Romanian Tisa Catchment Area are characterized by negative natural increase in 2007, the only positive growth areas being those in the eastern part of Sibiu county, in the central part of the north-south axis of Mure , in the southern and western parts of Harghita and in most central part of BistriŃa-Năsăud.
Inside the studied area, the migratory growth had positive values in 2007; but this is due to the
value recorded in Timi county (7.5‰), much higher than the average in the studied area, most counties (Alba, BistriŃa-Năsăud, Harghita, Hunedoara, Maramure , Sălaj) having negative values for
the net migration rate or values close to zero (Mure , Bihor).
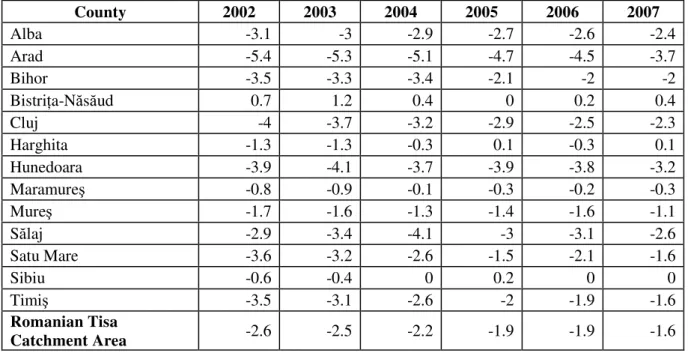
During 2002-2008, the permanent migration rate had a relatively constant evolution, oscillating around zero. The lowest values of this indicator are found in the following counties: Hunedoara (-3.7‰), Maramure (-2.4‰), Sălaj (-1.8‰) and Harghita (-1.7‰).
County 2002 2003 2004 2005 2006 2007
Alba -3.1 -3 -2.9 -2.7 -2.6 -2.4
Arad -5.4 -5.3 -5.1 -4.7 -4.5 -3.7
Bihor -3.5 -3.3 -3.4 -2.1 -2 -2
BistriŃa-Năsăud 0.7 1.2 0.4 0 0.2 0.4
Cluj -4 -3.7 -3.2 -2.9 -2.5 -2.3
Harghita -1.3 -1.3 -0.3 0.1 -0.3 0.1
Hunedoara -3.9 -4.1 -3.7 -3.9 -3.8 -3.2
Maramure -0.8 -0.9 -0.1 -0.3 -0.2 -0.3
Mure -1.7 -1.6 -1.3 -1.4 -1.6 -1.1
Sălaj -2.9 -3.4 -4.1 -3 -3.1 -2.6
Satu Mare -3.6 -3.2 -2.6 -1.5 -2.1 -1.6
Sibiu -0.6 -0.4 0 0.2 0 0
Timi -3.5 -3.1 -2.6 -2 -1.9 -1.6
Romanian Tisa
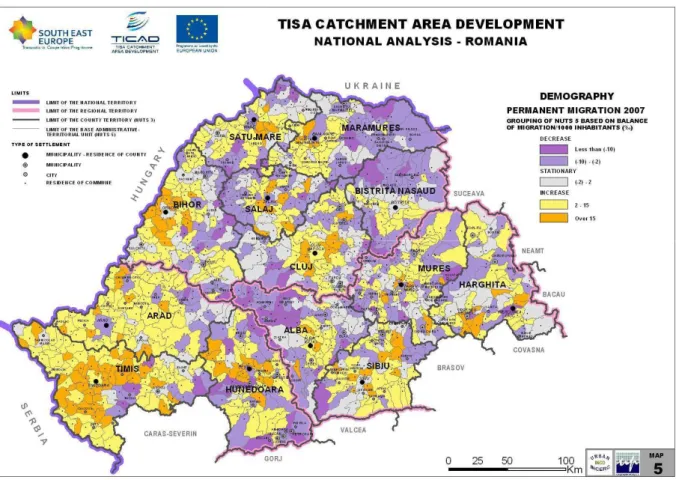
Figure 11.Permanent migration rate in 2007 in the Romanian Tisa Catchment Area
At NUTS 5 level, in 2007, there was a negative migration growth for the settlements in the eastern and central parts of the Romanian Tisa Catchment Area; the eastern part is bounded by the central-eastern axis of Maramure county and by the central-northern part of BistriŃa-Năsăud county,
while the central part is bounded by the north-western part of Alba county and by the south-western part of Cluj county (Figure 11). The most attractive areas for residents are the settlements in the central parts of the counties of Timi , Hunedoara and Cluj, and also the settlements in the western parts of Bihor county. In Timi county, there are the most settlements with positive migration. The settlements around the county residence urban centres have the highest migration rates.
Table 3.Natural dependency ratio by age
County 1990 2000 2002 2007
Alba 52.4 46.5 46.1 43.1
Arad 48.8 47.5 47.0 43.2
Bihor 50.0 46.9 46.3 43.6
BistriŃa-Năsăud 50.7 49.4 48.0 44.0
Cluj 47.9 41.7 41.8 39.4
Harghita 53.7 45.7 45.2 43.5
Hunedoara 43.7 42.0 42.3 40.4
Maramure 52.5 44.4 43.2 40.6
Mure 52.0 47.3 47.0 45.6
Sălaj 56.6 51.5 49.9 47.1
Satu Mare 52.9 44.6 43.7 39.7
Sibiu 50.0 43.5 42.5 40.1
Timi 47.0 42.1 42.3 38.4
Romanian Tisa Catchment Area 54.1 45.0 44.6 41.8
At NUTS 5 level, the demographic dependency ratio had, in 2006, the lowest values in the settlements in the extreme eastern, south-western and northern parts of the Romanian Tisa Catchment Area. These are also the areas with a higher birth rate compared to the rest of the territory. Toward the center of the Romanian Tisa Catchment Area, especially in the counties of Sălaj, Cluj and Mure , the
indicator exceeds 65%, which means a greater social pressure than in other areas towards the population able to work from the inactive age population.
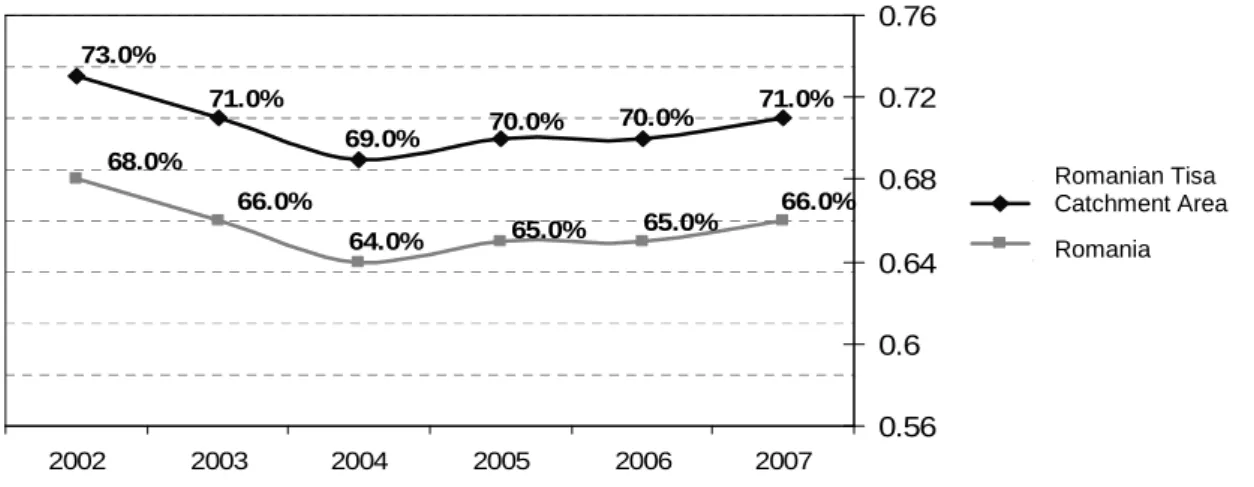
As the employment rate is higher in the Romanian Tisa Catchment Area compared to national average, also the activity rate has higher values than the national average for the entire analyzed
period. The activity rate is calculated here as a share of the working population in working age population, or more specifically, in the total labour resources (15-64 years), as defined in national statistics. Compared to benchmark year of 2002, at the end of the analysed period, the rate values decrease in the Tisa Catchment Area, following the same trend as the national activity rate.
Figure 12.The evolution of the activity rate during 2002-2007 (%)
At NUTS 3 level, in 2007, the highest activity rates were recorded in the counties of Bihor, Alba, Timi , Cluj and Arad. The lowest values of this indicator, even below the national average (66%) were in the counties of Maramure and BistriŃa-Năsăud.
73.0%
71.0%
69.0% 70.0% 70.0%
71.0%
68.0%
66.0%
64.0% 65.0% 65.0%
66.0%
2002 2003 2004 2005 2006 2007
0.56 0.6 0.64 0.68 0.72 0.76
Bazin TISA Romania
Romanian Tisa Catchment Area
Rata de inactivitate in perioada 2002-2007 0.0 10.0 20.0 30.0 40.0 50.0 ALB A AR AD BIH OR BIS TR ITA NA
SAUD CLU J HA RG HIT A HU NED OA RA MA RAM UR ES MU RE S SAT U M
AR E SA LAJ SIB IU TIM IS 2002 2003 2004 2005 2006 2007
The inactivity rate is the share of inactive population in total labour resources in a territory.
While at the beginning of the studied period, the inactivity rate had the lowest values, in 2004, there was recorded the highest value for the Romanian Tisa Catchment Area (an average of 30.7%), and after that year, the decline started again. In 2007, this indicator reached similar values to 2003. The evolution of this indicator has a trend similar to the one on national level, but its values were always lower than the national average.
Figure 13.The inactivity rate at NUTS 3 level during 2002-2007 (%)
At NUTS 3 level, the counties of Bihor, Alba and Timi have the lowest inactivity rates (see chart above), which is explained by the existence, in these counties, of employment rates among the highest, compared with others in the Tisa Catchment Area. Conversely, BistriŃa-Năsăud, Maramure
and Satu Mare are the counties with the highest inactivity rates.
The unemployment rate in the Romanian Tisa Catchment Area follows a steady downward
trend, similar to the national level, but with values much lower than national averages (see chart below). At NUTS level 3, the counties of Alba, Harghita and Hunedoara have the highest unemployment rates throughout the period (5.7%, 5.1% and 4.8% in 2007), while the counties of Arad and Timi have the lowest unemployment rates (2.3% and 1.6%).
Figure 14. The evolution of unemployment rate during 2002-2007 (%)
7.1% 6.5% 5.5% 5.2% 4.6% 3.5% 8.4% 7.4% 6.3% 5.9% 5.2% 4.0%
2002 2003 2004 2005 2006 2007
Roma Bazin
It is important to point out that after this period, the unemployment increases due to financial crisis that also affected the Eastern European countries. The unemployment rate in the EU 27 follows a decreasing trend since 2003, reaching 7.1% in 2007. Compared to this average, the unemployment rate in the studied area was lower by 3.6 percentage points, but in the economic context indicates a high probability of a trend changing to increase.
The average monthly wage of the population working in economy was, in 2007, for the
Romanian Tisa Catchment Area, of 350 euros, with above average values in Cluj, Timi oara and Sibiu and with the lowest values in the counties of Harghita, Bihor and Maramure .
Table 4. Average monthly gross income in the major sectors in 2007
County Average monthly gross income, in 2007 (EUR) Average monthly gross income in Agriculture, in 2007 (EUR) Average monthly gross income in Fishing, in 2007 (EUR) Average monthly gross income in Industry, in 2007 (EUR) Average monthly gross income in Construction, in 2007 (EUR) Average monthly gross income in Services, in 2007 (EUR)
Alba 352.22 313.97 170.02 325.87 350.81 415.73
Arad 360.16 304.34 205.72 329.56 362.71 434.18
Bihor 307.74 273.73 290.45 279.68 311.14 390.79
BistriŃa-Năsăud 337.21 237.18 159.54 321.05 277.13 394.92
Cluj 421.93 306.04 360.44 371.78 384.24 501.43
Harghita 306.32 259.00 336.36 263.25 247.38 375.71
Hunedoara 357.61 239.44 161.24 408.05 279.97 394.92
Maramure 311.99 280.82 133.18 243.13 299.80 414.44
Mure 358.46 248.51 220.74 370.93 278.55 411.67
Satu Mare 331.82 295.55 210.82 294.42 248.23 411.39
Sălaj 342.31 262.11 151.60 328.42 403.80 391.64
Sibiu 374.04 313.40 191.56 361.29 357.61 436.26
Timi 398.13 338.62 426.47 378.29 355.34 483.96
Romanian Tisa Catchment Area
350.76 282.52 232.16 328.90 319.75 419.77
The average wage was, in 2007, between a minimum of 306 euros (Harghita) and a maximum of 422 euros (Cluj). Estimating the average monthly income from main business sectors shows that the most important economic sector that offers income is the one of the services (419 euros), followed by industry (328 euros) and construction (319 euros). The highest gross wages in services were in the counties of Cluj and Timi (501 and 483 euros, respectively), the highest gross wages in industry were in the counties of Hunedoara and Timi (408 and 378 euros, respectively) and highest gross wages in construction were in the counties of Sălaj and Cluj (403 and 384 euros respectively). Timi is placed in
a favourable position, holding also the highest levels of income from agriculture and fishing (338 and 426 euros, respectively).
Weaknesses: very low share of urban population (between 36.6 and 47.7%) in four counties, associated with slight downward trend of the indicator in the whole area; continuous downward trend in the share of urban population; negative population growth rate in 2007 compared to 1990 in all counties of the studied area; the most important decreases being recorded in: Sibiu (16.8%), Hunedoara (16.5%), Alba (12.3%), Satu Mare (12.3%), Harghita (10.5%) and Bihor (10.3%); the population density declined steadily, as a result of fewer inhabitants; negative natural increase in most counties (except for the counties of Harghita and Sibiu, where the value of natural increase is close to zero) is a consequence of low birth rates; aging population in all counties of the studied area, as a result of a constant decline of the young age population (0-14 years); high rate of unemployment in the counties of Alba, Harghita and Hunedoara; decreasing activity rate and therefore growing inactivity rate of in the Tisa catchment area in 2007 compared to 2002, low average monthly salary of those employed in economy, in the counties of Harghita, Bihor, Maramure .
Opportunities: rising living standards due to economic activities and to high share of active population in the Romanian Tisa catchment area compared to the national value; adopting pro-natalist policies; attracting young population in the area based on the migration process;
Threats: continuing the trend of population decline; depopulation by heavy migration, especially among young people of the area, recorded in some settlements with economic and social decline; increased phenomenon of demographic aging because of low birth rates in all the counties of the studied area; ruralization trend by return migration from urban to rural settlements; migration of young population to urban settlements; increased socio-economic development gap between rural and urban settlements; increased unemployment rates due to the strong financial crisis installed after 2008 in the East-European countries.
THE DEMOGRAPHIC PROFILE OF THE AREAS MOST VULNERABLE TO CLIMATE CHANGE
Comparing indicators of exposure to climate change, temperature and rainfall (Figures 5-7/6-8), it outlines two categories of vulnerable areas on the Romanian territory of the Tisza river basin:
- The first category, which contains two areas with a high probability of reducing the existing rainfall quantity: in the south-east of the catchment area (a part of the counties of Harghita, Mure and Sibiu) and in its centre (the counties of Cluj, Sălaj and Satu Mare)
- The second category, which contains an area with a high probability of increasing the existing temperature, located in the centre of the basin, on the north – south axis, including parts of the counties of Sălaj, Cluj, Alba Iulia and Sibiu
By superposing the two categories of territories, it results two areas with the highest degree of vulnerability to climate changes caused by temperature increase while reducing the volume of rainfall: an area in the south-eastern part of Sibiu county and one in the centre of Sălaj county and north of Cluj
county.
In socio-demographic terms, the south-eastern part of Sibiu county, is characterized by:
-
low population density;-
population growth during 2002-2007, based both on natural growth and on migration growth;-
decrease in the share of population aged 0-14 and increasing share of elderly in 1990-2007;-
decrease of the dependency ratio by age in the period 2002-2007;-
decrease in the activity rate of labour resources in the period 2002-2007;The second area, located in the centre of Sălaj county and in the north of Cluj county, in
socio-demographic terms, is characterized by:
- low population density, except the area around the city of Zalău;
- slight decrease in population number during 2002-2007, driven mainly by natural movement;
- high value for age dependency ratio in 2007, based on the growing share of elderly population;
- increased share of unemployment;
- gross monthly income in 2007 below the average in the studied area, with the highest value in construction and the lowest in agriculture.
It can be concluded that in areas most vulnerable to climate change, the most exposed category of population is the elderly population. In socio-economic terms, climate change will have a negative impact by decreasing the activity rate, along with an increasing share of unemployment, aspects that will affect the living standards of people in these areas. The most affected branch of the national economy will be agriculture, which, in addition to structural dysfunctions, will register a decline caused by environmental changes.
REFERENCES
DE LIMA N. M. V. (2005), IMAGE2000 and CLC2000 Products and Methods, Institute for
Environment and Sustainability, Ispra, Italy, 150 p., ISBN 92-894-9862-5.
GOVINDASAMY B., DUFFY P. B., COQUARD J. (2003), High-resolution simulations of global climate, part 2: effects of increased greenhouse cases, in Climate Dynamics, 21:391-404.
HIJMANS R. J., CAMERON S. E., PARRA J. L., JONES P. G., JARVIS A., (2005), Very high resolution interpolated climate surfaces for global land areas, International Journal of
Climatology, 25:1965-1978.
PĂTROESCU M., ROZYLOWICZ L., IOJĂ C., POPESCU V. (2010), Efficacy of the protected area system in Romania after the implementation of NATURA 2000 network (in Romanian), in:
Biodiversitate: prezent i perspective. Simpozion omagial, ConstanŃa, 7-9 iunie 2010, Ovidius
University Press, ConstanŃa, Romania, p. 40, ISBN 978-973-614-552-0.
PETRI OR A.-I. (2008), Levels of biological diversity: a spatial approach to assessment methods, in
Romanian Review of Regional Studies, 4(1):41-62.
PETRI OR A.-I., IANO I., TĂLÂNGĂ C. (2010), Land cover and use changes focused on the urbanization processes in Romania, in Environmental Engineering and Management Journal,
9(6):765-771.
*** (1994), Guidelines for protected areas management categories, International Union for the