EEG changes during sequences of
visual and kinesthetic motor imagery
Marcus Vinicius Stecklow1, Antonio Fernando Catelli Infantosi1,
Maurício Cagy2
ABSTRACT
The evoked cerebral electric response when sequences of complex motor imagery (MI) task are executed several times is still unclear. This work aims at investigating the existence of habituation in the cortical response, more specifically in the alpha band peak of parietal and occipital areas (10-20 international system electroencephalogram, EEG, protocol). The EEG signals were acquired during sequences of MI of volleyball spike movement in kinesthetic and visual modalities and also at control condition. Thirty right-handed male subjects (18 to 40 years) were assigned to either an ‘athlete’ or a ‘non-athlete’ group, both containing 15 volunteers. Paired Wilcoxon tests (with α=0.05) indicates that sequential MI of complex tasks promotes cortical changes, mainly in the power vicinity of the alpha peak. This finding is more pronounced along the initial trials and also for the athletes during the modality of kinesthetic motor imagery.
Key words: motor imagery, alpha band, volleyball.
Alterações no EEG durante sequencias de imagética motora visual e cinestésica
RESUMO
A resposta elétrica cerebral evocada quando sequencias de imagética motora (MI) de tarefas complexas são executadas seguidamente no tempo permanecem desconhecidas. Este trabalho objetivou investigar a existência de habituação da resposta cortical, mais especificamente na banda do pico de alfa de áreas parietais e occipitais (sistema internacional 10-20, eletroencefalograma, protocolo de EEG). Os sinais de EEG foram adquiridos durante sequências de MI do movimento de ataque do voleibol nas modalidades cinestésica e visual, e também em condição de controle. Trinta voluntários adultos (entre 18 e 40 anos), destros, do gênero masculino foram agrupados como ‘atletas’ ou ‘não-atletas’, sendo cada grupo composto de 15 voluntários. Testes pareados de Wilcoxon (com α=0.05) indicaram que a MI sequencial de tarefas complexas promoveram alterações nas respostas corticais, mais especificamente na região ao redor do pico de alfa. Este achado foi mais pronunciado ao longo dos trechos iniciais e também nos atletas durante a modalidade cinestésica de imagética motora.
Palavras-chave: imagética motora, banda alfa, voleibol.
Correspondence
Marcus Vinicius Stecklow Av. Horácio Macedo 2030 Edifício do Centro de Tecnologia Bloco H / sala 327
21941-914 Rio de Janeiro RJ - Brasil E-mail: [email protected]
Support
CNPq and FAPERJ
Received 7 April 2009
Received in final form 21 December 2009 Accepted 29 December 2009
Laboratório de Processamento de Imagens e Sinais Biológicos do Programa de Engenharia Biomédica (PEB) do Instituto Alberto Luiz Coimbra de Pós-graduação e Pesquisa em Engenharia (COPPE) da Universidade Federal do Rio de Janeiro, Rio de Janeiro RJ, Brazil: 1Federal University of Rio de Janeiro, Biomedical Engineering Program, Rio de Janeiro RJ, Brazil; 2Fluminense Federal University, Department of Epidemiology and Biostatistics, Niterói RJ, Brazil.
Motor imagery (MI) has been consid-ered a dynamic mental process associated with motor task simulation without real execution1 constituting a purely cognitive activity2. It has been shown that MI im-proves the muscular force3 and physical performance in many diferent tasks, such as surgical techniques4 and sport
move-ments5. The MI usually is performed in kinesthetic modality (KMI), characterized by ‘feeling’ joint movements and muscles activations generating kinesthetic impres-sions, and in visual modality (VMI), when the subject forms himself a mental image, like still observing the such motor task.
activate diferent neuron networks6, including the left pa-rietal7 and visual cortex8. his cortical activation can be assessed by diferent techniques such as time response paradigms9, neuroimaging8 and electroencephalogram 6,10-12 (EEG). Similar to external stimuli event-related
poten-tials (ERP) visual13,14 and auditory15, the MI (so called in-ternal stimuli) also originate ERPs12,16. In frequency do-main, some studies16,17 have focused the cerebral chang-es observing the event-related dchang-esynchronization (ERD) and event-related synchronization (ERS). However, other studies only observe the behavior of power spectrum10,11,18.
Usually, the cerebral activity investigation with MI paradigms is based on the mean power in EEG frequency bands10,19, mainly in alpha band (8-13 Hz). In many works, the alpha band has been functionally divided in lower and upper sub-bands. However, these studies do not con-sider that such alpha activity may difer inter-individual-ly according to inheritance20, age21, gender and cognitive state22,23. he variation is more pronounced at the fre-quency where the maximum power contribution occurs, so called the alpha band peak (ABP). Since the activity in alpha band is associated with mental efort during men-tal tasks, and also with the habituation of cerebral waves when stimuli are sequentially presented24, we hypothesize that an accommodation in cortical response may occur. Such accommodation would be relected as changes in the frequency domain, more speciically in ABP of pari-etal and occipital areas, if a sequence of complex MI task is executed several times. Hence, this work aims at inves-tigating the existence of habituation in alpha band power, focusing the frequencies around the alpha peak, during sequences of MI of the spike volleyball movement.
METHOD
he casuistry was composed of 15 elite athletes of in-door volleyball (GA) and 18 subjects without experience in this sport (GNA). All subjects of both groups were right handed. he volunteers answered a personal information questionnaire about athletic history and indicated no neu-rological disturbs nor the use of drugs that could afect the cognitive performance. All tests were carried out in the Laboratory of Cerebral Mapping and Motor Senso-ry Integration (PsychiatSenso-ry Institute) and the LaboratoSenso-ry of Image and Signal Processing (Biomedical Engineering Program) both from Federal University of Rio de Janeiro. his study was submitted and approved by ethical com-mittee, and all volunteers signed an informed consent. The Revised Movement Imagery Questionnaire25 (MIQ-R), concerning four movements and their respec-tive motor imagery tasks in kinesthetic and visual modal-ities, was translated to Portuguese and then applied to en-sure that all subjects could see or feel mental images with a minimum of clearness. As exclusion criterion, the sum
of scores in each subscale below 15 yielded the exclusion of 3 subjects from GNA.
Before the EEG acquisition, a 5-min video showing an expert athlete during execution of several trials of spike volleyball movement task in diferent points of view was displayed on a monitor for all subjects in order to demon-strate the correct execution of attack movement. Volun-teers seated comfortably with closed eyes in a silent room, and Ag/AgCl electrodes were placed according the inter-national 10-20 system26 with ear lobes reference.
EEG signals were acquired with BNT-36 electroen-cephalograph (EMSA – Rio de Janeiro), previously il-tered (anti-aliasing of 100 Hz and high-pass of 0.1 Hz) and sampled at 240 Hz (using digital 60 Hz notch ilter), in three diferent conditions: control condition (CON), kinesthetic motor imagery and visual motor imagery. CON was composed of unitary mental countdown start-ed at number 1000 during 90 s and was registerstart-ed pre-ceding MI conditions and in the inal of experiment. his counting task aimed at maintaining a standard mental engagement for all volunteers, which would be diicult to achieve if the subjects were requested “not to think in anything”. KMI and VMI conditions had 30 target MI als of volleyball attack randomly intermixed with 20 tri-als of handclapping in kinesthetic and visual motor im-agery respectively. he start of each trial was triggered by a beep in one of two tonalities to indicate the task to be imagined (volleyball attack or handclap), preceded by a preparation beep presented 2 s before. his procedure was applied to avoid the subjects to anticipate the MI ex-ecutions before the trigger sounds. After the end of KMI and VMI all subjects reported the imagery vividness of each condition block using the respective MIQ-R sub-scales.
In our study, the EEG signals from occipital (O1 and O2) and parietal regions (P3 and P4) were investigated. For each imagery trial, a 5 s epoch duration synchronized by the starting of the beep trigger in KMI (or VMI) condi-tion was selected. For both experimental condicondi-tions, KMI and VMI, an algorithm27 based in irst and second statis-tic moments was adapted and implemented to allow re-moving artifacts. By applying this procedure, 24 artifact-free epochs were selected for each of these conditions. In order to assess changes in alpha band peak (ABP) along the experiment, the 24 epochs set was sub-divided into three distinct sequences (S1, S2 and S3). he irst eight consecutive epochs were included in S1, the next eight in S2 and the remaining in S3.
Table 1. MIQ-R means score.
Kinesthetic Visual p-conditions
Athletes 21.73 23.67 0.22
Non-Athletes 20.79 21.14 0.84
p-groups 0.53 0.10
MIQ-R: revised movement imagery questionnaire.
Table 2. Clearness of MI of volleyball attack.
KMI VMI p-conditions
Athletes 6.00 5.60 0.25
Non-Athletes 4.20 4.47 0.63
p-groups <<0.01* 0.04*
MI: motor imagery; KMI: kinesthetic modality; VMI: visual modality.
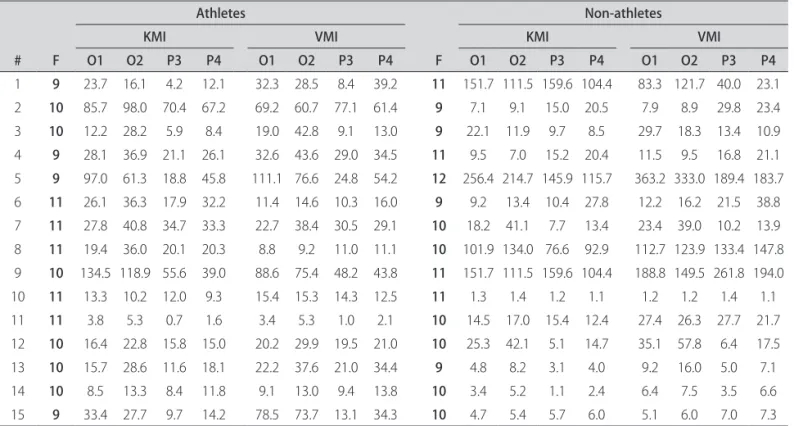
Table 3. Absolute values of power (in µV2/Hz) at alpha band peak in sequence S1, and the alpha peak frequency (in bold columns) in Hertz, for all subjects.
# F
Athletes
F
Non-athletes
KMI VMI KMI VMI
O1 O2 P3 P4 O1 O2 P3 P4 O1 O2 P3 P4 O1 O2 P3 P4
1 9 23.7 16.1 4.2 12.1 32.3 28.5 8.4 39.2 11 151.7 111.5 159.6 104.4 83.3 121.7 40.0 23.1 2 10 85.7 98.0 70.4 67.2 69.2 60.7 77.1 61.4 9 7.1 9.1 15.0 20.5 7.9 8.9 29.8 23.4 3 10 12.2 28.2 5.9 8.4 19.0 42.8 9.1 13.0 9 22.1 11.9 9.7 8.5 29.7 18.3 13.4 10.9 4 9 28.1 36.9 21.1 26.1 32.6 43.6 29.0 34.5 11 9.5 7.0 15.2 20.4 11.5 9.5 16.8 21.1 5 9 97.0 61.3 18.8 45.8 111.1 76.6 24.8 54.2 12 256.4 214.7 145.9 115.7 363.2 333.0 189.4 183.7 6 11 26.1 36.3 17.9 32.2 11.4 14.6 10.3 16.0 9 9.2 13.4 10.4 27.8 12.2 16.2 21.5 38.8 7 11 27.8 40.8 34.7 33.3 22.7 38.4 30.5 29.1 10 18.2 41.1 7.7 13.4 23.4 39.0 10.2 13.9 8 11 19.4 36.0 20.1 20.3 8.8 9.2 11.0 11.1 10 101.9 134.0 76.6 92.9 112.7 123.9 133.4 147.8 9 10 134.5 118.9 55.6 39.0 88.6 75.4 48.2 43.8 11 151.7 111.5 159.6 104.4 188.8 149.5 261.8 194.0 10 11 13.3 10.2 12.0 9.3 15.4 15.3 14.3 12.5 11 1.3 1.4 1.2 1.1 1.2 1.2 1.4 1.1 11 11 3.8 5.3 0.7 1.6 3.4 5.3 1.0 2.1 10 14.5 17.0 15.4 12.4 27.4 26.3 27.7 21.7 12 10 16.4 22.8 15.8 15.0 20.2 29.9 19.5 21.0 10 25.3 42.1 5.1 14.7 35.1 57.8 6.4 17.5 13 10 15.7 28.6 11.6 18.1 22.2 37.6 21.0 34.4 9 4.8 8.2 3.1 4.0 9.2 16.0 5.0 7.1 14 10 8.5 13.3 8.4 11.8 9.1 13.0 9.4 13.8 10 3.4 5.2 1.1 2.4 6.4 7.5 3.5 6.6 15 9 33.4 27.7 9.7 14.2 78.5 73.7 13.1 34.3 10 4.7 5.4 5.7 6.0 5.1 6.0 7.0 7.3
KMI: kinesthetic modality; VMI: visual modality.
∑
−=
=
1
0 ) (
)
(
~
1
)
(
ˆ
Mm m xx
E
P
f
M
f
P
,where
P
ˆ
E(
f
)
is the PSD of the epoch,=
M=5 the num-ber of segments (no overlap) and∑
−1
0 ) (
)
(
~
mxx
f
P
, is theestimat-ed spectrum of m-th segment, with spectral resolution of 1 Hz. he objective of using the rectangular window was minimizing near-frequency leakage of the spectrum ob-tained from original signal. Finally, the PSD of each se-quence was calculated as the mean of the eight
P
ˆ
E(
f
)
of=
the sequence epochs.To account for the inter-individual alpha peak vari-ability (frequency of maximal contribution of band pow-er), the power was estimated within a narrow band of 2 Hz (ABP) centered in alpha peak using the trapezoidal method, which corresponds to calculating the area be-low the three points of discrete spectrum, laterally limited by frequencies ±1 Hz around the alpha peak. he MIQ-R scores and vividness during experiment were analyzed with independent-samples (inter-groups) and
paired-samples (intra-groups) Student t-test (α=0.05). Since the EEG power can hardly be ascribed a Gaussian distribu-tion, the Wilcoxon (paired, non-parametric) test (α=0.05) was used to evaluate the diferences in ABP between S1, S2 and S3. Hence, for any of these tests, one has less than 5% probability of error when inferring to reject the null hypothesis of equality.
RESULTS
No statistical diferences were found in MIQ-R mean scores between groups or MI modalities as indicated in t-test scores of Table 1. However, the MI of volleyball at-tack is much clearer in athletes imagining themselves than non-athletes according to the p-values indicated in the Table 2. he intra-group comparison indicated no sig-niicant diferences in clearness between MI modalities for both groups.
in-ter-individual variability of such parameters between the groups of athletes and non-athletes, and also within each of the groups. For example, it is notable that although ath-letes #2 and #3 have the same alpha peak frequency (10 Hz), the power contribution at this frequency in deriva-tion O1 during KMI are very diferent, 85.7 µV2/Hz for athlete #2 and only 12.2 µV2/Hz for athlete #3. Similar comment can be done about derivation O2 during VMI
for non-athletes (#7 and #8) who have also alpha peak fre-quency at 10 Hz and power contribution at this frefre-quency of 23.4 µV2/Hz for non-athlete #7 and 112.7 µV2/Hz for non-athlete #8. Wilcoxon test was applied to assess the null hypothesis (H0) of equal median power in ABP
com-paring the sequences in couples to both MI modalities. Statistical diferences were observed between S1 and S2 in left occipital and parietal areas (O1 and P3), and only
Table 4. p-values of Wilcoxon tests comparing the ABP mean power between sequences during visual motor imagery condition for all electrodes. The [*] indicate the comparisons where p<α.
KMI
Athletes Non-athletes
S1 × S2 S1 × S3 S2 × S3 S1 × S2 S1 × S3 S2 × S3
O1 0.0479* 0.2293 0.4573 0.3591 0.4212 0.3894
O2 0.0730 0.0833 0.1070 0.1688 0.5614 0.1876
P3 0.0215* 0.0256* 0.1688 0.8469 0.9341 0.1354
P4 0.0946 0.0479* 0.1688 0.0054* 0.8040 0.1070
ABP: alpha band peak; KMI: kinesthetic modality.
Table 5. p-values of Wilcoxon tests comparing the ABP mean power between sequences during visual motor imagery condition for all electrodes. The [*] indicate the comparisons where p<α.
VMI
Athletes Non-athletes
S1 × S2 S1 × S3 S2 × S3 S1 × S2 S1 × S3 S2 × S3
O1 0.3591 0.0256* 0.2293 0.0833 0.1876 0.8469
O2 0.1070 0.1514 0.4543 0.1070 0.5245 0.8040
P3 0.4543 0.0637 0.1876 0.5995 0.7197 0.3028
P4 0.0413* 0.0637 0.4543 0.5245 0.2524 0.5245
ABP: alpha band peak; VMI: visual modality.
Fig 1. Mean alpha power (kinesthetic motor imagery condition) in arbitrary scale of three sequences (S1, S2 and S3) from athlete #6 in respective left and right occipital [A, B] and parietal [C, d] deri-vations. The grey area indicates the ABP.
in parietal areas (P3 and P4) comparing S1 and S3 in KMI for athletes. Table 4 shows the results for all analysis with p-values obtained in Wilcoxon tests. he comparison be-tween sequences for non-athletes reveals signiicant dif-ference only between S1 and S2 in right parietal site. One example of ABP changes is illustrated on the Fig 1, where the left and right respective occipital [A,B] and parietal [C,D] sites in athlete #6 have mean power in S1 (contin-uous line) notoriously higher than S2 (hatched line) and S3 (dotted line) for both sites.
Observing Table 5, which summarizes the results of Wilcoxon tests between distinct moments in VMI, sig-niicant diferences have been found in the athlete group for P4 between S1 and S2, and for O1 site between S1 and S3. In non-athlete group, no diferences were found in any comparison. As observed in KMI, no diferenc-es were encountered between S2 and S3 for all sitdiferenc-es in VMI for both groups. Fig 2 shows the left and right re-spective occipital [A,B] and parietal [C,D] derivations of non-athlete #5. Based on the morphology and the ampli-tude of the power spectrums, one cannot identify difer-ences in mean alpha power between the three sequenc-es (S1, S2 and S3).
DISCUSSION
he MIQ-R is composed of real execution and men-tal simulation in kinesthetic and visual MI of motor tasks such as bending and extending the knee in stand position and complex movement like jumping with both hands up, that is similar to some part of volleyball spike movement. Considering that MIQ-R have unfamiliar movements for both groups, there is no signiicant diference in MIQ-R scores between them. Nevertheless, the GA scores were slightly higher than those for GNA, which may be due to the high level of motor ability demanded from athletes executing volleyball movements during the real training sessions and matches when compared with inexperienced group. On the other hand, signiicant diferences were found in clearness score of MI modalities of spike volley-ball movement, statistically stronger in KMI, with ath-letes imagining more easily than non-athath-letes. his re-sponse is presumably because volleyball athletes execute this speciic movement exhaustingly, which implies in a solid memory of the motor action.
For both groups, athletes and non-athletes, it is evi-dent the inter-individual variability of the absolute value of ABP power and its frequency between the groups and also within each of them. From this, it is clear that one can not compare the results found for athletes and non-athletes without considering the inter-individual variabil-ity. About the time evolution of the experiment, one can point out that no signiicant diferences have been found
between sequences S2 and S3 neither in any derivation nor in any group. Although there were cases (derivations or groups, in both MI modalities) where no diference in ABP could be inferred throughout the whole experiment, whenever a diference has been achieved it occurred be-tween S1 and S2 or bebe-tween S1 and S3. his inding, al-though does not conirm, at least suggests that some lev-el of habituation takes place along sequence S1, i.e. the beginning of the experiment. It could be interpreted as suggesting a quick phenomenon of habituation, followed by accommodation of ABP response to repetitive MI of stimulus (spike volleyball task). he work of Romero et al.12 also found the efect of habituation, but observing changes of ERP’s amplitude in time domain, diferently of this study that observe cortical changes with technique in frequency domain.
Comparing the results between groups, GA showed more cortical areas with habituation in ABP than GNA, especially during KMI. For GA, the ABP changes oc-curred mainly in sequences S2 and S3 compared to the initial one (S1). Since the alpha band power is usually as-sociated with mental efort, this paradoxal response may suggest that athletes quickly learned how to execute the MI of spike volleyball. It is important to consider that athletes have large experience in real execution of spike volleyball movement, hence already having all the motor planning associated to it. On the other hand, the absence of changes in ABP for non-athletes may suggest that more time should be needed for this group to learn the execu-tion of MI and planning the mental simulaexecu-tion of volley-ball movement. he answer to this question demands fu-ture studies in order to conirm if there are changes in the cortical responses on the group control. Concerning the modality of MI, KMI promoted more physiological alter-ations than VMI, conirming that cortical activation does depend on the modality of MI executed6,8-11.
Finally, it worth to emphasize the diiculty of com-paring our indings with those reported in the literature because we have analyzed the cerebral response to MI using a procedure based on the variation of ABP which could relect the individual physiological pattern chang-es. Moreover, carrying out MI more times may help de-tecting statistical signiicant diference in ABP.
REfERENCES
Gentili R, Papaxanthis C, Pozzo T. Improvement and generalization of arm 1.
motor performance through motor imagery practice. Neuroscience 2006; 137:761-772.
decety J, Ingvar dH. Brain structures participating in mental simulation of 2.
motor behavior: a neuropsychological interpretation. Acta Psychol 1990; 73:13-34.
Ranganathan VK, Sieminow V, Liu, JZ, Saghal V, Yue, GH. From mental pow-3.
er to muscle power: gaining strength by using the mind. Neuropsychologia 2004;42:944-956.
Hall JC. Imagery practice and the development of surgical skills. Am J Surg 4.
2002;184:465-470.
Roure R, Collet C, deschaumes-Molinaro C, delhomme G, dittmar A, Vernet-5.
Maury E. Imagery quality estimated by autonomic response is correlated to sporting performance enhancement. Physiol Behav 1999;66:63-72. Neuper C, Shcherer R, Reiner M, Pfurtscheller G. Imagery of motor actions: 6.
diferential efects of kinesthetic and visual-motor mode of imagery in sin-gle trial EEG. Cogn Brain Res 2005;25:668-677.
Rushworth MFS, Nixon Pd, Renowden S, Wade dT, Passinghan RE. Left pari-7.
etal cortex and motor att ention. Neuropsychologia 1997;35:1261-1273. Solodkin A, Hlustik P, Chen EE, Small SL. Fine modulation in network acti-8.
vation during motor execution and motor imagery. Cereb Cortex 2004;14: 1246-1255.
Sirigu A, duhamel JR. Motor and visual imagery as two complementary and 9.
neurally dissociable mental processes. J Cognitive Neurosci 2001;13:910-919. Cremades JG. The efects of imagery perspective as a function of skill level 10.
on alpha activity. Int J Psychophysiol 2002;43:261-271.
Stecklow MV, Infantosi AFC, Cagy M. Alterações da banda alfa do eletrence-11.
falograma durante imagética motora visual e cinestésica Arq Neuropsiqui-atr 2007;65:1084-1088.
Romero dH, Lacourse MG, Lawrence KE, Schandler S, Cohen MJ. Event-relat-12.
ed potentials as a function of movement parameter variations during motor imagery and isometric action. Behav Brain Res 2000;117:83-96.
Lew GS, Polich J. P300, habituation, and response mode. Physiol Behav 13.
1993;53: 111-117.
Infantosi AFC, Miranda de Sá, AMFL. A statistical test for evaluating the event-14.
related synchronization/desynchronization and its potential use in Brain-Computer-Interfaces. IFMBE Proceedings 2007;18:1122-1126.
Pan JP, Takeshita T, Morimoto K. P300 habituation from auditory single-stim-15.
ulus and oddball paradigms. Int J Psychophysiol 2000;37:149-153. Pfurtscheller G, Brunner C, Schlögl A, Lopes da Silva FH. Mu rhythm (de)syn-16.
chronization and EEG single-trial classiication of diferent motor imagery tasks. NeuroImage 2006;31:153-159.
Pfurtscheller G, Lopes da Silva FH. Event-related EEG/MEG synchronization and 17.
desynchronization: basic principles. Clin Neurophysiol 1999;110:1842-1857. Marks dF, Isaac AR. Topographical distribution of EEG activity accompany-18.
ing visual and motor imagery in vivid and non-vivid imagers. (electroen-cephalographic activity) (Imagery and Motor Processes). Br J Psychol 1995; 86:271-282.
Inoue S, Akiyama Y, Izumi Y, Nishijima S. The development of BCI using alpha 19.
waves for controlling the robot arm. IEICE Trans Commun 2008;91:2125-2132. Smit CM, Wright MJ, Hansell NK, Gefen GM, Martin NG. Genetic variation of 20.
individual alpha frequency (IAF) and alpha power in a large adolescent twin sample. Int J Psychophysiol 2006;61:235-243.
Böttger d, Herrmann CS, Cramon dY. Amplitude diferences of evoked al-21.
pha and gamma oscillations in two diferent age groups. Int J Psychophysiol 2002;45:245-251.
Clark CR, Veltmeyer Md, Hamilton RJ, et al. Spontaneous alpha peak fre-22.
quency predicts working memory performance across the age span. Int J Psychophysiol 2004;53:1-9.
Posthuma d, Neale MC, Boomsma dI, Geus EJC. Are smarter brains running 23.
faster? Heritability of alpha peak frequency, IQ, and their interrelation. Be-hav Genet 2001;31:567-579.
Ravden d, Polich J. On P300 measurement stability: habituation, intra-trial 24.
block variation, and ultradian rhythms. Biol Psychol 1999;51:59-76. Hall CR, Martin KA. Measuring movement imagery abilities: a revision of 25.
movement imagery questionnaire. J Ment Imagery 1997;21:143-154. Jasper HH. The ten twenty electrode system of International Federation. Elec-26.
troencephalography and Clinical Neurophysiology, 1958;10:917-975. Tierra-Criollo CJ, Infantosi AFC. Low-frequency oscillations in human tibial so-27.
matosensory evoked potentials. Arq Neuropsiquiatr 2006;64:402-406. Shiavi R. Introduction to applied statistical signal analysis, 2
28. nd Ed. Nashville,
![Fig 2. Mean alpha power (visual motor imagery condition) in arbi- arbi-trary scale for non-athlete #5 illustrating the three sequences (S1, S2 and S3) in respective left and right occipital [A,B] and parietal [C,d] derivations](https://thumb-eu.123doks.com/thumbv2/123dok_br/15432839.595118/4.955.107.484.631.908/imagery-condition-illustrating-sequences-respective-occipital-parietal-derivations.webp)
