Qualitative analysis of the Clock Drawing Test
by educational level and cognitive profile
Análise qualitativa do Teste do Desenho do Relógio por faixas de escolaridade e perfil
cognitivo
Aline Teixeira Fabricio1, Ivan Aprahamian2,3, Mônica Sanches Yassuda1
ABSTRACT
The use of a qualitative scale for the Clock Drawing Test (CDT) may add information about the pattern of errors committed.Objective:To translate and adapt the Modified Qualitative Error Analysis of Rouleau into Brazilian Portuguese and to examine the pattern of errors according to educational level and cognitive profile.Method:180 adults (47-82 years) completed the CDT. Participants were stratified into age and educational levels and separated between those with and without changes in cognitive screening tests (Mini-Mental State Examination, Verbal Fluency).Results:No significant differences were found in CDT scores among age groups. Among participants without cognitive impairment, those with lower education often presented graphic difficulties, conceptual deficits and spatial deficits. Participants with cognitive deficits, demonstrated more frequently conceptual and spatial errors.Conclusion:The qualitative analysis of the CDT may contribute to the identification of cognitive changes. Education level has to be taken into consideration during the analysis.
Keywords:Clock Drawing Test, cognitive screening, dementia, elderly, education.
RESUMO
O uso de uma escala qualitativa para o Teste do Desenho do Relógio (TDR) pode trazer informações adicionais sobre o perfil dos erros cometidos.Objetivo:Realizar a tradução e a adaptação da Análise Qualitativa de Erros de Rouleau Modificada para o português e analisar o padrão de erros por faixas de escolaridade e perfil cognitivo.Método:180 adultos (47-82 anos) completaram o TDR. Os participantes foram estratificados em faixas etárias, faixas de escolaridade e separados entre aqueles com e sem alterações cognitivas em testes de rastreio (Mini-Exame do Estado Mental, Fluência Verbal).Resultados:Não foram encontradas diferenças no perfil de erros no TDR entre as faixas de idade. Dentre os participantes com cognição preservada, aqueles com menor escolaridade apresentaram com maior frequência dificuldades gráficas, déficits conceituais e déficit espacial. Entre os participantes com alterações cognitivas, foram frequentes as dificuldades conceituais e espaciais.Conclusão:A análise qualitativa do TDR pode contribuir para identificar alterações cognitivas. A escolaridade deve ser levada em consideração durante sua análise.
Palavras-chave:Teste do Desenho do Relógio, rastreio cognitivo, demência, idosos, educação.
The Mini-Mental State Examination (MMSE), the Verbal Fluency test (FV) and the Clock Drawing Test (CDT) are the cognitive screening tests most frequently used in the world1,2,3,4. Studies suggest that a combination of brief
cognit-ive tests can increase the diagnostic accuracy for detecting dementia, in particular Alzheimer’s disease (AD), even among illiterate elderly5. The CDT is a screening test
that is easy and fast to apply6. It evaluates visuospatial
and visuoconstrutive functions, the ability to use symbolic and graphic representations, language, semantic memory
and executive functions7. The score of the CDT can be
obtained through various quantitative scales. The most fre-quently used scoring system was developed by Shulman8.
However, other scales have also been found accurate for early dementia diagnosis9,10,11,12.
In this context, researchers and clinicians who use the CDT are faced with the issue of choosing the best way to analyze the drawings. In Brazil, Lourenço et al.17 and
Aprahamian et al.5found equivalence among the
quantitat-ive methods examined. Yet, quantitatquantitat-ive scales do not allow
1Escola de Artes, Ciências e Humanidades, Universidade de São Paulo, Sao Paulo SP, Brazil;
2Programa Psicogeriatria, Laboratório de Neurociências LIM-27, Departamento e Instituto de Psiquiatria, Faculdade de Medicina, Universidade de São Paulo, Sao Paulo SP, Brazil;
3Faculdade de Medicina de Jundiaí, Jundiai SP, Brazil.
Correspondence:Mônica Sanches Yassuda; Avenida. Arlindo Bettio 1000/322-J Ermelino Matarazzo; 03828-000 São Paulo SP–Brasil; E-mail: yassuda@usp.br
Conflict of interest:There is no conflict of interest to declare.
Received 27 August 2013; Received in final form 28 November 2013; Accepted 17 December 2013.
DOI:10.1590/0004-282X20140004
the description of the error profile of the participant and they do not reveal specific cognitive changes. In Brazil, there are no studies examining the contribution of qualitative scales for the analysis of the CDT.
In 1992, Rouleau et al.19 proposed the Qualitative Error
Analysis of Rouleau. In this initial study, AD patients were compared to patients with Huntington’s disease and normal controls. No differences were observed between diagnostic groups in the quantitative analysis, however, the qualitative analysis suggested that patients with AD showed conceptual errors, perseverations and stimulus-bound responses more often than patients with Huntington’s disease and normal controls. Later studies reported that the Qualitative Error Analysis of Rouleau could help differentiate AD patients from those with vascular dementia (VD)20, frontotemporal
dementia (FTD)21and healthy patients22.
More recently, Parsey and Schmitter-Edgecombe23
demonstrated the accuracy of the CDT to distinguish indivi-duals with mild cognitive impairment (MCI) from AD patients and normal controls. The authors used the original Qualitative Error Analysis of Rouleau scale and a modified version proposed by the authors. In this new version, an error was added, namely Numbers out of order or missing, in the Conceptual deficit category (see in Appendix the modified scale with the error added by the authors). The results indicated that the modified scale was more sensitive for detecting individuals with MCI than the original scale. The authors suggested that the qualitative analysis of CDT errors can help increase the sensitivity for identifying MCI.
Considering the contribution of the CDT for the early identification of cognitive changes and the lack of Brazilian studies on qualitative strategies to analyze the CDT, the aim of the present study was to translate and adapt the Modified Qualitative Error Analysis of Rouleau (with the additional error proposed by Parsey and Schmitter-Edgecombe)23 scale to Brazilian Portuguese. Additionally,
we aimed to examine the CDT error profile of cognitively unimpaired participants with different age and educational levels, in order to verify whether errors in the CDT could be related to age associated changes or to limited edu-cational experience. Finally, we compared the CDT error pro-file of participants with and without cognitive impairment in screening tests (MMSE and/or VF) in order to identify errors in the CDT that could signal early pathological changes.
METHOD
Participants
The study involved the retrospective review of the cognit-ive assessment protocol of 180 independent adults who completed cognitive screening tests one week before they began their participation in a memory workshop offered
consecutively between 2007 and 2010, in the Third Age University program of the Universidade de São Paulo, East
Campus. The sample was divided into three levels of school-ing (1-4 years, 5-8 years, .8 years), three age groups (younger than 60 years, 60-74 years, 75 and over) and sex. Additionally, participants were divided between those who had scores above the education adjusted cut-off scores on the MMSE and animal category FV24,25, (defined as normal
controls–NC), and those with changes in both tests or in
just one of them (defined as participants with cognitive decline–CD). The CDT was not used to classify the groups
according to cognitive performance.
Materials and procedures
The cognitive assessment lasted about 30 minutes and it was performed individually in a silent room. All participants were informed about the research activities developed dur-ing the evaluations and the memory workshop and signed an informed consent form.
To determine cognitive impairment according to the MMSE, education adjusted cut-off scores were as follows: 17 points for illiterates, 22 for 1 to 4 years of schooling, 24 points for 5 to 8 years of schooling and 26 for 9 or more years of schooling. The cut-off score represented the means for each educational level reported in Brucki et al.24 minus
one standard deviation.
VF was applied at its usual format, when the participant is asked to say names of animals in one minute. The cut-off points were as follows: nine animals for illiterate participants, 12 animals for those with 1 to 7 years of schooling and 13 ani-mals for individuals with 8 or more years of education25.
During the application of the CDT, participants were asked to make a circle, put the numbers of the clock inside the circle and indicate 11 hours and 10 minutes with the pointers. The drawings were analyzed quantitatively by the scales of Shulman8 and Sunderland9 and qualitatively with
the Modified Qualitative Error Analysis of Rouleau23.
The Modified Qualitative Error Analysis of Rouleau can be seen in Appendix A. With the additional error, suggested by Parsey & Schmitter-Edgecombe in the modified version23
, it includes 16 possible errors. The maximum possible score is 16 due to the fact that in item 1, errors in clock size–large
or small – are mutually exclusive. In item 4 – Conceptual
Deficits–the new error that refers to numbers out of order
or missing was included. According to the previous authors, this type of error is common among older adults with early cognitive decline. To calculate the score in the modified scale the number of errors in the drawing is subtracted from 16. The higher the score the lower the number of errors made.
functions, the individual’s ability to inhibit response to dis-tracting stimuli, conceptual deficits that may occur due to loss of semantic memory, visuospatial abilities and/or plan-ning deficits and perseveration of responses.
A bilingual researcher (MSY) translated the scale into Brazilian Portuguese. The translated version of the scoring system was discussed and adjusted by a group of students and researchers who investigate cognitive aging (the scale in Brazilian Portuguese is available upon request from the cor-responding author). After these adjustments, 20 CDTs were evaluated according to the qualitative scale by two independ-ent raters, trained to use the scale. Disagreemindepend-ents were found to be less than 10% of the scored errors and they were resolved through discussion. Next, one of the authors (ATF) analyzed the remaining protocols. The CDT protocols were also scored according to Shulman and Sunderland scales.
Statistical analysis
The Kolmogorov-Smirnov test was used to assess if the variables presented normal distribution. The Studentt-test
for independent samples was used to compare NC and CD group means for age and VF, as they presented with normal distribution. The U Mann-Whitney test was used to compare the groups for education, income, MMSE, CDT Shulman, CDT, Sunderland CDT, and Rouleau CDT which did not have normal distribution. For the analyses that involved cat-egorical variables, such as sex, the Chi square test was used. The Kruskal Wallis test was used to compare the three
age groups and educational levels. When differences were identified between age groups and education, the means were compared using the Tukey post hoc test.
To calculate the degree of association between sociode-mographic and cognitive variables, Spearman correlations were calculated. SPSS version 17.0 was used in the analyses. The level of significance was set at 5%, i.e. p,0.05.
RESULTS
The demographic characteristics for the total sample and for the sample divided between NC and CD can be found in Table 1. In addition to impaired cognitive performance in at least one test, CD participants were less educated and had lower income than NC.
Statistical comparisons revealed no significant differences in cognitive performance between the age groups and sex for the total sample. Significant differences were found when the sample was stratified into three levels of schooling, including only participants without cognitive deficits in the MMSE and/or VF (n=141) (Table 2). The results indicated that the least educated groups had comparable performance for the MMSE and VF, and they were different from the group with higher education. For the Shulman CDT, the least educated group was different from the others. For the Sunderland and Rouleau CDT scores, there was a significant difference between the group with the lowest and the highest levels of education.
Table 1.Means and standard deviations for sociodemographic and cognitive variables for the total sample and with sample divided into NC and participants with CD.
Min. Max. Total (n=180) NC (n=141) CD (n=39) p
Female/Male - - 144/36 109/32 35/04 0.086*
Age 47 82 64.98 (6.79) 65.18 (6.69) 64.69 (7.80) 0.700***
Education 01 25 9.04 (4.47) 9.38 (4.50) 7.56 (3.79) 0.028**
Income 01 10 ou + 3.46 (2.20) 3.65 (2.29) 2.62 (1.76) 0.005**
MMSE 18 30 26.87 (2.51) 27.53 (1.97) 24.62 (2.81) ,0.001**
VF 03 28 15.28 (4.07) 16.50 (3.27) 10.90 (3.66) ,0.001***
CDT Shulman 1 5 3.77 (1.21) 3.92 (1.15) 3.21 (1.24) 0.001**
CDT Sunderland 2 10 8.61 (1.72) 8.77 (1.71) 8.05 (1.67) 0.001**
CDT Rouleau 8 16 14.04 (1.53) 14.28 (1.48) 13.21 (1.44) ,0.001**
NC: normal controls; CD: participants with cognitive deficits; MMSE: Mini-Mental Status Exam; VF: verbal fluency; CDT: Clock Drawing Test. Income was assessed in minimum wages.*Chi-square test;**Mann-Whitney;***t-test for independent samples.
Table 2.Cognitive performance according to education groups, including only participants without cognitive deficits (n=141).
1-4 years (n=32) 5-8 years (n=27) .8 years (n=82) p-value*
MMSE 26.28 (2.57) 26.89 (1.89) 28.23 (1.34) ,0.001**
VF 15.41 (3.04) 16.07 (3.59) 17.06 (3.16) 0.022**
CDT Shulman 3.25 (1.46) 4.11 (0.97) 4.12 (0.99) 0.008
CDT Sunderland 7.66 (2.43) 8.93 (1.14) 9.15 (1.32) 0.002
CDT Rouleau 13.40 (1.84) 14.40 (1.33) 14.57 (1.22) 0.004
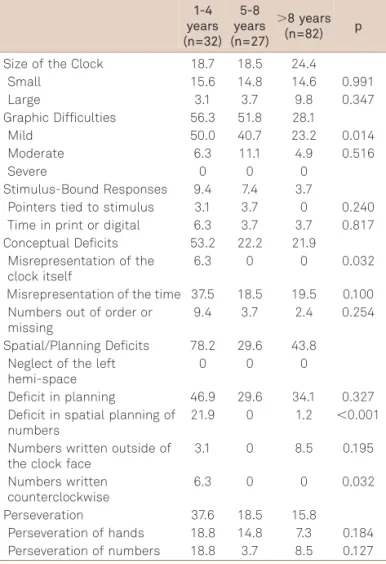
Scores for the Rouleau CDT were analyzed with the NC group divided into three educational groups (Table 3). There were significant differences in mild graphic difficulties, incorrect representation of the clock, deficit in the display of numbers and arrangement of numbers in a counter-clockwise direction. Participants with 1-4 years of schooling made more errors than those with 5 to 8 years who, in turn, made more errors than individuals who studied more than 8 years.
The misrepresentation of the clock and counterclockwise number display occurred exclusively among those in the least educated group. Mild graphic difficulties occurred in all groups. Those with 1 to 4 years of study displayed num-bers incorrectly more often than people with 8 years or more. Participants in the second level of schooling did not commit this error. Neglect of the left hemi-space of the clock was not observed in any level of schooling.
NC and CD groups were compared in the six error categories of the Rouleau CDT scale (Table 4). There was a significant difference for misrepresentation of the time on the clock, numbers out of order or missing and deficits
in planning, with greater frequency of these errors in the CD group.
Table 5 shows the correlations between the CDT scores, assessed by the three scales, with age, education, income, MMSE and VF. Results showed a significant association between the three CDT scores and sociodemographic vari-ables (except for age) and between CDT scores and other screening tests. Results suggested similar relationships for the three CDT scoring systems.
Table 3.Frequency of errors in the Modified Qualitative Error Analysis of Rouleau for NC subdivided into education groups (n=141). 1-4 years (n=32) 5-8 years (n=27)
.8 years (n=82) p
Size of the Clock 18.7 18.5 24.4
Small 15.6 14.8 14.6 0.991
Large 3.1 3.7 9.8 0.347
Graphic Difficulties 56.3 51.8 28.1
Mild 50.0 40.7 23.2 0.014
Moderate 6.3 11.1 4.9 0.516
Severe 0 0 0
Stimulus-Bound Responses 9.4 7.4 3.7
Pointers tied to stimulus 3.1 3.7 0 0.240 Time in print or digital 6.3 3.7 3.7 0.817 Conceptual Deficits 53.2 22.2 21.9
Misrepresentation of the clock itself
6.3 0 0 0.032
Misrepresentation of the time 37.5 18.5 19.5 0.100 Numbers out of order or
missing
9.4 3.7 2.4 0.254
Spatial/Planning Deficits 78.2 29.6 43.8 Neglect of the left
hemi-space
0 0 0
Deficit in planning 46.9 29.6 34.1 0.327 Deficit in spatial planning of
numbers
21.9 0 1.2 ,0.001
Numbers written outside of the clock face
3.1 0 8.5 0.195
Numbers written counterclockwise
6.3 0 0 0.032
Perseveration 37.6 18.5 15.8
Perseveration of hands 18.8 14.8 7.3 0.184 Perseveration of numbers 18.8 3.7 8.5 0.127 p-value refers to the Chi-square test.
Table 4.Frequency of errors in the Modified Qualitative Error Analysis of Rouleau for NC and CD groups (n=180).
NC % (n=141)
CD % (n=39) p
Size of the Clock 22 33.3
Small 14.9 28.2 0.054
Large 7.1 5.1 0.663
Graphic Difficulties 39 56.4
Mild 32.6 41.0 0.328
Moderate 6.4 15.4 0.72
Severe 0 0 0
Stimulus-Bound Responses 5.7 10.3 Pointers tied to stimulus 1.4 2.6 0.62 Time in print or digital 4.3 7.7 0.38
Conceptual Deficits 29.1 71.7
Misrepresentation of the clock itself
1.4 5.1 0.164
Misrepresentation of the time 23.4 48.7 0.002 Numbers out of order or missing 4.3 17.9 0.003 Spatial/Planning Deficits 49 64.1
Neglect of the left hemi-space 0 0 0
Deficit in planning 36.2 53.8 0.046
Deficit in spatial planning of number
5.7 5.1 0.895
Numbers written outside of the clock face
5.7 2.6 0.430
Numbers written counterclockwise
1.4 2.6 0.621
Perseveration 21.2 28.2
Perseveration of hands 9.9 10.3 0.848
Perseveration of numbers 11.3 17.9 0.167 NC: normal controls; CD: elderly with deficit in cognitive screening tests; p-value refers to the Chi-square test.
Table 5.Spearman Correlation between CDT rating scales and sociodemographic and cognitive variables (n=180).
CDT Shulman CDT Sunderland CDT Rouleau
Age Rho -0.52 0.054 0.109
p 0.46 0.443 0.124
Education Rho 0.269 0.280 0.276
p ,0.001 ,0.001 ,0.001
Income Rho 0.297 0.303 0.266
p ,0.001 ,0.001 ,0.001
MMSE Rho 0.353 0.349 0.375
p ,0.001 ,0.001 ,0.001
VF Rho 0.194 0.194 0.242
p 0.009 0.009 0.001
DISCUSSION
In this study, we aimed to describe the performance pro-file and pattern of errors in the CDT analyzed with a qual-itative scoring system among independent participants. Participants were divided into three age and education groups and between those with and without impairment in cognitive screening tests (MMSE and VF). Additionally, qualitative CDT scores were compared to scores on two quantitative scales.
There were no significant differences in cognitive scores between the different age groups. Previous Brazilian stud-ies26,27,28indicated that older participants tend to have worse
performance on cognitive tasks. For instance, Kochhann et al.29studied 963 women aged between 20 and 92 years,
in order to assess the independent effect and interactions between age, gender and education on the MMSE and noted that education and age influenced the MMSE scores. It is possible that in the present study no significant age differ-ences were found due to the limited variability in the distri-bution of age. The sample contained a small number of people over 75 years.
Participants with lower education exhibited performance below education-adjusted cut-off points in the MMSE and VF more frequently. It is possible that the cut-off scores pro-posed thus far in Brazil are not suitable for all regions of Sao Paulo, which is a huge metropolitan area with heterogen-eous sociocultural and economical characteristics. The study was carried out in the Eastern region of Sao Paulo where income and education levels are lower. Alternatively, it is plausible that there is a higher proportion of people with cognitive impairment among the less educated, as suggested by previous epidemiological studies30,31.
Significant differences were found for the quantitative and qualitative CDT scores between schooling levels. CDT evaluates complex mental functions, such as the sym-bolic and graphic representation of a clock, auditory lan-guage, semantic memory and executive functions7. It is
expected that these skills are modulated by educational experience, as suggested by Aprahamian et al.18
and Lourenço et al.17. Correlation analyses also suggested a
sig-nificant relationship between education and income on CDT performance, however, the reported correlations were of modest magnitude.
The qualitative analysis of the CDT enabled a more detailed description of the errors, which is not feasible in the quantitative scoring systems. The most commonly observed CDT errors among participants without cognitive impairment with lower education were: errors in number display, numbers in counterclockwise direction (spatial/ planning deficit) and incorrect representation of the clock (conceptual deficit). Participants with less education seemed to have more difficulties with respect to the meaning, inter-pretation and knowledge of the clock itself. Mild graphic dif-ficulties were also more frequent in this group.
The CDT errors identified in the subgroup of participants with cognitive impairment in the MMSE and/or VF were similar to those found in the group with MCI in the study by Parsey and Schmitter-Edgecombe23. Conceptual deficits
(misrepresentation of time and numbers out of order or missing) and spatial/planning deficits were the most fre-quently observed errors in the CD group. In the study by Parsey and Schmitter-Edgecombe23, the typical error profile
for the elderly with MCI was moderate graphic difficulties and conceptual deficits (misrepresentation of time and num-bers out of order or missing). Therefore, the present study and the one cited above are in agreement that errors in the representation of time and numbers out of order or missing may be a sign of early cognitive decline.
Conceptual deficits, such as numbers out of order or missing, seem to be particularly informative to identify MCI23, and these errors may not be evident in quantitative
CDT scales. In addition, knowledge of the typical errors of individuals with limited schooling, such as spatial/planning deficits, reported in the present study, may help clinicians to differentiate them from disease associated errors.
Despite the fact that the CDT has been frequently used as a screening tool for the identification of dementia, it has been less used to identify individuals with MCI. Qualitative CDT analysis may possibly contribute to the identification of these cases, as it enables the description of specific errors. An important limitation of the present study is that cognitive impairment was based on screening tests. Another limitation is the fact that the study protocol did not include a complete clinical characterization of parti-cipants. Future studies should explore the contribution of the qualitative analysis of CDT in samples with various dis-eases associated with cognitive changes.
References
1. Shulman K I, Herrmann N, Brodaty H, et al. IPA survey of brief cognitive screening instruments. Int Psychogeriatr 2006;18:281-294.
2. Chodosh J, Petitti DB, Elliott M, et al. Physician recognition of cognitive impairment: evalutating the need for improvement. J Am Geriatr Soc 2004;52:1051-1059.
3. Jacinto AF, Brucki S, Porto CS, Martins MA, et al. Detection of cognitive impairment in the elderly by general internists in Brazil. Clinics 2011;66:1379-1384.
5. Aprahamian I, Martinelli JE, Cecato J, et al. Screening for Alzheimer’s disease among illiterate elderly: accuracy analysis for multiple instruments. J Alzheimers Dis 2011;26:221-229.
6. Hubbard EJ, Santini V, Blankevoort CG, et al. Clock drawing performance in cognitively normal elderly. Arch Clin Neuropsychol 2008;23:295-327.
7. Hamdan, AC, Hamdan EMLR.Teste do desenho do relógio: desem-penho de idosos com doença de Alzheimer, Passo Fundo. RBCEH 2009;6:98-105.
8. Shulman KI, Gold DP, Cohen CA, Zucchero CA. Clock-drawing and dementia in the community: a longitudinal study. Int J Geriatr Psychiatry 1993;8:487-496.
9. Sunderland T, Hill JL, Mellow AM, et al. Clock drawing in Alzheimer’s disease: a novel measure of dementia severity. J Am Geriatr Soc 1989;37:725-729.
10. Mendez MF, AlaT, Underwood K. Development of scoring citeria for the clock drawing task in Alzheimer’s disease. J Am Geriatr Soc 1992;40:1095-1059.
11. Tuokko H, Hadjistavropoulos T, Miller JA, et al. The clock test: a sensitive measure to differentiate normal elderly from those with Alzheimer disease. J Am Geriatr Soc 1992;40:570-584.
12. Watson Y I, Arfken CL, Birge SJ. Clock completion: an objective screening test for dementia. J Am Geriatr Soc 1993;41:1235-1240.
13. Atalaia-Silva KC, Lourenço RA. Tradução, adaptação e validação de construto do Teste do Relógio aplicado entre idosos no Brasil. Rev Saude Publica 2008;42:930-937.
14. Fuzikawa C, Lima-Costa MF, Uchôa E, et al. Bambuí Health and Ageing Study. A population based study on the intra and inter-rater reliability of the clock drawing test in Brazil: the Bambuí Health and Ageing Study. Int J Geriatr Psychiatry 2003;18:450-456.
15. Fuzikawa C, Lima-Costa MF, Uchôa E, et al. Correlation and agreement between the Mini-mental State Examination and the Clock. Int Psychogeriatr 2007;19:657-667.
16. Okamoto I H. Aspectos cognitivos da doença de Alzheimer no teste do relógio: avaliação de amostra da população Brasileira. Tese de Doutorado em Medicina. Universidade Federal de São Paulo; 2001.
17. Lourenço RA, Ribeiro-Filho ST, Moreira IFH, et al. The clock drawingtest: performance among elderly with low educational level. Rev Bras Psiquiatr 2008;30:309-315.
18. Aprahamian I. O teste do desenho do relógio no rastreio diagnostico da demência de Alzheimer em idosos no Brasil. Tese de mestrado, Campinas; 2009.
19. Rouleau I, Salmon DP, Butters N, et al. Quantitative and qualitative analysis of clock drawings in Alzheimer’s and Huntington’s disease. Brain Cogn 1992;18:70-87.
20. Kitabayashi Y, Ueda H, Narumoto J. Qualitative analyses of clock drawings in Alzheimer’s disease and vascular dementia. Psychiatry Clin Neurosci 2001;55:485-491.
21. Blair M, Kertesz A, McMonagle P, et al. Quantitative and qualitative analyses of clock drawing in frontotemporal dementia and Alzheimer’s disease. J Inter Neuropsychol Soc 2006;12:159-165.
22. Chiu YC, Li CL, Lin KN, et al. Sensitivity and specificity of the clock drawing test, incorporating Rouleau scoring system as a screening instrument for questionable and mild dementia: scale development. Inter J Nursing Studies 2008;45:75-84.
23. Parsey MC, Schmitter-Edgecombe M. Quantitative and qualitative analyses of the Clock Drawing Test in mild cognitive impairment and Alzheimer disease: evaluation of a modified scoring system. J Geriatr Psychiatry Neurol 2011;24:108-118.
24. Brucki SM, Nitrini R, Caramelli P, et al. Suggestions for utilization of the mini-mental state examination in Brazil. Arq Neuropsiquiatr 2003;61:777-781.
25. Caramelli P, Carthery MTG, Porto CS, et al. Category fluency as a screening test for Alzheimer disease in illiterate and literate patients. Alzheimer Dis Assoc Disord 2007;21:65-67.
26. Argimon IIL, Stein LM. Habilidades cognitivas em indivíduos muito idosos: um estudo longitudinal. Caderno de Saúde Pública 2005;21:64-72.
27. Brucki SMD, Rocha MSG. Category fluency test: effects of age, gender and education on total scores, clustering and switching in Brazilian Portuguese speaking subjects. Braz J Med Biol Res 2004;37:1771-1777.
28. Erven TJCG, Janczura GA. A memória dos idosos em tarefas complexas. Psicologia: Teoria e Pesquisa 2004;20:59-68.
29. Kochhann R, Cerveira MO, Godinho C, et al. Evaluation of Mini-Mental State Examination scores according to different age and education strata, and sex, in a large Brazilian healthy sample. Dem Neuropsychol 2009;3:88-93.
30. Herrera E Jr, Caramelli P, Nitrini R. Estudo epidemiológico popula-cional de demência na cidade de Catanduva, estado de São Paulo. Rev Psiq Clin 1998;25:70-73.
APPENDIX – MODIFIED QUALITATIVE ERROR ANALYSIS OF ROULEAU
16 POINTS POSSIBLE, *INDICATES ADDED ERROR
SIZE OF THE CLOCK
(1) Small (less than 1.5 inches in diameter)OR
(1) Large (more than 5 inches in diameter)
GRAPHIC DIFFICULTIES
Lines imprecise resulting in distortions of the clock face or resulting in numbers that are difficult to read.
Hands not straight or fail to connect in the middle Overall performance appears inaccurate or clumsy (1) Mild: some distortions of the clock face and/or the hands and/or the numbers. Overall performance was adequate. (2) Moderate: distortions evident, but the overall perform-ance remained interpretable.
(3) Severe: distortions evident and severe, possibly result-ing in a non-interpretable drawresult-ing.
STIMULUS-BOUND RESPONSES (NOTE: PREVIOUS STUDIES REQUIRED DIFFERENT TIMES TO BE DISPLAYED IN THE CLOCK)
The tendency for the drawing to be dominated or guided by a single stimulus
(1) Time is written (in letters/numbers) beside the 1or between the 4 and the 5
(1) Hands are pointed toward 4 or 5, or hands are absent
CONCEPTUAL DEFICITS
Errors reflect a loss/deficit in accessing the knowledge of the attributes, features, and meaning of a clock
(1) Misrepresentation of the clock itself (clock without numbers, no outer circle)
(1) Misrepresentation of the time (hands absent or inade-quately represented, incorrect length of hands or hands the same length, time written on the clock)
*(1) Numbers out of order or missing (starting sequence with 1 in the “12” position, number sequence finishes early or does not reach 12, numbers missing in the sequence)
SPATIAL AND/OR PLANNING DEFICITS
Deficits in the layout of the numbers on the clock face (1) Neglect of the left hemi-space
(1) Deficit in planning, with gap before 12, 3, 6, or 9 (1) Deficit in spatial planning of numbers, without any specific pattern in spatial disorganization
(1) Numbers written outside of the clock face, or num-bers written on the outer circle
(1) Numbers written counterclockwise
PERSEVERATION
The continuation or recurrence of activity without an appropriate stimulus
(1) Perseveration of hands: presence of more than 2 hands (1) Perseveration of numbers: abnormal prolongation of numbers, (e.g.,writing numbers beyond 12, or repeating the same numbers)
Total Number of Errors =_______ Total Score (16–
num-ber of errors) =_______