doi: 10.1590/S1984-46702010000600012
Land-use change is one of the most important threats to biodiversity (FORMAN 1999, SALAet al. 2000, TURNERet al. 2001,
FOLEYet al. 2005, MILLENNIUM ECOSYSTEM ASSESSMENT 2005, REIDSMA
et al. 2006). Since 1850, six million km2 of forest/woodlands and 4.7 million km2 of grassland/savannas have been converted due to global expansion of croplands (LAMBINet al. 2001). Since 1960,
the increasing world population and demand for food and other products have accelerated the conversion of natural habitats into agricultural lands, plantations and urban areas (FOLEYet al. 2005, LAMBINet al. 2001). Developing regions that have been recently
incorporated into the expanding world economy have had the highest rate of land conversion (LAMBINet al. 2001). In these
re-gions, both forests and grasslands are threatened by selective logging and clearing for agriculture expansion, but the latter are the most threatened ecosystem, because they are the most suit-able for agriculture, exotic tree plantations, and cattle ranching (CARDOSODA SILVA & BATES 2002, SALAet al. 2001).
Ecological effects of land-use change on species presence, abundance, and distribution may be determined by species-specific characteristics (e.g. body size, mobility, food and habi-tat requirements) that influence their survival in a transformed habitat, and determine their scale of response to habitat trans-formation (KEITT et al. 1997). For example, the transformed
habitat can be hostile (e.g. high predation) and of low quality (e.g. limited resources) for specialists and small species, which may have their dispersal further limited because natural patches may become isolated from one another, increasing the prob-ability of local extinctions (DAILYet al. 2003, VANDERMEER &
CARVAJAL 2001). By contrast, generalist and large species can
use these transformed habitats for food and shelter, or traverse them looking for natural habitat areas, allowing these species to maintain viable populations in a transformed landscape (DAILYet al. 2003, VANDERMEER & CARVAJAL 2001). As a
conse-quence, the effects of land-use change on species will be
differ-Effects of habitat and landscape characteristics on medium and large
mammal species richness and composition in northern Uruguay
María José Andrade-Núñez
1, 2& T. Mitchell Aide
11 Department of Biology, University of Puerto Rico. POBOX 23360, San Juan. Puerto Rico 00931. 2 Corresponding author. E-mail: [email protected]
ABSTRACT. The increasing world population and demand for food and other products has accelerated the conversion of natural habitats into agricultural lands, plantations and urban areas. Changes in habitat and landscape characteristics due to land-use change can have a significant effect on species presence, abundance, and distribution. Multi-scale approaches have been used to determine the proper spatial scales at which species and communities are responding to habitat transformation. In this context, we evaluated medium and large mammal species richness and composition in gallery forest (n = 10), grassland (n = 10), and exotic tree plantation (n = 10) in a region where grasslands have been converted into exotic tree plantations. We quantified mammal species richness and composition with camera traps and track surveys. The composition of the mammal community was related with local habitat variables, and landscape variables measured at seven spatial scales. We found 14 mammal species in forest, 11 species in plantation, and 7 mammal species in grassland. Two species are exotics, the wild boar Sus scrofa Linnaeus, 1758 and the European hare
Lepus europaeus Pallas, 1778. The most common species are the crab-eating fox Cerdocyon thous Linnaeus, 1766, the nine-banded armadillo Dasypus novemcinctus Linnaeus, 1758and the gray brocket deer Mazama gouazoubira G. Fischer, 1814 which are generalist species. Our results showed significant differences in mammal species richness and composi-tion among the three habitat types. Plantacomposi-tions can have positive and negative effects on the presence of species restricted to grasslands. Positive effects are reflected in a wider local distribution of some forest species that rarely use grassland. The most important habitat and landscape variables that influenced mammal species richness and composi-tion were vertical structure index, canopy cover, tree species diversity, percentage of grass, and the percentage of forest and grassland at the landscape scale of 0.1 km. We advise the following important measures for conservation of this mammal community: 1) reduce logging and cattle grazing in gallery forest, and 2) increase grassland buffer zones between plantation and forest.
ent for different species, even closely related species (HOLLAND
et al. 2004, MIKUSINKI & ANGELSTAM 2004). Additionally, the type
and intensity of land-use (e.g. selective logging vs. clear cut-ting) will directly affect habitat quality (REIDSMAet al. 2006) as
well as the spatial configuration of natural habitats in the land-scape (DAILYet al. 2003, DAUBERet al. 2003, ANDRÉN 1994). For
this reason, the spatial scale at which observations are made is crucial for understanding the effect of land-use change on popu-lation dynamics and community patterns (HABEEBet al. 2005). In addition, the scale at which species interact with the land-scape varies widely (KEITTet al. 1997) and is correlated with
body size and mobility of the organism (OLFF & RITCHIE 2002). Multi-scale approaches have been used with a variety of taxa at the community and species levels, trying to understand the proper spatial scales at which populations and communi-ties respond to habitat modification (ATAURI & LUCIO 2001, ATTUM
et al. 2008, GORRESENet al. 2005, GOTMARKet al. 2008, HABEEBet
al. 2007, KARLSON & CORNELL 1998, LINDENMAYERet al. 1999, RHODES
et al. 2009, ZABALAet al. 2005). At the community level, the
abundance of the phyllostomid bat in the Atlantic rain forest in Paraguay was associated with landscape characteristics such as patch density, patch size and patch proximity at scales of 5 km radius, which probably includes all or most of the home range of the species (GORRESENet al. 2005). In this regard, this type of analysis can be a useful tool for management and con-servation activities (GORRESENet al. 2005, ZABALAet al. 2005).
Using multi-scale analysis, we examined how habitat and landscape variables can affect medium and large mammal com-munities in a grassland region in northern Uruguay. There, most of the mammal diversity occurs in riparian (gallery) forests, and afforestation with exotic species has been the major land-use change in the last 20 years. Specifically, we 1) determined mammal species richness, and composition, among gallery forests, grasslands and plantations, and 2) correlated them with habitat and landscapes characteristics. The results of this study are useful for determining management and conservation ac-tivities to protect the mammal community. In northern Uru-guay the creation of protected areas is limited because the land is privately owned and used for forestry, agriculture and cattle ranching. In such a setting, it is essential to find a balance be-tween conservation and economic development.
MATERIAL AND METHODS
We conducted the study from January to December, 2008, in the northeastern Uruguay. There, natural habitats have been transformed for cattle grazing, agriculture and afforestation with exotic trees. Grassland occupies approximately 80% of the country, being the main ecosystem where these activities have been developed and hence the most impacted (CRACCOet al. 2005). This transformation is due to the high fertility of grassland soils, easy accessibility and relatively flat topogra-phy. The area of exotic tree plantations have increased rapidly
following the implementation of the Forestry Law (# 15,939), which provided incentives and subsidies to investors that de-veloped plantations on low fertility soils (GEARY 2001). In 1987, 31,000 ha were planted primarily with Eucalyptus and Pinus spp. and by 2005 there were 766,000 ha of plantations (http:/ /faostat.fao.org, MGAP 2005). Exotic tree plantations are be-coming economically important in Uruguay and it is expected that by 2020, 900,000 ha will be covered by exotic tree planta-tions, corresponding to 5% of the country (TORRES & FOSSATI
2004). Plantations occur throughout the country, but 18.7% of all plantations occur in the department of Rivera, northern Uruguay.
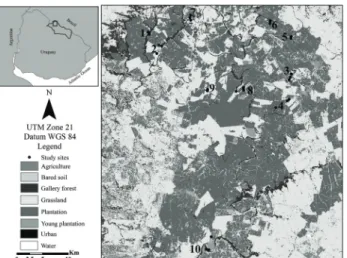
The study area comprises a region of approximately 67,000 ha in the northwestern part of the department of Rivera (Fig. 1). The climate is humid subtropical, with mean tempera-tures of 18.1°C and mean annual rainfall of 1653 mm (COFUSA 2006). The main land-uses in the area are grassland mainly used for cattle ranching, gallery (or riparian) forest, small wet-lands, watermelon and tobacco crops, exotic tree plantations and urban areas. In Rivera, 11,000 ha were planted mainly with Pinus spp. and Eucalyptus spp. in 1987, and by 2005 there were 124,382 ha of plantations (MGAP 2005).
Study sites were located in ten properties of a forestry company (Fig. 1). The properties occur in northern Rivera and the mean distance to the neighboring property was 6.68 km. In each property, we selected a gallery forest site, a grassland site, and a plantation site, separated from one another by an average of 1 km, for a total of 30 sites. Within each site we sampled an area of approximately 2.5 ha. Sites were selected based on accessibility, and that there were no active manage-ment activities (e.g. logging) occurring near the sites during the time of the study.
Gallery forest sites are characterized by a predominance of small trees (e.g. Sebastiania commersioniana (Baill.) L. B. Sm & Downs, Sebastiania brasiliensis Spreng., Eugenia uniflora L., Lithraea molleoides (Vell.) Engl, Scutia buxifolia Reissek and Allophyllus edulis (A. St.-Hil.) Radlk.) and shrub species (e.g. Daphnosis racemosa Griseb, 1879). The canopy is closed with an understory density that varies from dense to sparse depend-ing on the presence of cattle which feed on seedldepend-ings and cre-ate small trails inside the forest, preventing seedlings from grow-ing. All plantations were monocultures of Eucalyptus spp. and are actively managed. Plantation sites varied in age from 2 to 18 years old. Young plantation sites are characterized by small Eucalyptus trees (e.g. 4-6 m tall), an open canopy, and an un-derstory with bare ground or a low grass cover. Older planta-tions are characterized by large Eucalyptus trees (e.g. 16-25 m tall), a close canopy, and an open understory dominated by branches and bark. In some sites, there were a few small native shrubs or trees, or Eucalyptus. Grassland sites were character-ized by a predominance of grasses and herbaceous vegetation and a lack of trees and shrubs species.
We quantified mammal species richness and composi-tion in the 30 sites in three surveys. The first survey was car-ried out from January to April, 2008, the second survey from June to August, 2008, and the third survey from September to December, 2008. Each site was surveyed for approximately 24 days. In each survey, we conducted direct and indirect meth-ods to detect mammals. The direct method consisted of four digital camera traps (Cuddeback Excite Digital Camera, 2 Megapixels) for eight consecutive days in each site for a total of 96 camera/days per site (3 censuses x 4 cameras x 8 days). Camera traps were separated on average by 60 m and were tied to a tree or placed on an iron bar at 50 cm above the ground. We placed camera traps in sites where the probability of mam-mal detection was high (e.g. near rivers, ponds, trails, dens) and we changed the position of the camera traps in each sur-vey. We used apples, bananas, sardines and vanilla as baits. In addition to camera traps, we conducted walking censuses for tracks, scats, dens and direct observations of animals. In each site, we conducted two walking censuses for 30 minutes each during each of the three surveys for a total of 3 hours.
Habitat measurements were collected from January to April 2008. In each site, a 5 x 50 m transect was established and the diameter at breast height (DBH) was measured for trees >10 cm DBH. Trees and shrubs between 1-10 cm DBH were sampled in a 1 x 50 m transect. These data were used to calcu-late stand basal area (m2/ha) and tree density (number of trees/ ha). We identified each tree and shrub to species or morphospecies. Tree diversity was calculated using Shannon-Wiener index. For each tree, the height of the first branch was recorded. Ground cover was measured every 5 m along the 50 m transect, within a 1 x1 m plot, by estimating the percent of the plot occupied by trees, shrubs, grass, leaf litter, bark, fallen branches and bared soil. Leaf litter depth was measured three
times within each plot. Vegetation structure was estimated by determining the presence or absence of vegetation within dif-ferent height ranges (m) (e.g. 0-2, 2-4… > 30 m). With these data we calculated habitat vertical structure heterogeneity us-ing a Shannon-Wiener diversity index (from now vertical struc-ture index). Higher values of the index represent a complex structural habitat. Percent canopy cover was measured using an ocular tube every 5 m. Additionally, temperature and rela-tive humidity were measured during each survey using sensors (Hobo Pro v2 Part # U23-001) located at 50 cm above ground. The width of water courses associated with gallery forests was measured. To estimate the potential impact of cattle, horses and sheep on the mammal community we calculated an index by dividing the number of photos of these animals by the num-ber of days of observations.
Using a land-use map of the study region we calculated the area of each land-use classes within seven buffer areas around each site with the following radiuses: 0.1, 0.5, 1, 1.5, 2, 3 and 4 km, using ArcGis 9.2. We selected buffer radiuses in relation to the home range sizes of the species registered dur-ing the survey (IUCN 2008). This procedure allowed us to de-termine the extent of the landscape analysis appropriate for this community of mammals. For the landscape variables, we used the percent area of each land-use class because the total area of different habitats tends to be more important than habi-tat fragmenhabi-tation for the viability of wildlife populations (FAHRIG
2003).
We calculated mammal species richness using incidence data from track and camera surveys for each habitat type (plan-tation, gallery forest and grassland) using sample-based rarefac-tion curves (species accumulararefac-tion curves). We performed spe-cies accumulation curves using Mao Tau estimator with confi-dence intervals set at 95% (GOTELLI & COLWELL 2001). We gener-ated Mao Tau analytical estimator as well as other parametric and non-parametric estimators by performing 100 randomiza-tions without replacement using EstimateS 7.5.1 (COLWELL 2005).
We generated different species richness estimators to determine if the sampling effort was enough to achieve a confident result of species richness.
We used a Multi-Response Permutation Procedure (MRPP), based on Sorensen (Bray-Curtis) distance, with inci-dence (i.e. presence/absence) mammal data to test for signifi-cant difference in assemblage composition between forest, plan-tation and grassland habitats. We applied a Bonferroni correc-tion to the pair-wise p-values (i.e., individual p < 0.05/number of comparisons were considered significant) to maintain the overall alpha level of 0.05 and avoid type I error (HOLM 1979).
was different and to determine which habitat and landscape variables were correlated with mammal species richness and composition in each site. For the NMS, the second matrix was relativized by each column (i.e. each environmental variable) maximum. We used Sorensen (Bray-Curtis) distance measure. We performed a first run with six axes stepping down in di-mensionality, 50 runs with real data, stability criterion = 0.0005 and the iterations to evaluate stability in 200 (Monte Carlo tests), we set the initial step length to 0.20 and selected ran-dom numbers for the starting coordinates. This first run was performed to determine the number of dimensions of the or-dination and the starting configuration for the final run. For the final run the percent of correlation with distance matrix (r2) was calculated to evaluate the efficiency of the ordination distance to represent the distances in the real data and to de-termine the two axes that explained most of the ordination space which were the ones used to graphic representation. MRPP and NMS analysis were performed using PcOrd 5.0 (MCCUNE & MEFFORD 1999). Kruskall-Wallis test was performed using R 2.9
(R DEVELOPMENT CORE TEAM 2009).
RESULTS
Mammal species survey and sampling effort
Fifteen species of medium and large mammals were re-corded with approximately 960 camera/days (240 days x 4 cam-era traps) and 30 hours of walking census per habitat type. We found 14 mammal species in forest sites, 11 species in
planta-tion sites, and 7 mammal species in grassland sites. Two of these species are exotics, the wild boar Sus scrofa Linnaeus, 1758 and the European hare Lepus europaeus Pallas, 1778 and are considered invasive in Uruguay (Tab. I). The most abundant species were the crab-eating fox Cerdocyon thous Linnaeus, 1766, the nine-banded armadillo Dasypus novemcinctus Linnaeus, 1758 and the gray brocket deer Mazama gouazoubira G. Fischer, 1814 which were recorded in almost every site and in the three habi-tat types (Tab. I). Rare species included the margay Leopardus wiedii Schinz, 1821 recorded in a single photograph at a forest site and the lesser grison Galictus cuja Molina, 1782 which was recorded in two forest sites by tracks (Tab. I). The number of species observed in the three habitats was similar to the ex-pected values predicted by most of the species richness estima-tors (Tab. II). At a regional scale the sampling effort was enough to confidently estimate species richness. The rarefaction curve analysis suggests that 150 sample days are needed to deter-mine mammal species richness in grassland and 240 days in forest and plantation.
Mammal species richness, and composition in
forests, plantations, and grasslands
Forest, plantation, and grassland differed in mammal species richness (KW = 15.08, df = 2, p < 0.001) (Fig. 2). Forest was the most diverse habitat (mean = 7) followed by planta-tion (mean = 4) and grassland (mean = 3). There was no signifi-cant difference in species richness between plantation and grass-land.
Table I. Number of filtered photos, tracks, scats and direct observations (Obs.) of medium and large mammal species, and the number of sites where a species was recorded. Filtered photos = number of photos determined by assuming that multiple photographs of a species (or a pair or group in the case of foxes and wild boars, respectively) taken by a single camera during any 24-hours period represented a single individual (SANDERSON 2004). * Exotic species.
Family Species Forest (n = 10) Plantation (n = 10) Grassland (n = 10) Total records
Photos Obs. Sites Photos Obs. Sites Photos Obs. Sites
Canidae Cerdocyon thous 86 16 10 42 6 10 21 2 7 173
Dasypodidae Dasypus novemcinctus 53 28 10 11 7 6 4 5 5 108
Cervidae Mazama gouazoubira 24 38 10 15 15 10 3 11 5 106
Canidae Pseudalopex gymnocercus 15 2 2 11 4 2 5 0 2 37
Mustelidae Conepatus chinga 6 6 8 9 2 5 6 1 6 30
Leporidae Lepus europaeus * 0 0 0 7 8 5 1 3 4 19
Felidae Oncifelis geoffroyi 15 1 7 2 0 1 0 0 0 18
Procyonidae Procyon cancrivorous 6 8 8 0 1 1 0 0 0 15
Hydrochaeridae Hydrochoerus hydrochaeris 2 11 4 0 0 0 0 0 0 13
Suidae Sus scrofa * 2 2 3 1 0 1 1 4 2 11
Dasypodidae Euphractus sexcinctus 2 0 1 3 2 1 0 0 0 7
Mustelidae Lontra longicaudis 1 5 4 0 0 0 0 0 0 6
Didelphidae Didelphis albiventris 2 1 2 2 0 1 0 0 0 5
Mustelidae Galictis cuja 0 2 2 0 0 0 0 0 0 2
The NMS ordination using incidence data extracted two axes that explain 72% of the total variance (Fig. 3). The pres-ence of five mammal species had the highest correlation values with the ordination, and had the strongest influence in deter-mining the ordination. The geoffroy’s cat Oncifelis geoffroyi d’Orbign & Gervais, 1844 (r = 0.681), the crab-eating raccoon Procyon cancrivorus Cuvier, 1798 (r = 0.629), and M. gouazoubira (r = 0.624), were positively correlated with axes 1. D. novemcinctus (r = -0.757) and the hog nosed skunk Conepatus chinga Molina, 1782 (r = -0.657) were negatively correlated with axes 2. One forest site is separated from the rest of the forest because it had two species (the white-eared opossum Didelphis albiventris Lund, 1840 and the yellow armadillo Euphractus sexcinctus Linnaeus, 1756) that were not found in the other forest sites. Two grass-land sites that shared one species, M. gouazoubira, were sepa-rated from the remaining because they had only two species. Mammal species composition, using incidence data between forest and grassland and between forest and plantation sites was significantly different using Bonferroni correction (p < 0.0166)
(MRPP, A = 0.13, p < 0.001; A = 0.153 p < 0.001 respectively). Several species (the capybara Hydrochoerus hydrochaeris Linnaeus, 1766; the Neotropical river otter Lontra longicaudis Olfers, 1818; G. cuja and L. wiedii) where found only in forest sites. By con-trast, L. europaeus was the only species that was not recorded in forest sites and was recorded in plantation and grassland sites. Although there were four more species (O. geoffroyi, E. sexcinctus, P. cancrivorus, and D. albiventris), in plantation than in grass-land, there was no significant difference in species composition between these two habitats (MRPP, A = -0.0006, p = 0.43).
Many habitat and landscape variables were strongly cor-related with axis 1 (Fig. 3). Vertical structure index (r = 0.581), percentage of trees (r = 0.626), percentage of leaves (r = 0.661), canopy cover (r = 0.723), stand basal area (r = 0.716), tree spe-cies diversity (r = 0.666), width of water course (r = 0.574) and percentage of forest at 0.1 km (r = 0.669) separated forest sites from plantation and grassland sites. By contrast, percentage of grass (r = -0.589), maximum temperature (r = -0.587) and per-centage of grassland at 0.1 km (r = -0.551) separated grassland from plantation and forest.
Figure 2. Differences in mammal species richness among forest, grassland and plantation sites.
Figure 3. Nonmetric Multidimensional Scaling (NMS) ordination based on mammal species composition. Vectors represent the di-rection and strength of the most important environmental vari-ables. Environmental variables: (%Grass) percentage of grass, (Canopy) canopy cover, (SBA) Stand Basal Area, (Fo0.1Km) per-centage of forest at 0.1 km, (Gr0.lKm) perper-centage of grassland at 0.1 km. The species outside the ordination plot represent the spe-cies with the highest correlation values with the corresponding axis that influence the ordination.
Table II. Results of different species richness estimators for the number of mammal species in the study area. (Mao Tau) Observed species richness, (ACE) Abundance-base Coverage Estimator, (Chao 1; Jack1) First-order Jackniffe richness estimator, (Bootstrap; MMMeans) Michaelis-Menten richness estimator.
Estimators Forest Plantation Grassland
Mao Tau 14 11 7
ACE 14 12 7
Chao 1 14 11 7
Jack 1 15 12 7
Bootstrap 15 12 7
MMMean 14 12 8
DISCUSSION
de-partment of Rivera were not detected (GONZALEZ 2001). Some of
these species are listed as extinct in the country (the jaguar Pantera onca Linnaeus, 1758; and the puma Puma concolor Linnaeus, 1771). Other species have only been observed a few times in other locations in Rivera (the southern tamandua Tamandua tetradactyla Linnaeus, 1758;and the greater naked-tailed armadillo Cabassous tatouay Desmarest, 1804) and oth-ers are more common, e.g. the brown-nosed coati Nasua nasua Linnaeus, 1766 (Jessica Castro-Prieto pers. comm.). Species such as the lutrine opossum Lutreolina crassicaudata Desmarest, 1804 and the coypu Myocastor coypus Molina, 1782 were not recorded because their typical habitats (e.g. wetlands, and lagoons) were not surveyed. Probably due to its arboreal habits, the Para-guayan hairy dwarf porcupine Sphiggurus spinosus F. Cuvier, 1823 was not recorded. However, one individual was previously observed in one of the study sites. One track of the ocelot Leopardus pardalis Linnaeus, 1758 was found at one of the for-est sites (F1) during a rapid survey in 2006, but the species was not recorded in the present study, probably due to its low abun-dance in the region. The only widely distributed and common species in the country which was not recorded in our study was the southern long-nosed armadillo Dasypus hybridus Desmarest, 1804, a grassland specialist armadillo.
Our results demonstrate that C. thous, D. novemcinctus and M. gouazoubira, the most abundant species in our data, can use transformed habitats. These are forest species with gen-eralist habits which can use cultivated lands near forest (PINDER
& LEEWENBERG 1997). They were found in forest, plantation and grassland sites. These species are also abundant in agricultural areas in the state of São Paulo, Brazil where they were recorded in a variety of habitats (e.g. sugar cane plantations, forest frag-ments, Eucalyptus plantation and grassland) (DOTTA & VERDADE
2007). In the Cerrado, C. thous was more common in Eucalyp-tus plantations than in native forest (LYRA-JORGEet al. 2008a).
The least abundant species in our results were L. wiedii and G. cuja. Leopardus wiedii is a rare small feline found exclusively in forest and has its southern distribution limit in Uruguay (OLVEIRA
1998). Although G. cuja is a generalist species capable of using disturbed areas such as plantations (DOTTA & VERDADE 2007), it
was only recorded by tracks in two gallery forests in our study. This species may not have been detected by camera traps be-cause of its small size (LYRA-JORGEet al. 2008b).
One of the main conclusions of this study is that the mammal community within a plantation-dominated matrix is characterized by a predominance of generalist species, or spe-cies that are capable of using transformed habitats (ALMEIDAet
al. 2008, FARIAS & KITTLE 2008, DOTTA & VERDADE 2007, MANFREDI
et al. 2006, PINDER & LEEWENBERG 1997), and a low proportion of specialist species. Many forest species avoid open areas such as grassland, but they can be detected traversing them while moving between forest sites. Additionally, some grassland spe-cies can explore forest looking for food (CÁCERES 2004, GONZALEZ
2001); however, carnivore species, which have large home
ranges become more generalist in an altered landscape and are not restricted to native forest (LYRA-JORGEet al. 2008a).
Another important conclusion is that transformed habi-tats such as Eucalyptus plantations can have both positive and negative effects on medium and large mammals. Plantations positively affect mammals by increasing the local distribution of some forest species that avoid grassland. Six of the ten gener-alist forest species have increased their local distribution to in-clude plantation which were previously grassland, habitats rarely used by forest species. Cerdocyon thous and D. novemcinctus have broad food and habitat requirements and they increase their local distribution by using plantations. By contrast, plantations are negatively affecting the presence and possibly the local dis-tribution of species such as D. hybridus, a very common grass-land species that was not detected in this study, presumably due to the loss and fragmentation of its primary habitat, grassland. Mammal species richness differed among the three habi-tats types (forest, plantation and grassland). This result contrasts with the results of another study near São Paulo (DOTTA & VERDADE
2007) where mammal species richness did not differ among the same three habitats plus sugar cane plantations. Species compo-sition between native forest and plantation and between forest and grassland was different. Similar results were found in other studies (DOTTA & VERDADE 2007), which highlights the
impor-tance of forest as a primary habitat and the imporimpor-tance of its conservation within a matrix of exotic tree plantations. Species composition was not significantly different between plantation and grassland although four more mammal species (D. albiventris, E. sexcinctus, O. geoffrogyi, and P. cancrivorous) were recorded in plantation. This lack of a statistically significantly difference can be explained by the fact that these species were only recorded once in plantation sites, which reduces the effect of these spe-cies in determining differences in spespe-cies composition. This re-sult suggests that mammal species use plantation differently, and that these four mammal species probably use plantation as cor-ridors, spending less time in it, which would explain the fact that they have been poorly recorded.
of the species use these habitats as primary or secondary habi-tat. Most studies emphasize the importance of forest (JOHNSONet
al. 1999, LEES & PERES 2008), but the multi-scale approach dem-onstrated also the importance of temperate grassland, one of the most threatened ecosystems worldwide, as a valuable resource for the mammal community.
Conservation activities
From our results two conservation measures can be pro-posed to landowners such as forestry companies and ranchers to conserve the mammal community outside of protected areas. The most important measure is to protect the small area of gal-lery forest by reducing logging and cattle grazing. This will help maintain habitat variables such as tree species richness, vertical structure and canopy cover, important factors determining mam-mal presence. The other important conservation measures would be to increase grassland buffer zones between plantation and forest. Presently grassland buffer zones between gallery forest and plantation are only 20 m wide. This buffer zone is created specifically to protect water quality (FSC 1996) and not grass-land or forest habitats. In order to foster mammal conservation, however, this grassland buffer zone needs to be larger, in order to reduce the impact of plantation management procedures (e.g. fertilizing, pruning, harvesting) on forest species. Although, the effect of the proximity to plantations on forest mammals was not directly assessed in our study, we believe that alteration of neighboring habitats is likely to alter the gallery forest commu-nity. In addition, buffer zones need to be larger to allow the persistence of grassland species within the plantation matrix. The conservation of mammals outside protected areas relies on the continued effort to understand how human activities affect mammal community, and how management efforts can reduce the negative impact of these activities.
ACKNOWLEDGMENTS
We thank the Andrade Núñez family specially to Hugo Andrade, the Diez Castro family, Diana Pérez, Magaly Burgues, Diego Caballero and María N. Merentiel for their assistance in the field, Ivan Grela and Elman Sánchez for plant species iden-tification, Diego Queirolo and Graziela Dotta for track species identification, Carlos Zambrana for help with data analysis, and Martha Bonilla for comments in the manuscript. This study was supported by Rufford Small Grant Foundation, Red de Macro Universidades de América Latina y el Caribe and Santander Bank, University of Puerto Rico (DEGI, Crest-Catec and Biology Graduate Program), COFUSA forestry company, and the National Science Foundation (0709598).
LITERATURE CITED
ALMEIDA, A.; C. TORQUETTI & S. TALAMONI. 2008. Use of space by
neotropical marsupial Didelphis albiventris (Didelphimorphia: Didelphidae) in an urban forest fragment. Revista Brasileira de Zoologia 25 (2): 214-219.
ANDRÉN, H. 1994. Effects of habitat fragmentation on birds and
mammals in landscapes with different proportions of suitable habitat: A review. Oikos 71 (3): 355-366.
ATAURI, J. & J. LUCIO. 2001. The role of landscape structure in
species richness distribution of birds, amphibians, reptiles and lepidopterans in Mediterranean landscapes. Landscape Ecology 16: 147-159.
ATTUM, O.; Y. LEE; J. ROE & B. KINGSBURY. 2008. Wetland complexes
and upland-wetland linkages: landscape effects on the distribution of rare and common wetland reptiles. Journal of Zoology 275: 245-251.
CÁCERES, N. 2004. Occurrence of C. chinga (Molina) (Mammalia, Carnivora, Mustelidae) and other terrestrial mammals in the Serra do Mar, Paraná, Brazil. Revista Brasileira de Zoolo-gia 21 (3): 577-579.
CARDOSODA SILVA, J. & J. BATES. 2002. Biogeographic Patterns and
Conservation in the South American Cerrado: A Tropical Savanna Hotspot. BioScience 52 (3): 225-234.
COFUSA. 2006. Resumen del Plan de Manejo. Available on line at: http://www.cofusa.com.uy [Accessed: 21.V.2009]. COLWELL, R.K. 2005. EstimateS: Statistical estimation of species
richness and shared species from samples. Version 7.5. User’s Guide and application. Available online at: http:// purl.oclc.org/estimates [Accessed: 10.I.2009].
CRACCO, M.; L. GARCÍA; E. GONZÁLEZ; L. RODRÍGUEZ & A. QUINTALLÁN.
2005. Importancia global de la biodiversidad de Uruguay. Borrador para el Proyecto Fortalecimiento de las Capa-cidades para la Implementación del Sistema Nacional de Áreas Protegidas de Uruguay. Montevideo. DINAMA/ PNUD/GEF, 25p.
DAILY, G.; G. CEBALLOS; J. PACHECO; G. SUZÁN & A. SÁNCHEZ-AZOFEIFA. 2003. Countryside biogeography of Neotropical mammals: landscapes of Costa Rica. Conservation Biology 17 (6): 1814-1826.
DAUBER, J.; M. HIRSCH; D. SIMMERING; R. WALDHARDT; A. OTTE & V.
WOLTERS. 2003. Landscape structure as an indicator of
biodiversity: matrix effects on species richness. Agriculture, Ecosystems and Environment 98: 321-329.
DOTTA, G. & L. Verdade. 2007. Trophic categories in a mammal
assemblage: diversity in an agricultural landscape. Biota Neotropical 7 (2): 287-292.
FAHRIG, L. 2003. Effects of habitat fragmentation on biodiversity.
Annual Reviews of Ecology, Evolution, and Systematics 34: 487-515.
FARIAS, A. & M. KITTLEN. 2008. Small-scale spatial variability in
the diet of pampas foxes (Pseudalopex gymnocercus) and human-induced changes in prey base. Ecological Research 23: 543-550.
FORMAN, R. T. T. 1999. Land Mosaics. The ecology of landscapes
and regions. New York, Cambridge University Press, 632p. FSC. 1996. National Forest Stewardship Standard for Finland. Available online at: http://finland.fsc.org [Accessed: 15.V.2009].
GEARY, T. F. 2001. Afforestation in Uruguay. Study of a Changing
Landscape. Journal of Forestry 99 (7): 35-39.
GORRESEN, P.; M. WILLING & R. Strauss. 2005. Multivariate analysis of scale-dependent associations between bats and landscape structure. Ecological Applications 15 (6): 2126-2136. GOTELLI, N. & R. COLWELL. 2001. Quantifiying biodiversity:
procedures and pitfalls in the measurement and comparison of species richness. Ecology Letters 4: 379-391.
GOTMARK, F.; T. VON PROSCHWITZ & N. FRANC. 2008. Are small
sedentary species affected by habitat fragmentation? Local vs. landscape factors predicting species richness and composition of land molluscs in Swedish conservation forest. Journal of Biogeography 35: 1062-1076.
GONZÁLEZ, E.M. 2001. Guía de campo de los mamíferos de
Uruguay. Introducción al estudio de los mamíferos. Montevideo, Vida Silvestre, 340p.
HABEEB, R.; J. TREBILCO; S. WOTHERSPOON & C. JOHNSON. 2005. Determining natural scales of ecological systems. Ecological Monographs 75 (4): 467-487.
HABEEB, R.; C. JOHNSON; S. WOTHERSPOON & P. MUMBY. 2007. Optimal
scales to observe habitat dynamics: a coral reef example. Ecological Applications 17 (3): 641-647.
HOLLAND, J.; D. BERT & L. FAHRIG. 2004. Determining the spatial scale of species response to habitat. BioScience 53 (3): 227-233.
HOLM, S. 1979. A simple sequentially rejective multiple test
procedure. Scandinavian Journal of Statistics 6: 65-70. IUCN. 2008. 2008 IUCN Red List of Threatened Species.
Available on line at: http://www.iucnredlist.org [Accessed: 15.V.2009].
JOHNSON, M.A.; P.M. SARAIVA & D. COELHO. 1999. The role of gallery
forests in the distribution of Cerrado mammals. Revista Brasileira de Biologia 59 (3): 421-427.
KARLSON, R. & H. CORNELL. 1998. Scale dependent variation in
local versus regional effects on coral species richness. Ecological Monographs 68 (2): 259-274.
KEITT, T.H.; D.L. URBAN & B.T. MILNE. 1997. Detecting critical scales in fragmented landscapes. Conservation Ecology (on line) 1(1): 4. Available on line at: http://www.consecol.org/ vol1/iss1/art4 [Accessed: 19.XII.2008].
LAMBIN, E.; B. TURNER; H. GEIST; S. AGBOLA; A. ANGELSEN; J. BRUCE;
O. COOMES; R. DIRZO; G. FISCHER; C. FOLKE; P. GEORGE; K.
HOMEWOOD; J. IMBERNON; R. LEEMANS; X. LI; E. MORAN; M. MORTIMORE; P. RAMAKRISHNAN; J. RICHARDS; H. SKANES, W. STEFFEN,
G. STONE, U. SVEDIN, T. VELDKAMP, C. VOGEL & J. XU. 2001. The
cause of land-use and land-cover change: moving beyond the myths. Global Environmental Change 11 (4): 261-269. LEES, A. & C. PERES. 2008. Conservation value of remnant riparian
forest corridors of varying quality for Amazonian birds and mammals. Conservation Biology 22 (2): 439-449. LINDENMAYER, D.; R. CUNNINGHAM & M. POPE. 1999. A large scale
“experiment” to examine the effects of landscape context and habitat fragmentation on mammals. Biological Conservation 88: 387-403.
LYRA-JORGE, M.; G. CIOCHETI & R. PIVELLO. 2008a. Carnivore mammals in a fragmented landscape in northeast of Sao Paulo, Brazil. Biodiversity Conservation 17: 1573-1580. LYRA-JORGE, M.; G. CIOCHETI; R. PIVELLO & S. TADEU. 2008b.
Comparing methods for sampling large and medium-size mammals: camera traps and track plots. European Journal of Wildlife Research 54 (4): 739-744.
MANFREDI, C.; L. SOLER; M. LUCHERINI & E. CASANAVE. 2006. Home
ran-ge and habitat use by Geoffroy’s cat (Oncifelis ran-geoffroyi) in a wet grassland in Argentina. Journal of Zoology 268: 381-387. MCCUNE, B. & M.J. MEFFORD. 1999. PC-ORD. Multivariate
Analysis of Ecological Data. Version 5.0. Glededen Beach, MjM Software.
MGAP. 2005. Boletín Forestal.2005. Dirección General Forestal. Available on line at: htpp://www.mgap.gub.uy/ Forestal/Boletín2005.pdf [Accessed: 11.III.2009].
MIKUSINSKI, G. & P. ANGELSTAM. 2004. Ocurrence of mammals and birds with different ecological characteristics in relation to forest cover in Europe- do macroecological data make sense? Ecological Bulletins 51: 265-275.
MILLENNIUM ECOSYSTEM ASSESSMENT. 2005. Ecosystems and human well-being: a framework for assessment. Washington. Island Press, 266p.
OLFF, H. & M. RITCHIE. 2002. Fragmented nature: consequences
for biodiversity. Landscape and Urban Planning 58 (2-4): 83-92.
OLVEIRA, T. 1998. Leopardus wiedii. Mammalian Species 579:
1-6.
PINDER, L. & F. LEEUWENBERG. 1997. Veado-catingueiro, p. 59-68.
In: J.M.B. DUARTE (Ed.).Biologia e conservação de Cervídeos
sul-americanos: Blastocerus, Ozotoceros e Mazama. Jaboticabal, Funep.
R DEVELOPMENT CORE TEAM. 2009.R: A language and environment
for statistical computing. R Foundation for Statistical Computing, Vienna, Austria. ISBN 3-900051-07-0. Available on line at: http://www.R-project.org [Accessed: 15.III.2009]. REIDSMA, P.; T. TEKELENBURG; M. VANDEN BERG & ALKEMADE, R. 2006. Impacts of land use change on Biodiversity in the European Union. Agriculture, Ecosystems and Environment 114: 86-102.
RHODES, J.; C. MCALPINE; A. ZUUR; G. SMITH & E. IENO. 2009. GLMM
applied on the spatial distribution of koalas in a fragmented landscape, p. 469-492. In: A. ZUUR; E. IENO; N. WALKER; A.
SAVELIEV & G. SMITH (Eds). Mixed Effects Models and
Extensions in Ecology with R. New York. Springer. SALA, O.; F. CHAPIN III; J. ARMESTO; E. BERLOW; J. BLOOMFIELD; R.
LEEMANS; T. LODGE; H. MOONEY; M. OESTERHELD; N. LEROY; T.
SYKES; B. WALKER; M. WALKER & D. WALL. 2000. Global
Biodiversity Scenarios for the Year 2100. Science 287: 1770-1774.
SALA, O.; A. AUSTIN & L. VIVANCO. 2001. Temperate grassland and
shrubland ecosystems, 5. p 627-635. In: S. A. LEVIN (Ed).
Encyclopedia of Biodiversity. San Diego. Academic Press. SANDERSON, J. 2004. Tropical Ecology, Assessment and
Monitoring Initiative. Camera Phototrapping Monitoring protocol. Version 2.0. Available on line at: http:// costarica.jsd.claremont.edu/pdf/TEAMCameraTraps-PT-EN-2.0.pdf [Accessed: 6.X.2008].
TORRES, J.M. & A. FOSSATI. 2004. Estudio de tendencias y
pers-pectivas del sector forestal en América Latina.
Documen-Submitted: 19.XI.2009; Accepted: 19.IX.2010. Editorial responsibility: Heraldo L. de Vasconcelos
to de Trabajo. Informe Nacional Uruguay. Roma. FAO. Available on line at: http://www.fao.org/docrep/007/j2807s/ j2807s00.HTM [Accessed: 4.XII.2008]
TURNER, M.; R. GARDNER & R. O’NEILL. 2001. Landscape ecology
in theory and practice: patterns and processes. New York, Springer-Verlag, 401p.
VANDERMEER, J. & R. CARVAJAL. 2001. Metapopulation dynamics and the quality of the matrix. The American Naturalist 158 (3): 211-220.
ZABALA, J.; I. ZUBEROGOITA & J. MARTINEZ-CLIMENT. 2005. Site and