cases from the Information System on Live Births (Sinasc),
2000-2015
Correspondence:
Fatima Marinho – Ministério da Saúde, Secretaria de Vigilância em Saúde, Departamento de Vigilância de Doenças e Agravos Não Transmissíveis e Promoção da Saúde (DANTPS), SAF SUL, Trecho 02, Lotes 05-06, Bloco F, Edifício Premium, Torre 1- Térreo, Sala 14, Brasília-DF. Brasil. CEP: 70.070-600
E-mail: [email protected] Abstract
Objective: to describe the prevalence coefficients and characterize cases of microcephaly at birth in Brazil from 2000-2015. Methods: this is a descriptive study with data from the Information System on Live Births (Sinasc). The coefficients were calculated by region and characteristics of mothers and live births (LB). Results: the annual average number of microcephaly cases was 164 for the period 2000-2014, whilst in 2015, 1,608 cases were registered (54.6 cases per 100 thousand LB). Higher coefficients were observed among preterm babies (81.7; 95%CI 72.3;92.2), born from black-skinned (70.9; 95%CI 58.5;85.9) or to brown-skinned (71.5; 95%CI67.4;75.8) women, to women aged ≤19 (70.3; 95%CI 63.5;77.8) or ≥40 (62.1; 95%CI 46.6;82.6), with ≤3 years of study (73.4; 95%CI 58.2;92.4) and residents in the Northeast region (138.7; 95%CI 130.9;147.0). Conclusion: the high number of microcephaly cases in 2015 reinforces the importance of Sinasc and the need to improve the surveillance of congenital anomalies.
Key words: Microcephaly; Congenital Anomaly; Live Birth; Epidemiology, Descriptive; Brazil.
doi: 10.5123/S1679-49742016000400004
Fatima Marinho1
Valdelaine Etelvina Miranda de Araújo1
Denise Lopes Porto1
Helena Luna Ferreira1
Marta Roberta Santana Coelho1
Roberto Carlos Reyes Lecca1
Helio de Oliveira1
Ivana Pereira de Almeida Poncioni1
Maria Helian Nunes Maranhão1
Yluska Myrna Meneses Brandão e Mendes1
Roberto Men Fernandes1
Raquel Barbosa de Lima1
Dácio de Lyra Rabello Neto1
Introduction
The congenital anomalies, including microcephaly, have a complex and multifactorial etiology, and can be caused by chromosomal anomalies, exposure to environmental teratogens, metabolic disorders, and also by maternal diseases during pregnancy. They can be primary, if they are present at birth, or secondary, if they are developed after birth. The primary microcephaly is characterized by the head circumference two standard deviations (SD) below the average specific for the sex and gestational age. Although being a practical definition, defining microcephaly from the head circumference may lead to the inclusion of brains with normal development.1,2
In Brazil, data on live births are collected at birth, by issuing the Certificate of Live Birth and recording the information on the Information System on Live Births (Sinasc) of the Ministry of Health. Sinasc's
coverage and data quality have been improved since its implementation, in 1990.3,4 For the years of 2010 and 2013, the coverage was estimated in 95% and 96%, respectively.5,6 The information recorded on this system is essential to planning and assessing the actions in health directed to pregnant women, to childbirth and to the newborn.7
All the congenital anomalies diagnosed by the doctor must be described in the Certificate of Live Birth, without any hierarchy or assumptions to group them into syndromes, and there is no need to codify them.10 The better the description is, the better will be the codification and information production work, which is highly useful to health surveillance for monitoring the frequency and time trends of different types of anomalies. The information generated also helps on the identification of elements that are part of the causal chain of the congenital anomalies and on the assessment of the primary prevention efforts during prenatal care, and also on pre-conception care.8,9,10
On Sinasc, primary microcephaly is defined by the
head circumference below 3 SD of the development
curves for the given gestational age and sex.2,10,11 This definition corresponds to a head circumference from 28.85 to 30.99cm for female live births (gestational age from 259 to 293 days, or approximately 37 to 41 weeks) and from 29.12 to 31.52cm for male live births at term birth.12
In Brazil, in the period 2000-2014, the number of live births with microcephaly presented stability. However, from October 2015, an unexpected raise in the number of cases was observed, mainly in Pernambuco State, which is located in the Northeast region of the country.13,14 Later, on February 1, 2016, the International Health Regulations Emergency Committee declared that the amount of microcephaly cases and other neurological disorders reported in Brazil, after the occurrence of a similar case in French Polynesia in 2014, constituted a Public Health Emergency of International Concern (PHEIC), due to the probable association to Zika virus.15
This situation motivated the conduction of this study, which aims to describe the prevalence rates and characterize cases of microcephaly at birth in Brazil, in the period 2000-2015.
Methods
This descriptive study used secondary data from
Sinasc, concerning the period from 2000 to 2015. Data
from 2015, updated on February 12, 2016, were still preliminary when this study was conducted.
Sinasc is fed by data collected through the Certificate
of Live Birth, in which there is a field to describe congenital anomalies – simple or multiple – identified at the childbirth. Sinasc's records which were included
in this study belonged to live births with microcephaly in combination or not with other(s) congenital anomaly(ies). These anomalies are identified according to the following codes of the 10th Revision of the International Statistical Classification of Diseases and Related Health Problems – ICD-1016: congenital malformations of the nervous system, (Q00 to Q07 - Q02 refers to microcephaly); congenital malformations of eye, ear, face and neck (Q10 to Q18); congenital malformations of the circulatory system (Q20 to Q28); congenital malformations of the respiratory system (Q30 to Q34); cleft lip and cleft palate (Q35 to Q37); other congenital malformations of the digestive system (Q38 to Q45); congenital malformations of genital organs (Q50 a Q56); congenital malformations of the urinary system (Q60 to
Q64); congenital malformations and deformations of the musculoskeletal system (Q65 to Q79); other congenital malformations (Q80 to Q89); chromosomal anomalies not elsewhere classified (Q90 to Q99); haemangioma and lymphangioma of any site (D18).
The cases of microcephaly at birth, in 2015, were described according to the following groups of variables: (i) mother's geographic place of residence: state, region (North, Northeast, Southeast, South, Midwest) and population size of the municipality (<20 thousand inhabitants; 20 to 50 thousand; >50 to 100 thousand; >100 to 500 thousand; >500 thousand); (ii) mother's characteristics: age group (up to 19 years old; 20-24; 25-29; 30-34; 35-39; ≥40), education level (0-3 years of schooling; 4-7; 8-11; ≥12), ethnicity/skin color (white; black; brown; yellow; indigenous), marital status (single, married, legally separated/divorced/ widowed; in cohabitation); (iii) pregnancy and childbirth: number of prenatal care appointments (none; 1-3; 4-5, ≥6), trimester of the first prenatal care appointment (1st; 2nd; 3rd), place of childbirth (health care facility; other), type of childbirth (vaginal; cesarean section), weeks of pregnancy (<37, preterm; 37, 38, 39-41, at term birth; ≥42, postterm), type of pregnancy (single; multiple); (iv) characteristics of the newborn: month of birth, sex (male, female); birth weight (<2,500g, low weight; ≥2,500g, appropriate weight), presence of other congenital malformations besides microcephaly (yes; no), Apgar score at 1st and 5th minutes after birth (0-3; 4-7; 8-10).
For the period from 2000 to 2015, annual coefficients of microcephaly prevalence were estimated for Brazil and regions, and the time series were described. The numerator and denominator of the prevalence coefficient of microcephaly at birth (per 100 thousand live births) were, respectively, the number of live births with microcephaly and the total of live births, according to the categories of the aforementioned variables. Prevalence ratios (PR) and 95% confidence intervals (95%CI) were calculated. The reference category to calculate the PR was the one with the lowest prevalence coefficient. The category of ignored values was excluded from all the variables due to its small frequency and was presented in the table’s foot.
The analyses were performed with the statistics packages IBM SPSS, Statistical Analysis System (SAS), Tableau Public and OpenEpi. In accordance with the ethics in research, the databases analyzed in this study did not include any variable that allowed the identification
of the individuals involved – such as name, mother's name and address. Therefore, it was not necessary to submit this study to the Ethics Research Committee.
Results
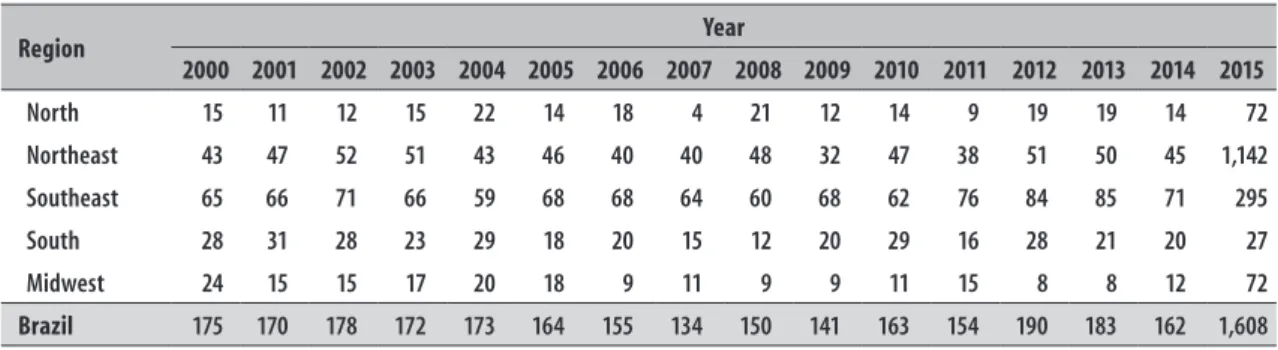
In the period from 2000 to 2014, 2,464 live births with microcephaly were registered in Brazil, with an annual average of 164 (standard deviation = 15). In 2015, the number of cases increased in 9 times in relation to the average, with a total of 1,608 cases. In 2015, 71% of the live births with microcephaly (n=1,142) were born to mothers resident in the Northeast region (Table 1). This time-space concentration also reflected in the prevalence rate of microcephaly at birth for the year of 2015 (Figures 1A, 1B and 1C).
The time evolution of the prevalence rate of microcephaly in Brazil, according to month of birth, showed a growth that started in October 2015 (Figure 1B). In that year, most of the prevalence rates of microcephaly at birth were observed in the following states of the Northeast: Pernambuco, Sergipe and Paraíba (Figure 1C). For the month of August, a slight growth on the prevalence rate was observed among live births to mothers resident in Mato Grosso State (data not presented).
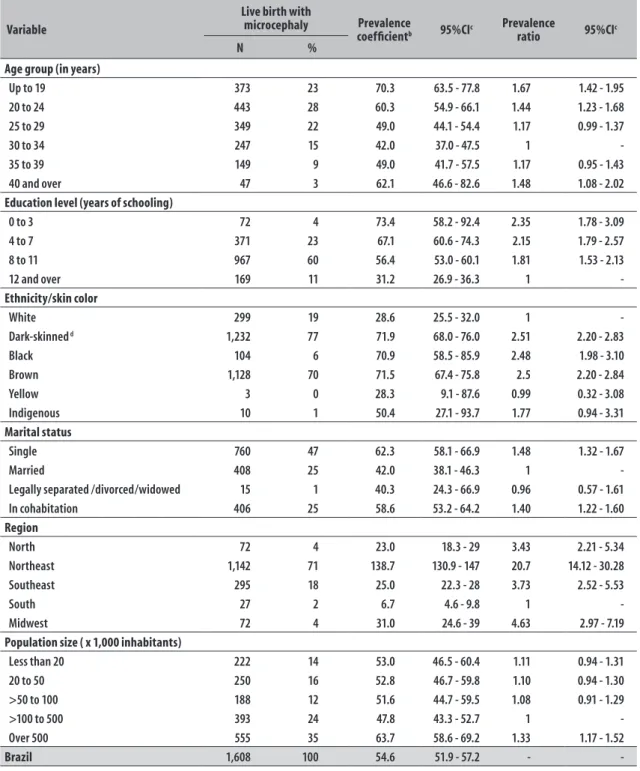
In 2015, the prevalence coefficient of microcephaly at birth in Brazil was of 54.6 cases per 100 thousand live births. The region with the highest rate was the Northeast (139 cases per 100 thousand LB), which corresponds to 28 times the average of the prevalence for this region in the period from 2000 to 2014 (5.0 cases per 100 thousand LB). The second highest prevalence coefficient was observed in the Midwest (31.0 cases per 100 thousand LB), almost five times smaller than the one found in the Northeast (Table 2).
According to the population size of the mother's municipality of residence, the prevalence coefficients of microcephaly at birth were similar among the municipalities with up to 500 thousand inhabitants. However, a higher coefficient was observed in municipalities with over 500 thousand inhabitants (Table 2). This comparison used as reference the population size category of 100 to 500 thousand inhabitants.
Rio Grande do Norte
Paraíba
Pernambuco
Alagoas
Sergipe 82.3
Maranhão
57.3 Ceará
123.2 Piauí
118.1 Bahia
147.8 181.7
279.2
54.8 227.2 North
Northeast
Midwest
Southeast
South
Brazil Northeast
C
300
250
200
150
100
50
0
Pr
ev
alen
ce
(x
1
00
t
hou
sa
nd
)
Jan
Month
7.5 6.7 4.3 5.0 6.7 5.6 8.8
28.7 17.5
83.9 253.4
288.9
B
140
120
100
80
60
40
20
0
Pr
ev
alen
ce
(x
1
00
t
hou
sa
nd
)
North Northeast Southeast South Midwest Brazil
2000 2001 2002 2003 2004 2005 2006 2007 2008 2009 2010 2011 2012 2013 2014 2015
A
a) Number of live births in 2015 = 2,951,136 (partial data update on 02/12/2016).
Figure 1 – Prevalence coefficient of microcephaly at birth (per 100 thousand live births), according to the mother’s region of residence, 2000-2015 (A); month of childbirth in 2015 (B) and state of residence in the Brazilian Northeast region in 2015a (C)
Feb Mar Apr May Jun Jul Aug Sep Oct Nov Dec
0 1000 2000 3000 Kilometers
Table 1 – Absolute frequency of live births with microcephaly, according to year of birth and mother’s region of residence; Brazil, 2000 to 2015a
Region Year
2000 2001 2002 2003 2004 2005 2006 2007 2008 2009 2010 2011 2012 2013 2014 2015
North 15 11 12 15 22 14 18 4 21 12 14 9 19 19 14 72
Northeast 43 47 52 51 43 46 40 40 48 32 47 38 51 50 45 1,142
Southeast 65 66 71 66 59 68 68 64 60 68 62 76 84 85 71 295
South 28 31 28 23 29 18 20 15 12 20 29 16 28 21 20 27
Midwest 24 15 15 17 20 18 9 11 9 9 11 15 8 8 12 72
Brazil 175 170 178 172 173 164 155 134 150 141 163 154 190 183 162 1,608
a) Number of live births in 2015 = 2,951,136 (partial data updated on 12/02/2016)
color and who self-declared single or in cohabitation. A decreasing trend of the prevalence of microcephaly at birth was observed as the mother's education level increased. Mothers with up to 3 years of schooling presented a prevalence ratio 2.4 times comparing to mothers with 12 years or over of schooling. Most of the mothers to children with microcephaly at birth did not have higher education (87%), and there was a predominance of 8 to 11 years of schooling for all age groups.
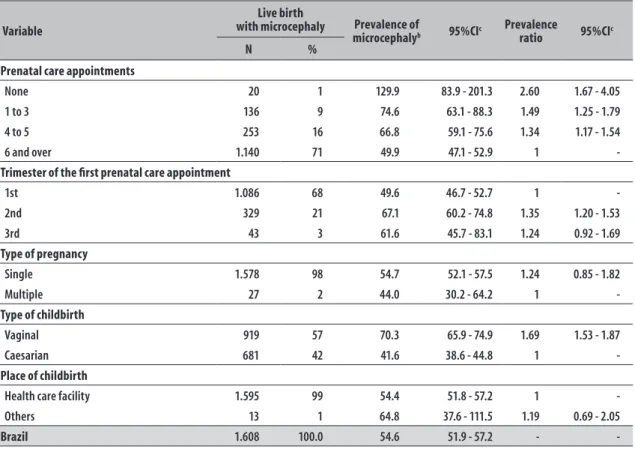
Concerning prenatal care, 71% of the mothers to live births with microcephaly attended six or more appointments and 68% started the prenatal care in the first trimester of pregnancy. The prevalence ratio of microcephaly at birth was 2.6 times among mothers who did not attend prenatal care when comparing to those who attended six or more appointments. The prevalence coefficient of microcephaly was lower among mothers with a higher number of prenatal care appointments. With regard to childbirth, 99% were performed in health care facilities and 57% were vaginal (Table 3).
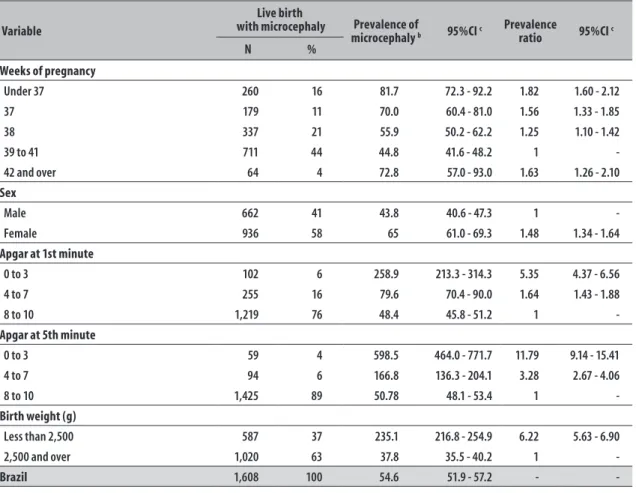
When the information on the live births is analyzed, a prevalence of the following characteristics could be observed: at term births (76%), adequate birth weight (63%) and Apgar score 8 to 10 in the 1st (76%) and 5th (89%) minutes after birth (Table 4).
The highest prevalence coefficient of microcephaly (81.7 per 100 thousand) was observed among preterm live births, corresponding to 1.82 times the observed among babies born between 39 and 41 weeks (44.8 per 100 thousand). A decreasing trend was observed in the prevalence of microcephaly as the gestational age increased up to the 41st week. Then, there was a growth in the rate among the postterm live births (72.8 per 100 thousand) (Table 4).
With regard to Apgar score, we can highlight the high prevalence coefficients of microcephaly among those with Apgar score <4 (258.9 per 100 thousand in the 1st minute and 598.5 per 100 thousand in the 5th minute after birth), and the prevalence ratios were of 5.35 and 11.78, respectively, when comparing to live births with Apgar score between 8 and 10 (Table 4).
A predominance of female live births with microcephaly was observed (Table 4). The prevalence rate (65.0 per 100 thousand) was higher than the prevalence for the male sex (43.8 per 100 thousand).
The prevalence of microcephaly in the group of low birth weight (235.1 per 100 thousand) was higher than in the group with adequate birth weight, whose prevalence ratio was of 6.22 (Table 4). Among the infants with microcephaly and low birth weight, 65% were born at term.
Among the live births with microcephaly, 456 multiple anomalies were registered in 259 infants. The organs/ systems more frequently involved were: musculoskeletal (41% n=49/456), nervous (12% n=55/456), eye, ear, face and neck (11%; n=49/456) (data not presented).
Discussion
In this study, the unexpected increase of the prevalence coefficient of live births with microcephaly stands out, mainly in the Brazilian Northeast region, after October 2015. This growth has been associated to the probable intrauterine exposition to Zika virus.14,17
Table 2 – Frequency of live births and prevalence coefficient of microcephaly at birth (per 100 thousand live births), according to sociodemographic characteristics, region and population size of the mothers’ municipality of residence; Brazil, 2015a
Variable
Live birth with
microcephaly Prevalence
coefficientb 95%CIc Prevalence ratio 95%CIc
N %
Age group (in years)
Up to 19 373 23 70.3 63.5 - 77.8 1.67 1.42 - 1.95
20 to 24 443 28 60.3 54.9 - 66.1 1.44 1.23 - 1.68
25 to 29 349 22 49.0 44.1 - 54.4 1.17 0.99 - 1.37
30 to 34 247 15 42.0 37.0 - 47.5 1
-35 to 39 149 9 49.0 41.7 - 57.5 1.17 0.95 - 1.43
40 and over 47 3 62.1 46.6 - 82.6 1.48 1.08 - 2.02
Education level (years of schooling)
0 to 3 72 4 73.4 58.2 - 92.4 2.35 1.78 - 3.09
4 to 7 371 23 67.1 60.6 - 74.3 2.15 1.79 - 2.57
8 to 11 967 60 56.4 53.0 - 60.1 1.81 1.53 - 2.13
12 and over 169 11 31.2 26.9 - 36.3 1
-Ethnicity/skin color
White 299 19 28.6 25.5 - 32.0 1
-Dark-skinned d 1,232 77 71.9 68.0 - 76.0 2.51 2.20 - 2.83
Black 104 6 70.9 58.5 - 85.9 2.48 1.98 - 3.10
Brown 1,128 70 71.5 67.4 - 75.8 2.5 2.20 - 2.84
Yellow 3 0 28.3 9.1 - 87.6 0.99 0.32 - 3.08
Indigenous 10 1 50.4 27.1 - 93.7 1.77 0.94 - 3.31
Marital status
Single 760 47 62.3 58.1 - 66.9 1.48 1.32 - 1.67
Married 408 25 42.0 38.1 - 46.3 1
-Legally separated /divorced/widowed 15 1 40.3 24.3 - 66.9 0.96 0.57 - 1.61
In cohabitation 406 25 58.6 53.2 - 64.2 1.40 1.22 - 1.60
Region
North 72 4 23.0 18.3 - 29 3.43 2.21 - 5.34
Northeast 1,142 71 138.7 130.9 - 147 20.7 14.12 - 30.28
Southeast 295 18 25.0 22.3 - 28 3.73 2.52 - 5.53
South 27 2 6.7 4.6 - 9.8 1
-Midwest 72 4 31.0 24.6 - 39 4.63 2.97 - 7.19
Population size ( x 1,000 inhabitants)
Less than 20 222 14 53.0 46.5 - 60.4 1.11 0.94 - 1.31
20 to 50 250 16 52.8 46.7 - 59.8 1.10 0.94 - 1.30
>50 to 100 188 12 51.6 44.7 - 59.5 1.08 0.91 - 1.29
>100 to 500 393 24 47.8 43.3 - 52.7 1
-Over 500 555 35 63.7 58.6 - 69.2 1.33 1.17 - 1.52
Brazil 1,608 100 54.6 51.9 - 57.2 - -
Note: the values ignored according to category are: age group (0.0%); education level (1.8%); ethnicity/skin color (4.0%), marital status (1.2%), region (0.0%) and population size (0.0%). a) Number of live births in 2015 = 2,951,136 (partial data updated on 02/12/2016)
b) Numerator = No. of live births with microcephaly; Denominator=total of live births; Multiplication factor = 100,000 c) 95%CI: 95% confidence interval
Table 3 – Frequency of live births and prevalence coefficient of microcephaly at birth (per 100 thousand live births). according to characteristics of prenatal care and childbirth; Brazil. 2015a
Variable
Live birth
with microcephaly Prevalence of
microcephalyb 95%CIc
Prevalence
ratio 95%CIc
N %
Prenatal care appointments
None 20 1 129.9 83.9 - 201.3 2.60 1.67 - 4.05
1 to 3 136 9 74.6 63.1 - 88.3 1.49 1.25 - 1.79
4 to 5 253 16 66.8 59.1 - 75.6 1.34 1.17 - 1.54
6 and over 1.140 71 49.9 47.1 - 52.9 1
-Trimester of the first prenatal care appointment
1st 1.086 68 49.6 46.7 - 52.7 1
-2nd 329 21 67.1 60.2 - 74.8 1.35 1.20 - 1.53
3rd 43 3 61.6 45.7 - 83.1 1.24 0.92 - 1.69
Type of pregnancy
Single 1.578 98 54.7 52.1 - 57.5 1.24 0.85 - 1.82
Multiple 27 2 44.0 30.2 - 64.2 1
-Type of childbirth
Vaginal 919 57 70.3 65.9 - 74.9 1.69 1.53 - 1.87
Caesarian 681 42 41.6 38.6 - 44.8 1
-Place of childbirth
Health care facility 1.595 99 54.4 51.8 - 57.2 1
-Others 13 1 64.8 37.6 - 111.5 1.19 0.69 - 2.05
Brazil 1.608 100.0 54.6 51.9 - 57.2 - -
Note: the ignored values according to categories are: prenatal care appointment (4.0%); trimester of the first prenatal care appointment (9.3%); type of pregnancy (0.2%); type of childbirth (0.5%) and place of childbirth (0.0%)
a) Number of live births in 2015 = 2.951.136 (partial data updated on 02/12/2016)
b) Numerator = No. of live births with microcephaly; Denominator = total number of live births; Multiplication factor = 100,000 c) 95%CI: 95% confidence interval
in the Northeast region of the country, and who self-declared single or in cohabitation. Although the variable "income" has not been included in the present study, because it is not present on Sinasc, these results gather
proxy variables that can lead to the conclusion that most mothers of newborns with microcephaly cases belong to an unfavorable socioeconomic context. Gross et al.18 also described the association between microcephaly and low socioeconomic level. Moreover, according to the Brazilian Institute of Geography and Statistics (IBGE),19 the average monthly income of individuals aged 14 or over in the Northeast region was the lowest amongst Brazilian regions, and corresponded to 67% of the country's average in 2015.
According to the 2010 demographic census, the population of the Northeast region is essentially composed by dark-skinned individuals (69.2%), being 59.8% brown and 9.4% black.20 Taking into consideration that most
cases were concentrated in that region, the population characteristics according to ethnicity/skin color can, partly, explain the fact that the highest prevalence coefficients of microcephaly at birth, in Northeast, have been observed to dark-skinned women's children. In this study, the highest prevalence coefficients of microcephaly in Brazil were observed, in 2015, in the following states of the Northeast region: Pernambuco, Paraíba and Sergipe. In another study, conducted in Brazil, the states of Pernambuco, Paraíba and Bahia were described with higher growth of cases in 2015, compared to their respective annual averages for the period from 2000 to 2014.14 The different approaches of these studies to measure the frequency of this disease, probably contributed to the differences observed.
Table 4 – Frequency of live births and prevalence coefficient of microcephaly at birth (per 100 thousand live births), according to characteristics of the newborns; Brazil, 2015a
Variable
Live birth
with microcephaly Prevalence of
microcephaly b 95%CI c
Prevalence
ratio 95%CI c
N %
Weeks of pregnancy
Under 37 260 16 81.7 72.3 - 92.2 1.82 1.60 - 2.12
37 179 11 70.0 60.4 - 81.0 1.56 1.33 - 1.85
38 337 21 55.9 50.2 - 62.2 1.25 1.10 - 1.42
39 to 41 711 44 44.8 41.6 - 48.2 1 -
42 and over 64 4 72.8 57.0 - 93.0 1.63 1.26 - 2.10
Sex
Male 662 41 43.8 40.6 - 47.3 1 -
Female 936 58 65 61.0 - 69.3 1.48 1.34 - 1.64
Apgar at 1st minute
0 to 3 102 6 258.9 213.3 - 314.3 5.35 4.37 - 6.56
4 to 7 255 16 79.6 70.4 - 90.0 1.64 1.43 - 1.88
8 to 10 1,219 76 48.4 45.8 - 51.2 1 -
Apgar at 5th minute
0 to 3 59 4 598.5 464.0 - 771.7 11.79 9.14 - 15.41
4 to 7 94 6 166.8 136.3 - 204.1 3.28 2.67 - 4.06
8 to 10 1,425 89 50.78 48.1 - 53.4 1 -
Birth weight (g)
Less than 2,500 587 37 235.1 216.8 - 254.9 6.22 5.63 - 6.90
2,500 and over 1,020 63 37.8 35.5 - 40.2 1 -
Brazil 1,608 100 54.6 51.9 - 57.2 - -
Note: the ignored values according to categories are: weeks of pregnancy (3.5%); sex (0.6%), Apgar at 1st minute (2.0%), Apgar at 5th minute (2.0%), birth weight (0.1%). a) Number of live births in 2015 = 2,951,136 (partial data updated on 02/12/2016)
b) Numerator = No. of live births with microcephaly; Denominator = total number of live births; Multiplication factor = 100,000 c) 95%CI: 95% confidence interval
fact that the demographic density of populous municipalities favors the transmission of vector-borne diseases.21,22,23 Besides that, those municipalities usually have better structure and management of health services and, thus, are more likely to detect and notify microcephaly cases when comparing to smaller-population municipalities.9,10
The highest prevalence coefficients of microcephaly were observed among live births with unsatisfactory general conditions: preterm, with low birth weight and Apgar score <4 in the 1st and 5th minutes after birth. Similar results were found by Gross et al.,18 who described the association between microcephaly at birth, the intrauterine growth retardation, the low Apgar score and the low socioeconomic level. In a study with Korean children, the authors observed an association
between congenital malformations, high proportion of low birth weight, preterm birth, multiple births and advanced maternal age.24 In a cohort study conducted in the South of Brazil, the maternal age between 16 and 19 years old was associated to higher risk of low birth weight and preterm birth. However, this higher risk among adolescent mothers would be better explained due to their socioeconomic conditions, rather than their biological features.25
In Brazil, due to the microcephaly outbreak and to the possible association with the virus Zika,11,14,26 there was a high appeal for health professionals concerning epidemiological surveillance of suspect cases, which contributed to improve notification on Sinasc.
Although Sinasc does not present information on
for microcephaly adopted by the Ministry of Health for this system asks for the notification of live births with HC equal or lower than three standard deviations under the average for age and sex.10 Therefore, the absence of HC record does not allow the information on microcephaly to be validated, as well as the criterion used for notification. Nevertheless, the criterion used on Sinasc is more specific than the
surveillance system for microcephaly and/or changes in the central nervous system that suggest congenital infection, implemented by the Ministry of Health.11 In this system, the definition of suspect case initially included live births at term for both sexes with HC equal or smaller than 33cm and, later, equal or smaller than 32cm.11 After March 13, 2016 the new definition of suspect case included at term live births with HC inferior to 31.5 and 31.9cm for female and male babies, respectively.11 It is important to highlight that the data analyzed in this study is previous to this most recent definition.
Concerning emergency public health situation, the simultaneity of case definitions of microcephaly used on Sinasc and surveillance, besides the change
occurred throughout time of suspect case definition for the surveillance may have contributed for the superestimation of cases on Sinasc. In this context, the
possibilities of cases notification to Sinasc from the HC
adopted for surveillance and false-positive diagnoses due to the high sensibility of the definition of suspect cases stand out.13,28,29 These facts may also explain the isolated raise in the prevalence observed in August, among live births to mothers residents in Mato Grosso (results not presented).
During the data collection for this study, the measures of HC adopted by the surveillance system were the same for both sexes, which can partly explain the highest prevalence of cases among female babies, as described in our results.
Owing to the public health emergency situation, a priority in data entry (typing) of microcephaly cases on Sinasc over newborns with normal head
circunpherence may have occurred. This situation may have contributed to the overestimation of the number of microcephaly cases on Sinasc in 2015.
This study presents univariate analysis, not considering the multiple relations between variables and confounding possibility. However, it contributes to the knowledge and discussion on microcephaly at birth in Brazil, which
was characterized as a Public Health Emergency of International Concern (PHEIC) in 2015.15
This phenomenon has been widely studied due to its complexity, in order to obtain more scientific evidence about its etiology. A revision study concluded that there is a causal association between intrauterine exposition to Zika virus and microcephaly at birth, although there are still some questions to be explored.30
Given the facts, we suggest a review in the form of the Certificate of Live Birth to include the register of HC and other anthropometric measurements that are already conducted but do not have a field to be recorded in the current model of the form. Another important measure would be the development of a surveillance model for all congenital anomalies that included, among other actions, the improvement on case definitions, the creation of a list with priority anomalies for epidemiological investigation, as well as the training and tools of the necessary resources. Furthermore, some coordinated actions between the surveillance services and health care need to be strengthened, in order to prevent new cases and for health promotion, and also for the children with microcephaly and their families follow up.
Authors’ contributions
Marinho F and Araújo, VEM contributed to the conception and design of the study, results analysis and interpretation, drafting and critical review of the manuscript's content.
Porto, DL contributed to the conception and design of the study, preparation of the database, results analysis and interpretation, and manuscript's drafting.
Rabello Neto, DL contributed to the results analysis and interpretation, and critical review of the manuscript's content.
Ferreira, HL and Lecca, RCR contributed to the literature review and critical review of the manuscript's content.
Coelho, MRS, Oliveira, H, Poncioni, IPA, Maranhão, MHN, Brandão and Mendes, YMM, Fernandes, RM, Lima, RB contributed to the management of Sinasc
nationwide and to drafting the preliminary versions of the manuscript.
1. World Health Organization. Birth defects surveillance: a manual for programme managers. Geneva: World Health Organization; 2014.
2. Estudio Colaborativo Latino Americano de
Malformaciones Congénitas. Microcefalia no ECLAMC e no Brasil [Internet]. Buenos Aires: Estudio Colaborativo Latino Americano de Malformaciones Congénitas; 2015 [citado 2016 Jul 12]. Disponível em: http://www.eclamc.org/descargas/1. Microcefalia no ECLAMC e no Brasil.docx
3. Moura EC, Cortez-Escalante JJ. Monitoramento de indicadores de qualidade dos Sistemas de Informações sobre Mortalidade (SIM) e Nascidos Vivos (Sinasc), nos anos 2000, 2005 e 2010. In: Ministério da Saúde (BR). Secretaria de Vigilância em Saúde. Departamento de Análise de Situação de Saúde. Saúde Brasil 2011: uma análise da situação de saúde a vigilância da saúde da mulher. Brasília: Ministério da Saúde; 2012. p. 401–18.
4. Frias PG, Szwarcwald CL, Lira PIC. Avaliação dos sistemas de informações sobre nascidos vivos e óbitos no Brasil na década de 2000. Cad Saude Publica 2014 out;30(10):2068–80.
5. Szwarcwald CL, Morais Neto OL, Frias PG, Souza Júnior PRB, Escalante JJC, Lima RB, et al. Busca ativa de óbitos e nascimentos no Nordeste e na Amazônia Legal: estimação das coberturas do SIM e Sinasc nos municípios brasileiros. In: Ministério da Saúde (BR). Secretaria de Vigilância em Saúde. Departamento de Análise de Situação de Saúde. Saúde Brasil 2010: uma análise da situação de saúde e de evidências selecionadas de impacto de ações de vigilância em saúde. Brasília: Ministério da Saúde; 2011. p. 79–98. (Série G. Estatística e Informação em Saúde)
6. Szwarcwald CL, Frias PG, Souza Júnior PRB, Almeida WS, Morais Neto OL. Correction of vital statistics based on a proactive search of deaths and live births: evidence from a study of the North and Northeast regions of Brazil. Popul Health Metr. 2014 Jun;12:16.
7. Ministério da Saúde (BR). Departamento de Informática do SUS. Sistema de Informações de Nascidos Vivos [Internet]. Brasília: Ministério da Saúde; 2016 [citado 2016 Jul 12]. Disponível em: http://www2.datasus.gov.br/DATASUS/index. php?area=060702
8. Lechat MF, Dolk H. Registries of congenital anomalies: EUROCAT. Environ Health Perspect. 1993 Jul;101 Suppl 2:153–7.
9. Castilla EE, Orioli IM. ECLAMC: the Latin-American collaborative study of congenital malformations. Community Genet. 2004 Nov;7(2-3):76–94.
10. Castilla EE, Orioli IM, Luquetti DV, Dutra MG. Manual de preenchimento e de codificação de anomalias congênitas no campo 34 da DN (SINASC). Rio de Janeiro: Estudio Colaborativo Latino Americano de Malformaciones Congénitas; 2010.
11. Ministério da Saúde (BR). Secretaria de Vigilância em Saúde. Protocolo de vigilância e resposta à ocorrência de microcefalia e/ou alterações do sistema nervoso central (SNC)[Internet]. Brasília: Ministério da Saúde; 2016 [citado 2016 jul 12]. Disponível em: http://portalsaude.saude.gov.br/images/pdf/2016/ marco/10/microcefalia-protocolo-vigilancia-resposta-v2-10mar2016.pdf
12. The international fetal and newborn growth consortium for the 21st century. About Intergrowthst
[Internet]. Oxford:The international fetal and newborn growth consortium for the 21st century;
2016 [cited 2016 Jul 12]. Avaliable from: http:// intergrowth21.ndog.ox.ac.uk e https://intergrowth21. tghn.org/site_media/media/articles/newbornsize.pdf
13. Lopez-Camelo JS, Orioli IM, Castilla E. Resumo e conclusões dos documentos 1-5. [Internet]. Buenos Aires: Estudio Colaborativo Latino Americano de Malformaciones Congénitas;2015 [citado 2016 jul 12]. Disponível em: http://www.eclamc.org/ descargas/6.DocumentoECLAMCFinalV3.docx
14. Oliveira WK, Cortez-Escalante J, Oliveira WTGH, Carmo GMI, Henriques CMP, Coelho GE, et al. Increase in reported prevalence of microcephaly in infants born to women living in areas with confirmed Zika Virus transmission during the first trimester of pregnancy: Brazil, 2015. MMWR Morb Mortal Wkly Rep.2016 Mar;65(9):242-7
Received on 07/06/2016 Approved on 08/07/2016
mediacentre/news/statements/2016/1st-emergency-committee-zika/en/
16. Organização Mundial de Saúde (OMS).
Classificação Estatística Internacional de Doenças: CID-10. 8 ed. rev. ampl. São Paulo: Universidade de São Paulo; 2008.
17. Faria NR, Azevedo RSS, Kraemer MUG, Souza R, Cunha MS, Hill SC, et al. Zika virus in the Americas: early epidemiological and genetic findings. Science 2016 Mar;352(6283):345–9.
18. Gross SJ, Kosmetatos N, Grimes CT, Williams ML. Newborn head size and neurological status. Predictors of growth and development of low birth weight infants. Am J Dis Child. 1978 Aug;132(8):753–6.
19. Instituto Brasileiro de Geografia e Estatística. Pesquisa Nacional por Amostra de Domicílios Contínua. Ano 2015 [Internet]. Rio de Janeiro: Instituto Brasileiro de Geografia e Estatística; 2015 [citado 2016 jul 12]. Disponível em: http://www. ibge.gov.br/home/estatistica/pesquisas/anos_ anteriores_2015.shtm
20. Instituto Brasileiro de Geografia e Estatística. Banco de dados agregado[Internet]. Rio de Janeiro: Instituto Brasileiro de Geografia e Estatística; 2010 [citado 2016 jul 12]. Disponível em: http://www. sidra.ibge.gov.br/bda/popul/default.asp?t=3&z=t&o =25&u1=1&u2=1&u3=1&u4=1&u5=1&u6=1 (pop por cor-raça – censo demográfico amostra - 2010)
21. Sutherst RW. Global change and human vulnerability to vector-borne diseases. Clin Microbiol Rev.2004 Jan;17(1):136-73.
22. United Nations. Department of Economic and Social Affairs. Population Division.World urbanization prospects: the 2014 revision: highlights [Internet]. New York: United Nations; 2014 [cited 2016 Jul 12]. Avaliable from: http:// esa.un.org/unpd/wup/Publications/Files/WUP2014-Highlights.pdf
23. Barreto ML, Barral-Netto M, Stabeli R, Almeida-Filho N, Vasconcelos PFC, Teixeira M, et al. Zika virus and microcephaly in Brazil: a scientific agenda. Lancet.2016 Mar;387(10022):919-21
24. Kim MA, Yee NH, Choi JS, Choi JY, Seo K. Prevalence of birth defects in Korean livebirths, 2005-2006. J Korean Med Sci. 2012 Oct;27(10):1233–40.
25. Restrepo-Méndez MC, Lawlor DA, Horta BL, Matijasevich A, Santos IS, Menezes AM, et al. The association of maternal age with birthweight and gestational age: a cross-cohort comparison. Paediatr Perinat Epidemiol. 2015 Jan;29(1):31–40.
26. European Centre for Disease Prevention and Control. Rapid risk assessment: Zika virus disease epidemic: potential association with microcephaly and Guillain– Barré syndrome: third update, 23 February 2016 [Internet]. Stockholm: European Centre for Disease Prevention and Control; 2016 [cited 2016 Jul 12]. Available from: http://ecdc.europa.eu/en/publications/ Publications/zika-virus-rapid-risk-assessment-23-february-2016.pdf
27. Ministério da Saúde (BR). Secretaria de Vigilancia em Saude. Departamento de Vigilância Epidemiológica. Nota informativa nº 1/2015 – COES Microcefalias [Internet]. Brasília: Ministério da Saúde; 2015 [citado 2016 jul 07]. Disponível em: http://portalsaude.saude. gov.br/images/pdf/2015/novembro/18/microcefalia-nota-informativa-17nov2015-c.pdf
28. Victora CG, Schuler-Faccini L, Matijasevich A, Ribeiro E, Pessoa A, Barros FC. Microcephaly in Brazil: how to interpret reported numbers? Lancet 2016 Feb;387(10019):621–4.
29. Butler D. Zika vírus: Brazil’s surge in small-headed babies questionade by report. Nature. 2016 Feb;530(7588):13–4.