Aluísio J D BarrosI Alicia MatijasevichI Iná S SantosI Elaine P AlbernazII Cesar G VictoraI
I Programa de Pós-graduação em Epidemiologia. Universidade Federal de Pelotas. Pelotas, RS, Brasil
II Faculdade de Medicina. Universidade Católica de Pelotas. Pelotas, RS, Brasil Correspondence:
Aluísio J D Barros
Programa de Pós-graduação em Epidemiologia Universidade Federal de Pelotas
R. Mal. Deodoro, 1160 - 3º piso 96020-220 Pelotas, RS, Brasil E-mail: [email protected] Received: 3/7/2007
Reviewed: 9/3/2007 Approved: 9/6/2007
Neonatal mortality: description
and effect of hospital of birth
after risk adjustment
Mortalidade neonatal: descrição e
efeito do hospital de nascimento após
ajuste de risco
ABSTRACT
OBJECTIVE: To assess the effect of hospital of birth on neonatal mortality.
METHODS: A birth cohort study was carried out in Pelotas, Southern Brazil, in 2004. All hospital births were assessed by daily visits to all maternity hospitals and 4558 deliveries were included in the study. Mothers were interviewed regarding potential risk factors. Deaths were monitored through regular visits to hospitals, cemeteries and register offi ces. Two independent pediatricians established the underlying cause of death based on information obtained from medical records and home visits to parents. Logistic regression was used to estimate the effect of hospital of birth, controlling for confounders related to maternal and newborn characteristics, according to a conceptual model.
RESULTS: Neonatal mortality rate was 12.7‰ and it was highly infl uenced by birthweight, gestational age, and socioeconomic variables. Immaturity was responsible for 65% of neonatal deaths, followed by congenital anomalies, infections and intrapartum asphyxia. Adjusting for maternal characteristics, a three-fold increase in neonatal mortality was seen between similar complexity hospitals. The effect of hospital remained, though lower, after controlling for newborn characteristics.
CONCLUSIONS: Neonatal mortality was high, mainly related to immaturity, and varied signifi cantly across maternity hospitals. Further investigations comparing delivery care practices across hospitals are needed to better understand NMR variation and to develop strategies for neonatal mortality reduction.
KEY WORDS: Neonatal mortality (Public Health). Hospital services.
Over the second half of the 20th century, infant and child
mortality rates have improved signifi cantly in many
regions worldwide by reducing deaths due to diarrhea, pneumonia, vaccine-preventable infections and mala-ria. Nevertheless, most improvement has been due to lives saved after the fi rst four weeks of life. The World Health Organization (WHO) estimates that every year all over the world, but mainly in developing countries, four million children die within the fi rst 28 days of life, and almost two-thirds of them within the fi rst week, when the highest risk lies in the fi rst 24 hours after birth.25 The proportion of deaths in the neonatal period varies according to the overall infant mortality rate. In populations with infant mortality rates lower than 35 per 1,000 live births, more than 50% of child deaths are neonates.3 This is the situation in Brazil, where infant mortality rate has decreased over the last decades, reaching 27 per 1,000 live births in 2002. Meanwhile, the proportion of neonatal deaths has increased from
46.4% (1985–1987) to 59.2% (1995–1997).22
Globally, the major direct causes of neonatal deaths are infectious diseases, birth injury, congenital anomalies,
asphyxia and prematurity, while the relative importance of each one differ between and within countries.13 Neo-natal deaths are highly associated with maternal health throughout the lifecycle and are especially sensitive to critical periods such as pregnancy and childbirth.14
In order to reduce deaths of newborn babies in a spe-cifi c setting, policies need to integrate state-of-the-art knowledge with reliable information of local conditions and resources available. Causes of neonatal death and neonatal mortality rates (NMRs) in hospitals have to be identifi ed and compared so that the correct actions and interventions can be devised for each setting. These comparisons, to be valid, need to take into account the different populations attending each hospital.19
The main objective of the present study was to compare neonatal mortality rates across hospitals in the city of Pelotas, southern Brazil, controlling for all available potential confounders in order to verify whether diffe-rences in mortality between hospitals were due solely to clientele characteristics or to the hospitals studied.
INTRODUCTION
RESUMO
OBJETIVO: Avaliar o efeito de hospital de nascimento na ocorrência de mortalidade neonatal.
MÉTODOS: Uma coorte de nascimentos foi iniciada em Pelotas, em 2004. Todos os nascimentos hospitalares foram estudados em visitas diárias às maternidades da cidade, incluindo-se 4.558 recém-nascidos. As mães foram entrevistadas sobre fatores de risco em potencial e as mortes, monitoradas com visitas regulares aos hospitais, cemitérios e cartórios. Dois pediatras
classifi caram a causa básica da morte, de forma independente, a partir de
informações obtidas no prontuário hospitalar e em entrevista com a família. Usou-se regressão logística para estimar o efeito do hospital de nascimento, controlando para variáveis de confusão relacionadas a características maternas e do recém-nascido.
RESULTADOS: A taxa de mortalidade neonatal foi de 12,7‰. O risco esteve
fortemente infl uenciado pelo peso ao nascer, idade gestacional e variáveis
socioeconômicas. Imaturidade foi responsável por 65% das mortes neonatais, seguida por anomalias congênitas, infecções e asfi xia intraparto. Ajustando para características maternas, foi observado um risco relativo igual a três para hospitais de mesmo nível de complexidade. O risco relativo diminuiu, mas persistiu, após controle para características do recém-nascido.
CONCLUSÕES: A mortalidade neonatal variou entre hospitais e foi alta, principalmente relacionada à imaturidade. Para entender a fonte de variação da mortalidade neonatal e reduzir sua ocorrência é necessária uma avaliação aprofundada e comparativas com as práticas de cuidado entre hospitais.
METHODS
Pelotas is located in southern Brazil, with a popula-tion of 323,000 inhabitants, 93% of them living in the urban area (2000 Brazilian Demographic Census). High-quality data concerning the health of mothers and newborn babies were available through a birth-cohort study started in 2004. During the entire year of 2004, all births taking place in the city were recruited for the birth cohort study, excluding those mothers resident in other municipalities. More than 99% of all deliveries took place in hospitals. Births were identifi ed by daily visits to the fi ve maternity hospitals, with the mothers interviewed soon after delivery using a pre-tested structured questionnaire. Detailed information was obtained about demographic, socioeconomic, behavioral and biological characteristics, reproductive history and health care utilization. Newborns were measured (length, head and abdominal circumference) and examined to assess their gestational age through Dubowitz’s method in the fi rst 24 hours after birth.10 Birthweight was measured and recorded by hospital staff with electronic pediatric scales (1-g precision) that were regularly checked by the research team. All interviews and exams were carried out by nutrition graduates supervised by a pediatrician.
Postnatal mortality surveillance included regular vi-sits to hospitals, cemeteries, register offi ces and the Secretaria da Saúde do Município de Pelotas (local health Department). Information on the cause of death was obtained from pediatricians, medical records and interviews with relatives of the dead children during home visits. For deaths occurring out of the hospital or out of the city, information was obtained from death
certifi cates and complemented with information from
home visits. Two independent pediatricians were res-ponsible for determining the underlying cause of death after careful review of the available information. Deaths were grouped into the following causes according to the International Classifi cation of Diseases 10th revi-sion (ICD-10): immaturity (P07 and P22), congenital anomalies (Q00, Q39, Q79, and Q91), birth asphyxia (P20 and P21), pneumonia (J18.9), and other infections (P36 and P38).
Neonatal mortality was the outcome of interest, defi ned as the death of a live-born infant in the fi rst 28 days of life and expressed by the neonatal mortality rate (NMR, number of neonatal deaths per 1,000 live births). Early NMR refers to deaths occurring in the fi rst seven days of life (or children aged 0–6 days) and late NMR to those occurring from the eighth to the 28th days of life inclusive (or children aged 7–27 days).
Place of birth was defi ned as the hospital where the in-fant was delivered, irrespective of whether the newborn was transferred or not to another hospital after birth. There were fi ve maternity hospitals in the city and, in order to preserve their identity, they were coded A to
E. If the infant was delivered at home, in the street or in another setting not related to any of the maternity hospitals of the city, the place of birth was classifi ed as “out of hospital”. Deaths occurring at home were excluded from the analysis.
Family income in the month prior to delivery was ex-pressed as monthly minimum wages (MMW) (about US$ 80 in 2004). Women who were single, widowed, divorced, or lived without a partner were classifi ed as single mothers. Mother’s formal education was
categorized as: 0, 1–4, 5–8 and ≥9 complete school
years. Maternal age in complete years at delivery was categorized as <20, 20–34 and ≥35 years. Maternal skin color was classifi ed as white or black/mixed at the interviewer’s discretion.
Smoking habits during pregnancy were based on mater-nal report. Smokers were defi ned as those mothers who smoked at least one cigarette per day in any gestation trimester. Reproductive history included: parity (num-ber of previous viable pregnancies) categorized as 0, 1 and ≥2; previous low birthweight births and previous neonatal death, both coded as yes or no.
Maternal height and pre-pregnancy weight were ob-tained from prenatal records or, when not available, maternal recall. Pre-pregnancy body mass index (BMI) was calculated based on this information and categori-zed as <18.5, 18.5–20.9, 21.0–24.9, 25.0–29.9, and ≥30 kg/m2.24 Morbidity previous to and during pregnancy was based on maternal report, including pre-pregnancy chronic hypertension and diabetes, and gestational hypertension, diabetes and urinary tract infection.
Attendance to prenatal care was defi ned as at least
one pregnancy-related consultation at a health service during pregnancy. Route of delivery was categorized as vaginal or caesarean section. Delivery was also
classi-fi ed in terms of assistance: physician-assisted or other professional-assisted (i.e. nurse or medical student).
Gestational age was calculated using the fi rst day of the last normal menstrual period (LMP) or estimated by obstetric ultrasound obtained before 20 weeks of gestation when LMP was not reliable or not available. When both menstrual and ultrasound information were not available, the Dubowitz estimate of gestational age was used. Births with unknown gestational age or implausible birthweight for gestational age combina-tions accounted for 3.1% (N=140) of births and were excluded from the gestational age-specifi c analysis. Births with less than 37 weeks were classifi ed as pre-term, and neonates weighing less than 2500 g were classifi ed as low birthweight. First-minute Apgar score was categorized 0–3, 4–6 and ≥7.
infection. In the third level was included physician-as-sisted delivery, and in the fourth level were included low birthweight and fi rst-minute Apgar score.
Due to differential distribution of gestational age mis-sing data (14% of mismis-sing values among neonatal de-aths and 1% among survivors), gestational age was not included in the adjusted analysis. Interactions between birthweight and skin color, birthweight and hospital of birth and skin color and hospital of birth were explored. Stata 8 was used for all analyses.
The study protocol was approved by the Medical Re-search Ethics Committee of Faculdade de Medicina of Universidade Federal de Pelotas, and by the WHO. Written informed consent was obtained from all mo-thers prior to any data collection.
RESULTS
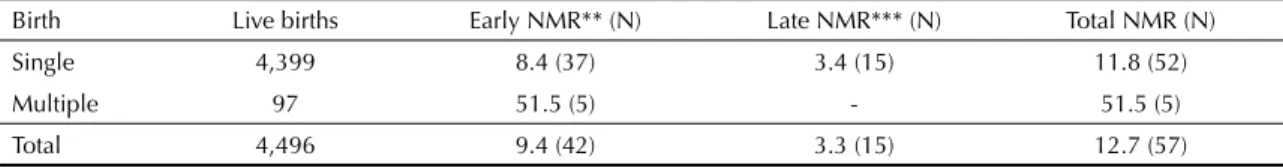
In 2004, 4,496 live births and 57 neonatal deaths were recorded, resulting in an overall NMR of 12.7‰. Nearly 74% (N=42) of all neonatal deaths occurred in the early neonatal period and 26% (N=15) in the late neonatal period. NMR for single, multiple and all births are shown in Table 1.
Complications of prematurity were, by far, the most common cause of neonatal mortality, associated with 37 (65%) deaths. They accounted for 71% and 47% of deaths in the early and late neonatal period, respec-tively. They were followed by congenital anomalies, accounting for seven deaths (12%). Birth asphyxia accounted for fi ve deaths (9%). There were fi ve deaths due to infections, three cases of pneumonia, one sepsis and one case of omphalitis. In three deaths (5%) only the cause of death was not identifi ed.
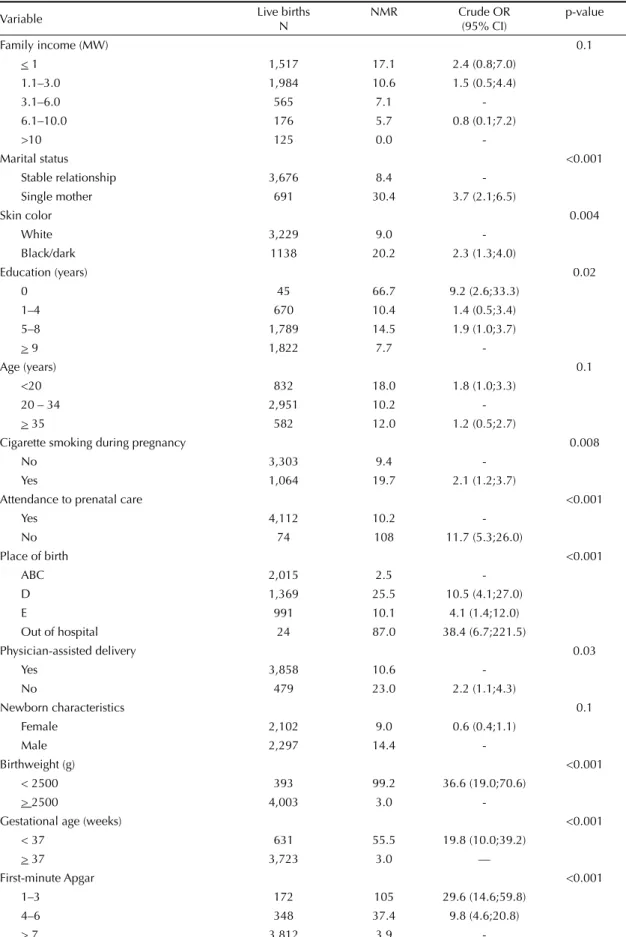
Table 2 shows NMR and crude odds ratios (OR) for neonatal mortality according to variables selected as po-tential confounders for the association between neonatal mortality and hospital of birth. None of the variables had more than 5% of missing values. The highest ORs were found for the most proximal variables: birthwei-ght, fi rst-minute Apgar and prematurity. Consistently with the assessment of cause of death, children less than 37 weeks of gestational age had a nearly 20-fold associated with both the outcome and the predictor of
interest, and not part of the causal chain.18 From all variables studied, the following were found not to act as confounders and were disregarded: pre-pregnancy BMI, parity, chronic hypertension, diabetes, previous neonatal death, previous low birthweight, all gestational morbidity and route of delivery.
Of the fi ve maternity hospitals studied in Pelotas, three lacked the facilities required for caring for infants with birth complications or premature infants (hospitals A, B and C). Hospitals A and B exclusively assisted births of private patients or those covered by private health insurance and Hospital C assisted both private patients and those using the Brazilian National Health System
(Sistema Único de Saúde – SUS). The three hospitals
assisted low-risk pregnancies and had low NMRs. Because of their similarities, they were grouped and used as a reference category in the analyses – thereaf-ter referred as hospitals ABC. Hospitals D and E had similar complexity and were equipped with neonatal semi-intensive and intensive care units and staffed by specialized pediatricians and surgeons. All births were
fi nanced by SUS in Hospital E, while this proportion was 85% in Hospital D.
Crude associations between neonatal mortality and hos-pital of birth and the remaining independent variables were explored using the Chi-square test. Multivariable analyses were carried out using logistic regression. The adjusted analysis was restricted to singleton births and hospital deliveries. The rationale of this analysis was to compare neonatal mortality between hospitals, adjusting for differences in the case mix of patients across them. Potential confounders of the association between hospital of birth and neonatal mortality were entered in the adjusted analysis, according to a hierar-chical conceptual model.21 A 5% standard signifi cance level was used but variables with a p-value ≤0.2 were retained in the model in order to control for residual confounding.
In the fi rst level of the conceptual model were inclu-ded the variables family income, maternal education, marital status, maternal skin color and age. In the second level were included cigarette smoking during pregnancy, attendance to prenatal care and urinary tract
Table 1. Live births, neonatal deaths and neonatal mortality rate* in the fi rst 28 days of life according to single or multiple births. Pelotas, Southern Brazil, 2004.
Birth Live births Early NMR** (N) Late NMR*** (N) Total NMR (N)
Single 4,399 8.4 (37) 3.4 (15) 11.8 (52)
Multiple 97 51.5 (5) - 51.5 (5)
Total 4,496 9.4 (42) 3.3 (15) 12.7 (57)
* Neonatal mortality rates (NMR) in deaths per 1,000 live births ** Deaths occurring in the fi rst 7 days of life
Table 2. Live births, neonatal mortality rate (per 1,000 live births) and crude odds ratios for neonatal mortality of singleton births, according to potential confounders for hospital of birth. Pelotas, Southern Brazil, 2004. (N=4,399)
Variable Live births
N
NMR Crude OR
(95% CI)
p-value
Family income (MW) 0.1
< 1 1,517 17.1 2.4 (0.8;7.0)
1.1–3.0 1,984 10.6 1.5 (0.5;4.4)
3.1–6.0 565 7.1
-6.1–10.0 176 5.7 0.8 (0.1;7.2)
>10 125 0.0
-Marital status <0.001
Stable relationship 3,676 8.4
-Single mother 691 30.4 3.7 (2.1;6.5)
Skin color 0.004
White 3,229 9.0
-Black/dark 1138 20.2 2.3 (1.3;4.0)
Education (years) 0.02
0 45 66.7 9.2 (2.6;33.3)
1–4 670 10.4 1.4 (0.5;3.4)
5–8 1,789 14.5 1.9 (1.0;3.7)
> 9 1,822 7.7
-Age (years) 0.1
<20 832 18.0 1.8 (1.0;3.3)
20 – 34 2,951 10.2
-> 35 582 12.0 1.2 (0.5;2.7)
Cigarette smoking during pregnancy 0.008
No 3,303 9.4
-Yes 1,064 19.7 2.1 (1.2;3.7)
Attendance to prenatal care <0.001
Yes 4,112 10.2
-No 74 108 11.7 (5.3;26.0)
Place of birth <0.001
ABC 2,015 2.5
-D 1,369 25.5 10.5 (4.1;27.0)
E 991 10.1 4.1 (1.4;12.0)
Out of hospital 24 87.0 38.4 (6.7;221.5)
Physician-assisted delivery 0.03
Yes 3,858 10.6
-No 479 23.0 2.2 (1.1;4.3)
Newborn characteristics 0.1
Female 2,102 9.0 0.6 (0.4;1.1)
Male 2,297 14.4
-Birthweight (g) <0.001
< 2500 393 99.2 36.6 (19.0;70.6)
> 2500 4,003 3.0
-Gestational age (weeks) <0.001
< 37 631 55.5 19.8 (10.0;39.2)
> 37 3,723 3.0 —
First-minute Apgar <0.001
1–3 172 105 29.6 (14.6;59.8)
4–6 348 37.4 9.8 (4.6;20.8)
> 7 3,812 3.9
increase in the risk of mortality, and children born with low birthweight were 36 times more likely to die. Other situations strongly associated with neonatal mortality were being a single mother, black or dark skin color, and not attending prenatal care.
Maternal and newborn characteristics were unevenly distributed across maternity hospitals. Women who gave birth at hospitals D and E had lower family inco-me, fewer years of education, were more often black or dark skin color, and had higher rates of previous low birth weight and pregnancy-related diseases than those women assisted in hospitals ABC. On the other hand, women assisted in hospitals ABC had higher rates of deliveries not attended by a physician (14%) compared with those from hospitals D and E (9.7% and 4.7%, respectively). Hospital D had higher rates of low birth weight (14.6%), newborns with any neonatal depression (Apgar score at the fi rst-minute <7 = 15.8%) and preterm birth (19.0%) than hospitals ABC and E (4.6 and 9.7%; 9.3% and 12.5%; 9.5% and 15.6%, respectively).
In the crude analysis there was a strong association between hospital of birth and neonatal mortality (Ta-ble 2). NMR was 2.5‰ in hospitals ABC, which did not provide care to high-risk pregnancies, but it was four times higher in hospital E and ten times higher in hospital D. The few children born out of hospital had a NMR of 87‰.
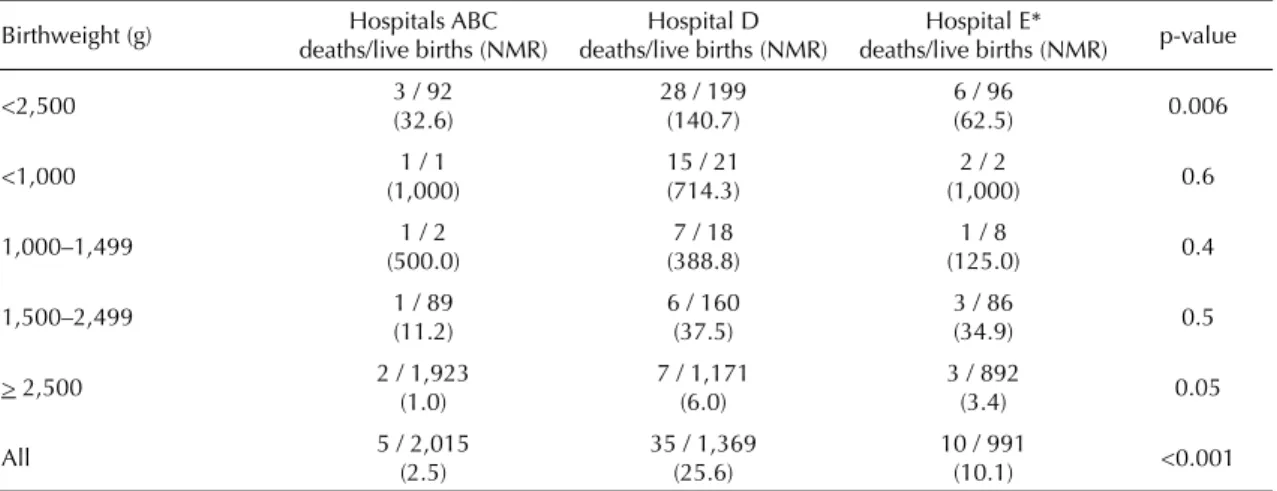
Neonatal deaths, live births and NMRs stratifi ed by birth weight and hospital of birth are shown in Table 3. The highest NMR for normal birth weight newborns was seen in Hospital D, followed by hospitals E and ABC (p=0.05). The same pattern was seen for low birth weight infants (p=0.006), although with higher NMR. The analysis of NMR by hospital and categories of low birth weight did not show any statistically signifi cant differences, probably due to very low number of deaths in each group.
In the adjusted analysis (Table 4) after controlling for confounders, hospital of birth had the magnitude of its association with neonatal mortality strongly reduced,
Table 4. Adjusted analysis for neonatal death in singleton births. Pelotas, Southern Brazil, 2004. (N=4,375)
Hospital of birth Adjusted OR (95% CI)
p-value
Model 1* <0.001
Hospitals ABC
-Hospital D 9.6 (3.7; 24.7)
Hospital E 3.5 (1.2; 10.6)
Model 2** <0.001
Hospitals ABC
-Hospital D 9.4 (3.6; 24.3)
Hospital E 2.8 (0.9; 9.0)
Model 3*** <0.001
Hospitals ABC
-Hospital D 9.9 (3.8; 25.9)
Hospital E 3.2 (1.0; 10.2)
Model 4**** 0.03
Hospitals ABC
-Hospital D 3.7 (1.3; 10.7)
Hospital E 1.7 (0.5; 6.4)
* Adjusted for maternal education, marital status and skin color (Level 1)
** Adjusted for Level 1 + Level 2 variables (cigarette smoking during pregnancy and attendance to prenatal care)
*** Adjusted for Level 1 + Level 2 + physician-assisted delivery (Level 3)
**** Adjusted for Level 1 + Level 2 + Level 3 + Level 4 (LBW and 1st-minute Apgar) variables
Table 3. Neonatal deaths, live births and neonatal mortality rate (per 1,000 live births) of singleton births according to birthweight and hospital of birth. Pelotas, Southern Brazil, 2004. (N=4,375)
Birthweight (g) Hospitals ABC deaths/live births (NMR)
Hospital D deaths/live births (NMR)
Hospital E*
deaths/live births (NMR) p-value
<2,500 3 / 92
(32.6)
28 / 199 (140.7)
6 / 96
(62.5) 0.006
<1,000 1 / 1
(1,000)
15 / 21 (714.3)
2 / 2
(1,000) 0.6
1,000–1,499 1 / 2
(500.0)
7 / 18 (388.8)
1 / 8
(125.0) 0.4
1,500–2,499 1 / 89
(11.2)
6 / 160 (37.5)
3 / 86
(34.9) 0.5
> 2,500 2 / 1,923
(1.0)
7 / 1,171 (6.0)
3 / 892
(3.4) 0.05
All 5 / 2,015
(2.5)
35 / 1,369 (25.6)
10 / 991
(10.1) <0.001
but remained signifi cant. Table 4 shows the importance of confounding in this analysis, with a reduction of ORs for hospital D from 25.5 in the crude analysis to 3.7 as more explanatory variables were included in the model. Similarly, ORs for hospital E reduced from 10.1 to 1.7. However, even after controlling for all potential confounders available, hospital of birth remained sta-tistically associated with NMR, suggesting that its cha-racteristics – such as equipment or medical care – may play a role in neonatal mortality. None of the interactions tested were signifi cant in the adjusted analysis.
DISCUSSION
NMR of 12.7‰ live births found during the year of 2004 ranks the city of Pelotas in an intermediate posi-tion not only among other Brazilian regions but also in the international scenario. The city showed lower NMR than the average rate reported in Brazil in the year 2000 (18.1‰)a but higher than the average rate in the state of Rio Grande do Sul (9.5‰).
In the international scenario, NMR of the city of Pelotas is below the estimated NMR for overall countries for the year 2000 (30‰), and very close to the average rate reported in the Americas, of 12‰. It has, however, a NMR that is about 3 times higher than that for
high-income countries (4‰).b
The distribution of causes of neonatal death was con-sistent with the distribution estimated by WHO using data from 45 vital registration systems and studies of 29 countries.13 Similar to that found in countries with an NMR <15‰, the majority of deaths was due to preterm-related complications followed by congenital anomalies, infection and asphyxia, while tetanus and diarrhea were non-existent causes of neonatal death in the city.
Although infant mortality rates in developing countries have declined signifi cantly in the past two to three deca-des, NMR has remained relatively constant.8 In Pelotas, between 1982 and 1993, NMR decreased by nearly 30%, from 20.0‰ in 1982 to 14.3‰ in 1993. Howe-ver, in the following eleven-year period (1993–2004), NMR decreased by only 11%, to 12.7‰.1,2,20 In spite of major changes in health systems over the past decade that have ensured free universal health care, improved delivery care and expanded neonatal intensive care, an increase in both low birth weight and preterm neonates have conspired to keep infant mortality rates practically
unchanged.2 Finding ways to break this deadlock is
essential to ensure another cycle of reduction in infant mortality rates.
In this context, exploring differences between maternity hospitals is a way to assess whether local or specifi c characteristics of hospitals are playing an important role in keeping infant mortality high. If no differences were found, it may be more likely that macro level policies would be a better approach to try reducing mortality rates.
As expected, differences between hospitals were large in the crude analysis. The same has been shown in di-fferent country settings.19 This fi nding clearly refl ects the different clientele seeking or being referred to each facility. The choice of hospital was largely determined by fi nancing mode, mainly health insurance coverage, and availability of beds for SUS patients. High-risk pregnant women may have been advised to seek either hospital D or E but at the time of the study there was no organized referral system implemented in the city.
In the fi rst step, ORs for hospitals were signifi cantly reduced after socioeconomic variables were included (level 1). The addition of level 2 and 3 variables – smoking, prenatal care and physician-assisted de-livery – did not change considerably the results for hospitals. And fi nally, the inclusion of indicators of low birth weight and low fi rst-minute Apgar again had an important impact on the ORs of interest, further reducing them.
When all confounders related to the mother and her pregnancy were adjusted for (levels 1 and 2), diffe-rences found between hospitals were still rather large. That is, such adjustment was not enough to equalize risks across hospitals, suggesting that, at least partially, risk differences found are due to differences in the effectiveness or appropriateness of perinatal care, ina-dequate capacity to intervene prior to or during labor, or immediately after birth.11
Adjustment for low birth weight and fi rst-minute Apgar led to a reduction in ORs associated with hospital of birth suggesting that, conditional on the newborn cha-racteristics, hospitals differences are not so large. But still one of them showed higher risk of mortality.
Although these findings need be interpreted with caution, they may suggest that medical handling of deliveries is a major source of variation between hos-pitals. Then, given the newborn conditions, differences between hospitals become smaller, indicating that new-born care has results that are somewhat more similar between hospitals.
Neonatal mortality is a measure of perinatal outcome and refl ects the quality of both obstetric and neonatal care. But like all outcomes, it also depends on risk
a Ministério da Saúde. Mortalidade neonatal precoce e tardia no Brasil e por Estado: 1997-2000 [Access on 9/21/2005]. Available from: http:// tabnet.datasus.gov.br/cgi/idb2002/matriz.htm#mort
and chance. The present study adjusted for differences in individual risks that were not under practitioners’ control in each hospital of birth and the statistical techniques used reduced misinterpretation due to random fl uctuations in the results. The study has the advantage of including all live births in the city over the study period, thus avoiding differences in accuracy of ascertainment and completeness of registration of live birth infants between hospitals. However, it lacked a more precise assessment of gestational risk as well as a better measure of illness severity at birth than birth weight alone, which is known to predict mortality risk less accurately than well-known score systems in the literature.4,17 Therefore, residual confounding cannot be totally ruled out as an alternative explanation for hospital differences.
Other limitations of the present study relate to the lack of information about possible patient transfer from one hospital to another and congenital anomalies. Patient transfer may involve bias if children born in one hos-pital died in another one due to the conditions in the latter. The most common cause for newborn hospital transfer is the need for intensive care so it would be expected increased mortality rates in hospitals without neonatal intensive care units. But the study results showed the opposite suggesting non-occurrence of this bias. Mothers pregnant with a malformed fetus may have been referred preferentially to either hospital D or E, despite the lack of an organized referral system
in the city. Given that most of these cases have high fatality rates, this could have infl ated the mortality rate in a given hospital.
Wennberg et al23 showed that variations over small geo-graphic areas can be used to study the relative effective-ness of different medical practices and technologies and to provide insights as to how to improve medical care. Previous studies in Brazil showed evidence of structural defi ciencies in hospitals and professional skill-related problems which contributed to low quality care during labor and delivery.5,6,9 In addition, some studies also showed low rates of prenatal corticosteroid therapy utilization in preterm labor,12,15 even though scientifi c evidence has proven that prenatal corticosteroids reduce the incidence of respiratory distress syndrome by more than 50% in babies born before 34 weeks gestation, thus reducing morbidity and mortality.7,16 The present study fi ndings suggest that hospital procedures towards delivery should be carefully investigated as an impor-tant source of variability between hospitals with a good prospect of reducing infant mortality.
1. Barros FC, Victora CG, Vaughan JP, Teixeira AMB, Ashworth A. Infant mortality in southern Brazil: a population based study of causes of death. Arch Dis
Child. 1987;62(5):487-90.
2. Barros FC, Victora CG, Barros AJ, Santos IS, Albernaz E, et al. The challenge of reducing neonatal mortality in middle-income countries: fi ndings from three Brazilian birth cohorts in 1982, 1993 and 2004. Lancet.
2005;365(9462):847-54.
3. Black RE, Morris SS, Bryce J. Where and why are 10 million children dying every year? Lancet.
2003;361(9376):2226-34.
4. Brito ASJ, Matsuo T, Gonzalez MRC, Carvalho ABR, Ferrari LSL. CRIB score, birth weight and gestational age in neonatal mortality risk evaluation. Rev Saude
Publica. 2003;37(5):597-602.
5. Caldeira AP, França E, Perpetuo IHO, Goulart EMA. Trends in avoidable causes of infant mortality in Belo Horizonte, Brazil, 1984 to 1998. Rev Saude Publica.
2005;39(1):67-74.
6. Costa JO, Xavier CC, Proietti FA, Delgado MS. Evaluation of hospital resources for perinatal assistance in Brazil. Rev Saude Publica. 2004;38(5):701-8.
7. Roberts D, Dalziel S. Antenatal corticosteroids for accelerating fetal lung maturation for women at risk of preterm birth. Cochrane Database Syst Rev. 2006;3: CD004454.
8. Darmstadt GL, Lawn JE, Costello A. Advancing the state of the world’s newborns. Bull World Health
Organ. 2003;81(3):224-5.
9. Silva AAM, Coimbra LC, Silva RA, Alves MTSSB, Lamy Filho F, Lamy ZC, et al. Perinatal health and mother-child heath care in the municipality of São Luis, Maranhão State, Brazil. Cad Saude Publica.
2001;17(6):1413-23.
10. Dubowitz LM, Dubowitz V, Goldberg C. Clinical assessment of gestational age in the newborn infant. J
Pediatr. 1970;77(1):1-10.
11. Horbar JD, Lucey JF. Evaluation of neonatal intensive care technologies. Future Child 1995;5(1):139-61.
12. Silva LK, Costa TP, Reis AF, Iamada NO, Azevedo AP, Alburquerque CP. Avaliação da qualidade da assistência hospitalar obstétrica: uso de corticóides no trabalho de parto prematuro. Cad Saude Publica.
1999;15(4):817-29.
13. Lawn JE, Cousens S, Zupan J, Lancet Neonatal Survival
Steering Team. 4 million neonatal deaths: When? Where? Why? Lancet. 2005;365(9462):891-900.
14. Martines J, Paul VK, Bhutta ZA, Koblinsky M, Soucat A, Walker N, et al. Neonatal survival: a call for action.
Lancet. 2005;365(9645):1189-97.
15. Rede Brasileira de Pesquisas Neonatais. Antenatal corticosteroid use and clinical evolution of preterm newborn infants. J Pediatr (Rio J). 2004;80(4):277-84.
16. Rennie JM, Wheater M, Cole TJ. Antenatal steroid administration is associated with an improved chance of intact survival in preterm infants. Eur J Pediatr.
1996;155(7):576-9.
17. Richardson DK, Corcoran JD, Escobar GJ, Lee SK. SNAP-II and SNAPPE-II: simplifi ed newborn illness severity and mortality risk scores. J Pediatr. 2001;138(1):92-100.
18. Rothman KJ, Greenland S [editors]. Modern epidemiology. 2. ed. Philadelphia: Lippincott-Raven; 1998. Precision and validity in epidemiologic studies; p.115-34.
19. Sankaran K, Chien LY, Walker R, Seshia M, Ohlsson A, Canadian Neonatal Network. Variations in mortality rates among Canadian neonatal intensive care units.
CMAJ. 2002;166(2):173-8.
20. Victora CG, Barros FC, Halpern R, Menezes AMB, Horta BL, Tomasi E, et al. Estudo longitudinal da população materno-infantil da região urbana do Sul do Brasil, 1993: aspectos metodológicos e resultados preliminares. Rev Saude Publica. 1996;30(1):34-45.
21. Victora CG, Huttly SR, Fuchs SC, Olinto MT. The role of conceptual frameworks in epidemiological analysis: a hierarchical approach. Int J Epidemiol.
1997;26(1):224-7.
22. Victora CG, Barros FC. Infant mortality due to perinatal causes in Brazil: trends, regional patterns and possible interventions. Sao Paulo Med J. 2001;119(1):33-42.
23. Wennberg JE, Blowers L, Parker R, Gittelsohn AM. Changes in tonsillectomy rates associated with feedback and review. Pediatrics. 1977;59(6):821-6.
24. World Health Organization. Obesity: preventing and managing the global epidemic. In: Report of WHO Consultation on Obesity; 1998; Geneva. Geneva; 1998.
25. Zupan J, Aahman E. Perinatal mortality for the year 2000: estimates developed by WHO. Geneva: World Health Organization; 2005.
REFERENCES