Giselle Firmino Torres de SOUSA(a)
Angelo Giuseppe RONCALLI(a)
(a) Universidade Federal do Rio Grande do Norte – UFRN, Post-Graduate Collective Health Program, Natal, RN, Brazil
Orofacial clefts in Brazil and surgical
rehabilitation under the Brazilian
National Health System
Abstract: The objective of this study was to investigate the prevalence of live births with orofacial clefts in Brazil from 2009 to 2013, according to Brazil’s federative units and regions, and correlate it with the number of corrective surgery procedures for cleft lip and palate performed through the Brazilian National Health System in the same period. The data were collected from the National Live Birth System (SINASC in Portuguese) and the Hospital Information System (SIH-SUS in Portuguese). The results showed that the average prevalence of oral clefts in the period was 5.86 per 10,000 live births, with differences observed between the federative units and the regions. The correlation between the prevalence of orofacial clefts and the number of medical procedures associated with this anomaly was
statistically signiicant (r=0.94; p <0.001). This result indicates that greater
investments are being made in areas with a higher number of cases. The relationship between supply and demand for corrective surgeries suggests that only 18.91% of the live births with orofacial clefts in this period may have received this service under the Brazilian National Health System.
Keywords: Cleft Lip; Cleft Palate; Epidemiology; Health Services.
Introduction
Orofacial clefts (OFCs), including cleft lip (CL), cleft palate (CP), and cleft lip and palate (CLP), are the most common birth defects in the
craniofacial region. They may be found isolated or as part of a syndrome.1
Their etiology is complex and involves several genetic and environmental factors.2 The prevalence of this malformation varies according to geographic region, ethnic and racial group, environmental exposure and socioeconomic
status, and may range between 1:700 and 1:2500 live births.1,3
In addition to aesthetic deformation, orofacial cleft patients may
experience signiicant functional changes, which include maxillofacial
growth restriction, dental alterations, disturbances in speech, swallowing
and feeding dificulties, recurrent ear infections and hearing loss.4,5,6,7
These changes affect the health and quality of life of individuals with orofacial clefts and their families.8
The great clinical variety of OFCs, together with their many degrees of severity and possible association with other syndromes or birth defects, results in different treatment protocols. In general, rehabilitation is a long process that includes clinical and surgical care. The treatment begins
Declaration of Interests: The authors certify that they have no commercial or associative interest that represents a conflict of interest in connection with the manuscript.
Corresponding Author: Giselle Firmino Torres de Sousa E-mail: [email protected]
http://doi.org/10.1590/1807-3107BOR-2017.vol31.0023
Submitted: May 4, 2016
with the surgical repair of the malformation, and often requires multiple surgeries.4,9
Healthcare costs for cleft rehabilitation are usually
high. On the other hand, if these deiciencies are not
adequately addressed, they may lead to emotional disorders, social exclusion and unemployment, which may impact the individual, their families and society, in addition to losses caused by the morbidity itself.3,9 Moreover, complications related to feeding problems and ear infections in children affected by orofacial
clefts may result in signiicantly greater morbidity and
infant mortality rates in developing countries. However, these are countries where the barriers to obtaining rehabilitation treatment are more pronounced.3,10,11
In Brazil, the healthcare offered to people with craniofacial anomalies is predominantly publicfunded, and the geographic distribution of the health facilities for this type of procedure is poorly distributed, with greater concentration in the wealthiest region of Brazil, the Southeast. Thus, patients in many other locations require traveling long distances to gain access to treatment.12
Geography is a key element in the organization of
public health systems.13 Knowing the prevalence of
patients with orofacial clefts per region can help reduce the inequality in obtaining treatment. Rodrigues et al.13 and, more recently, Abreu et al.,15 used data from the National Live Birth System (SINASC) to estimate the prevalence of live births with orofacial clefts, considering Brazil’s different geographic regions as the units of analysis.
This study aimed at investigating the prevalence of live births with orofacial clefts in Brazil from 2009 to 2013, taking into account their distribution by geographic region and federative units (Brazilian states). It also aimed at analyzing the public expenditures and hospital authorization forms approved by the Brazilian National Health System for treatment of cleft lip and/or palate. The correlation of these data may indicate how the management of public funds for treating these patients is being carried out.
Methodology
An ecological study was conducted to evaluate the occurrence of orofacial clefts in Brazil, and the
relationship of this malformation with the number of hospital authorization forms approved for cleft lip and/or palate treatment under the Brazilian National Health System. The study was carried out between 2009 and 2013. The analysis units included Brazil’s regions (North, Northeast, Southeast, South and Center-West) and federative units (states). The data were collected from the National System of Live Births (SINASC in Portuguese) and the Hospital Information System (SIH-SUS) under the Ministry of Health.
The SINASC provided data on the number of live births versus live births with orofacial clefts, by the mother’s place of residence, between January 1, 2009 and December 31, 2013. The presence of orofacial
cleft was identiied in the database by codes Q35 (cleft palate), Q36 (cleft lip) and Q37 (cleft lip
with cleft palate). These codes correspond to the description of congenital anomaly, according to
the 10th edition of the International Classiication
of Diseases (ICD10), and are available in the Declaration of Live Births, the main document of the SINASC. This is a standard document put
out by the Ministry of Health, illed out by health
professionals nationwide for children born in hospitals or at home, and required for their civil
registration.16 The document includes a number
of data on the mothers, prenatal information,
childbirths and newborns.17
The number of hospital procedures for treating cleft lip and/or palate by location of residence in the same period (1/1/2009 – 12/31/2013) was obtained from the Hospital Information System (SIH-SUS), based on the approved Authorization Forms for Hospital Admittance (AIH) for such procedures, according to region, federative unit and year.
After data collection, the prevalence of oral cleft rates was calculated for the entire country, the regions and the federative units, for each year and for the
ive-year period of the study. This rate was calculated
by dividing the number of liveborn children with orofacial clefts according to the mother’s residence, by the total live births in the same year and location, and then multiplying by 10,000.
Veriication of the proportion of patients with
lip and/or palate under the Brazilian National Health System in each of the regions and federative units of residence was done by obtaining a rate calculated by dividing the number of approved AIHs for treatment procedures of cleft lip and/or palate according to place of residence, by the number of live births with orofacial cleft, in the region and federative unit, and in the respective year, and then multiplying the value by 100.
The statistical analysis that evaluated the correlation between the number of live births with orofacial clefts and the number of surgical procedures for orofacial clefts in Brazil, by place of hospitalization, was
performed using Pearson’s correlation coeficient. All the analyses were performed using Microsoft Excel
version 16 and SPSS (Statistical Package for Social Sciences), version 22.
Results
According to SINASC data from January 2009
to December 2013, 14,446,425 children were born alive in Brazil, among which 7,642 had some type
of orofacial cleft. These data indicate an average prevalence of 5.86 per 10,000 births, or a new case of orofacial cleft every 1,893 births in Brazil during the study period.
Regarding the type of issure, 2,378 had cleft lip,
representing 31.1% of the total number affected, 2,931
had isolated cleft palate, representing 38.4% of this
total, and 2,333 of the affected children had cleft lip and palate, representing 30.5% of the total number.
Cleft palate was the most frequent issure type in all
geographical regions throughout the study period. The average prevalence by type of orofacial cleft of live births in Brazil, and by geographical region is shown in Figure 1.
The South had the highest prevalence rates throughout the study period, whereas the Northeast had the lowest rates. The trend of livebirth prevalence rates with orofacial clefts in Brazil and its regions between 2009 and 2013 is depicted in Figure 2.
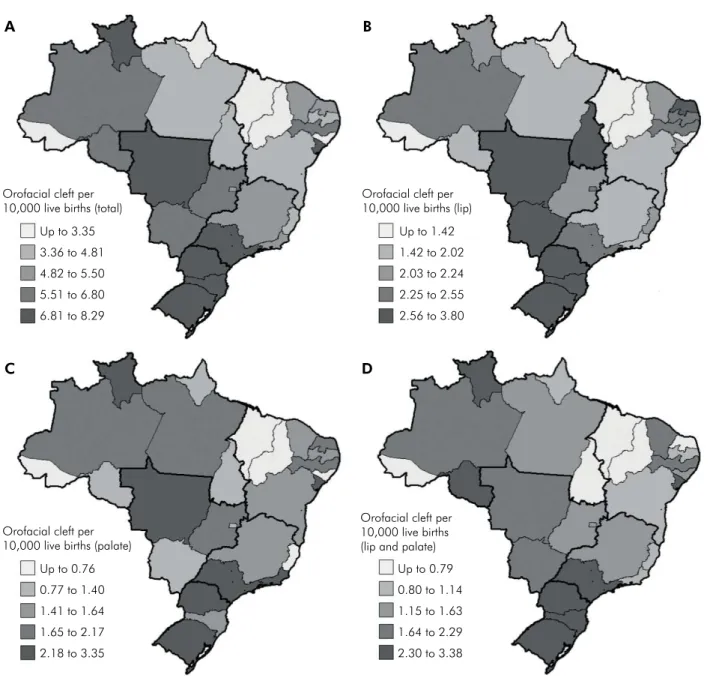
The distribution of oral cleft prevalence rates among the federative units showed wide disparities, considering that the highest rate was recorded in Rio Grande do Sul (8.29 per 10,000), whereas the
lowest rate was observed in Acre (2.1 per 10,000). The states of Acre, Alagoas, Amapá, Maranhão and Piauí had rates below the national average. The geog raphical distribution of the overall prevalence rates by cleft type in the federative units is illustrated in Figure 3.
Data obtained from the Hospital Information
System (SIH-SUS) indicated a total of 1,445 approved
Authorization Forms for Hospital Admittance (AIHs) for hospital procedures to treat cleft lip
North
Q35 Palate Cleft Q36 Lip Cleft Q37 Lip and Palate Cleft
Northeast Souteast South Center-West Brazil
1.83 1.92 2.26 3.17 2.40 2.25
1.76 1.39
2.03
2.19
1.82 1.82
1.61
1.24
1.88
2.88
1.80 1.79
5.20
4.55
6.18
8.23
6.02 5.86
0.0 8.0
7.0
6.0
5.0
4.0
3.0
2.0
1.0 9.0
Figure 1. Orofacial cleft prevalence per 10,000 live births, according to region and type of malformation, in Brazil from 2009 to 2013.
2009 2010 2011 2012 2013
North South
Northeast Center-West
Southeast Brazil 3.0
2.0 4.0 5.0 6.0 7.0 8.0 9.0
and/or palate between 2009 and 2013. The amount of public funds used in the surgical treatment of
orofacial clefts in this period was BRL 2,315,893.34
(USD 670,738.29). There was an increase in the number of AIHs, as well as in the public health funds for these procedures, in all regions of Brazil
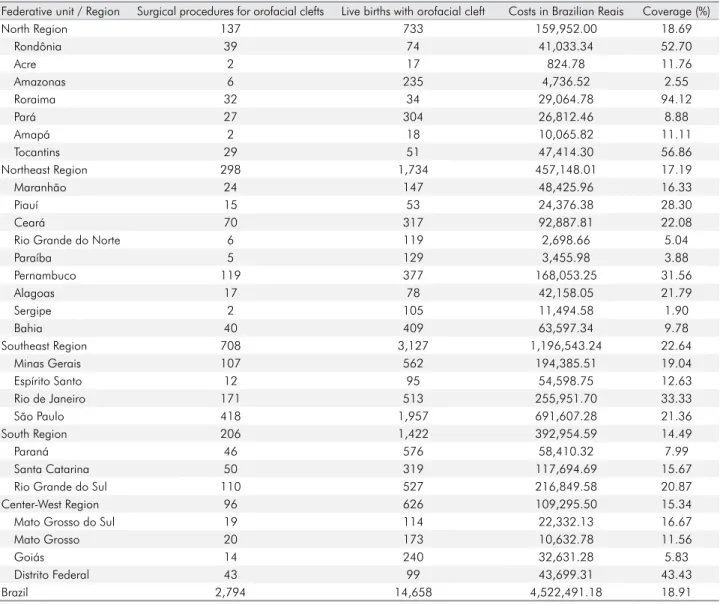
over this period (Figure 4). Table 1 shows the
geographic distribution of orofacial cleft cases, the total number of cleft lip and/or palate procedures,
the costs and the coverage for these procedures
over the ive years of the study.
The distribution of the procedures among the federative units was very unequal. Whereas some states, like Acre, Amapá and Sergipe, approved
only two AIHs over the ive-year period, the state
of São Paulo, the most populous state in Brazil,
approved 418 hospital procedures for orofacial
cleft treatment.
Figure 3. Spatial distribution of orofacial cleft prevalence per 10,000 live births in Brazil from 2009 to 2013. Orofacial cleft per
10,000 live births (total)
Up to 3.35
3.36 to 4.81
4.82 to 5.50
5.51 to 6.80
6.81 to 8.29
Orofacial cleft per 10,000 live births (lip)
Up to 1.42
1.42 to 2.02
2.03 to 2.24
2.25 to 2.55
2.56 to 3.80
Orofacial cleft per 10,000 live births (palate)
Up to 0.76
0.77 to 1.40
1.41 to 1.64
1.65 to 2.17
2.18 to 3.35
Orofacial cleft per 10,000 live births (lip and palate)
Up to 0.79
0.80 to 1.14
1.15 to 1.63
1.64 to 2.29
2.30 to 3.38
A B
The relationship between the number of children born with orofacial clefts and the number of hospital procedures indicated that only 18.9% of the orofacial cleft cases had a corresponding AIH during the study period. The Southeast had the most favorable proportion (total of 22.6%), whereas
the South had the worst relationship (14.49%).
The correlation between the number of live bi rths with orofacial clefts a nd the number o f h o s p it a l p r o c e du r e s fo r t r e at i n g t h e s e
malformations was very high (r=0.94) and statistically significant (p < 0.001). Figure 5 shows
this relationship for the Brazilian federative units, according to region.
2009
2 2
2010 2011 2012 2013
352
302
252
202
152
102
52 402
100.002 600.002
500.002
400.002
300.002
200.002 700.002
Number of AIH
Costs
Source: SIH.
Figure 4. Number of Authorization Forms for Hospital Admittance and costs for surgical procedures for orofacial clefts in Brazil, between 2009 and 2013.
Table 1. Distribution of cases of orofacial cleft, surgical procedures, costs and coverage of surgical procedures in Brazil, 2009-2013. Source: SINASC and SIH.
Federative unit / Region Surgical procedures for orofacial clefts Live births with orofacial cleft Costs in Brazilian Reais Coverage (%)
North Region 137 733 159,952.00 18.69
Rondônia 39 74 41,033.34 52.70
Acre 2 17 824.78 11.76
Amazonas 6 235 4,736.52 2.55
Roraima 32 34 29,064.78 94.12
Pará 27 304 26,812.46 8.88
Amapá 2 18 10,065.82 11.11
Tocantins 29 51 47,414.30 56.86
Northeast Region 298 1,734 457,148.01 17.19
Maranhão 24 147 48,425.96 16.33
Piauí 15 53 24,376.38 28.30
Ceará 70 317 92,887.81 22.08
Rio Grande do Norte 6 119 2,698.66 5.04
Paraíba 5 129 3,455.98 3.88
Pernambuco 119 377 168,053.25 31.56
Alagoas 17 78 42,158.05 21.79
Sergipe 2 105 11,494.58 1.90
Bahia 40 409 63,597.34 9.78
Southeast Region 708 3,127 1,196,543.24 22.64
Minas Gerais 107 562 194,385.51 19.04
Espírito Santo 12 95 54,598.75 12.63
Rio de Janeiro 171 513 255,951.70 33.33
São Paulo 418 1,957 691,607.28 21.36
South Region 206 1,422 392,954.59 14.49
Paraná 46 576 58,410.32 7.99
Santa Catarina 50 319 117,694.69 15.67
Rio Grande do Sul 110 527 216,849.58 20.87
Center-West Region 96 626 109,295.50 15.34
Mato Grosso do Sul 19 114 22,332.13 16.67
Mato Grosso 20 173 10,632.78 11.56
Goiás 14 240 32,631.28 5.83
Distrito Federal 43 99 43,699.31 43.43
Discussion
This study showed that the prevalence of live births with oral clefts in Brazil from 2009 to 2013 was 5.86 per 10,000 born alive, with differences between the federative units and the regions. Cleft palate is the most common type of orofacial cleft in all the Brazilian regions. The number of procedures and the amount of funds invested to treat this malformation were higher in areas of high orofacial cleft prevalence. Fewer than 20% of the children born with orofacial clefts in this period in Brazil underwent cleft lip and/or palate treatment under the Brazilian National Health System. The Southeast had the best coverage for this procedure.
The frequency and pattern of orofacial clefts vary considerably, according to the ethnic group and the geographical area. In general, populations of Asian or Native American origin have the highest prevalence, and Caucasian populations have intermediate prevalence, whereas populations of African origin have the lowest prevalence of orofacial clefts.18,16,20
In regard to geog raph ic dist ribution, the
deiciency in the recordkeeping and birth monitoring
systems in developing countries results in many
of these countries not knowing the frequency of clefts involving the lip and/or palate in their
population.3 Moreover, the lack of methodological
standardization of pertinent studies has limited the validity and comparability of prevalence rates
among different countries.20 The available data
indicate an overall frequency of orofacial clefts of 1:700 live births.3
A m aj or s u r ve y conduc t e d b y I PDTO C (International Perinatal Database of Typical Orofacial Clefts) evaluated the records of 30 countries, from 2000 to 2005, and found an average prevalence of 9.9 per 10,000 births. The highest prevalence rate was found in Japan (20.0 per 10,000). Countries like Canada (11.5 per 10,000), United States (10.2 per 10,000) and Australia (9.7 per 10,000) also showed high prevalence rates for orofacial clefts.19
A few nationwide studies on the prevalence of orofacial clefts were conducted in Brazil. A study
by Loffredo et al.21 found an overall prevalence
of 1.9 per 10,000 for the period from 1975 to 1994.
Another study carried out later with data between 1998 and 2002 found a prevalence rate of 3.6 per 10,000 live births.14
Recently, Abreu et al.15 reported an overall
prevalence of 4.85 per 10,000 live births, up from 3.94 to 5.46 between 2000 and 2013. In this study,
it was observed that this trend occurred mainly
in the Northeast (4.7% per year), the North (3.3%
per year) and the Center-West (2.9% per year). The authors mentioned that this temporal trend of increasing prevalence of orofacial clefts, limited to the poorest regions of the country, may be attributed to changes in risk factors, as well as to the improvement of the record-taking process for
this malformation in the SINASC.15
Considering geographic regions individually, our study observed no consistency in the increase or decrease in the number of records between the years 2009 and 2013, except for the Southeast, which presented a steadily increasing trend. Taking into account the country as a whole, the authors of this study observed a slightly increasing trend in the period studied (Figure 2).
The distribution by cleft type was also assessed in this study. Although cleft palate has shown Log AIH
,000 ,500 1,000 1,500 2,000 2,500 3,000
1,000 1,500 2,000 2,500 3,000 3,500
Log Cleft
Region
Southeast North Northeast
Center-west South
higher prevalence in all regions, variations in the
epidemiological proile of orofacial cleft among
the Brazilian federative units were observed. The literature reviewed suggests that there may be a six-fold variation worldwide in the prevalence of births with cleft lip with or without cleft palate (CL/P), and a threefold variation compared to births with cleft palate.19
Despite the unequal distribution of oral cleft prevalence rates by geographic region observed in this study, it is important to clarify that the historical patterns of Brazilian land occupation resulted in a higher concentration of blacks and browns in both the North and Northeast, and whites in the South and
Southeast (IBGE).22 Therefore, the highest prevalence rates observed in the South (8.23 per 10,000) and Southeast (6.18 per 10,000), and the lowest rates in
the Northeast (4.55 per 10,000) and North (5.2 per 10,000), may have been inluenced by the distribution
of these ethnic groups.
It could also be that the highest prevalence rates in orofacial clefts observed in the South and
Southeast may relect better coverage of the SINASC
in these regions.23 It is interesting to add that, when the authors of the present study analyzed the prevalence rates by federal unit, they noticed that
among the ive states with average rates below the
national average, two were located in the North and three in the Northeast, regions where SINASC
coverage is more deicient.
Surgical correction is the first step in the therapeutic approach of orofacial cleft treatment, and can reduce the aesthetic and functional sequelae. However, lack of funds puts this basic surgical treatment out of reach for many children in developing countries.3,4,11
Brazil has a National Health System (NHS, or SUS in Portuguese), created in 1988, whose legislation establishes universal and equal access to various health services.24 The irst initiative in caring for patients with craniofacial anomalies in the Brazilian NHS was taken in 1993 with the creation of mechanisms to pay for correcting lip and palate clefts and performing dental bone-integrated implants under the Hospital Information System (SIH-SUS). Another important initiative to heighten the focus on the
ield of craniofacial anomalies was the creation of
the Craniofacial Deformities Treatment Reference
Network (RRTDCF) in 1998.12
After evaluating the healthcare provided to patients with craniofacial anomalies within and
outside the RRTDCF, Monlleó et al.25 found that,
despite the large number of facilities caring for patients with orofacial clefts in Brazil, there were regional disparities. This situation leads to many patients having to delay treatment or remaining untreated. Moreover, the lack of coordination among factors of care, geographical distance and travel costs may cause many families to give up on follow-up treatment.
The largest volume of funds used on corrective surgery lip and/or palate treatment in the Southeast can be explained by the higher concentration of services that treat craniofacial deformities in this
region, especially in the state of São Paulo.12,23
Monlleó et al.12 (2006) mention that the lack of
comprehensive data on craniofacial anomalies
in the population makes it dificult to assess the
number of services required to meet the demand in the different regions of Brazil. On the other hand, the authors report that, when population concentration is considered as a parameter, there may actually not be an excessive number of services in the Southeast.
Although a higher concentration of health facilities performing reconstructive cleft lip and/or palate surgeries is located in the Southeast, the results for the coverage of this treatment in this region indicated that fewer than 23% of the children born
with orofacial clefts in this region beneited from
this treatment under the NHS in the study period (2009-2013). On the other hand, the insufficient number of services in other regions, mainly the North, Northeast and Center-West, can lead to a
signiicant number of patients looking for care in
institutions very far from of their place of residence.12
Rice and Smith13 emphasize the importance of
under study. However, despite these differences, the study found that the largest investments are being made in areas of higher prevalence. On the other hand, the fact that national coverage was below 20%, and that orofacial cleft requires several reconstructive surgeries, makes it clear that the basic surgical needs for treating orofacial clefts in the NHS are not being met.
The authors of the present study did not identify any study in the scientific literature disclosing the average cost of rehabilitation treatment for a child with orofacial cleft in Brazil. Pavri and
Forrest 26 mention that the wide variation in care
standards and the long treatment period make it difficult to assess the cost of rehabilitation of patients with orofacial clefts accurately. The authors also reported that international studies cannot be extrapolated, due to differences in the health systems.
The dificulties in gaining access to reconstructive
surgery in developing countries may imply that the rare charitable missions by non-governmental organizations (NGOs) could represent the only chance of treatment for many patients with orofacial cleft.12 This is an undesirable situation, because children that do not undergo reconstructive surgery will survive,
but are likely to face facial deformity, dificulty eating,
speaking and listening, and even psychological problems such as low self-esteem and depression. In addition to all these problems, unrehabilitated individuals are also more susceptible to stigmatization,
social exclusion and unemployment.3
Regarding the number of AIHs approved for hospital procedures to treat cleft lip and/or palate, it should be considered that this study used data from the SIH/SUS information system that has a coverage of about 80%, and that covers only procedures performed in hospitals under the Brazilian NHS (SUS), excluding procedures directly
funded or covered by health insurance.27,28 Another
point to be considered is that SIH-SUS used the number of hospitalizations and not patients as the
measurement unit.28 This limitation may hamper the
treatment analysis, especially regarding orofacial clefts, in which case the same person may have to undergo multiple surgeries.
In regard to data from the Declaration of Live Births and SINASC, the literature indicates problems related to diagnostic errors, omissions, poor recording and poor reporting, as well as typing errors and coding of data that can limit the reliability, completeness and coverage of information from this system. With this in mind, the results for the number of cases of orofacial clefts found in this study could have been underestimated.29,30,31 Another limitation of the study concerns its ecological fallacy, since the statistics calculated using the geographical area averages may differ substantially from those
that are individual-based32.
Despite the abovementioned limitations, this
study can help address the lack of oficial statistics
on the frequency and distribution of orofacial clefts, and on the surgical treatments offered in different Brazilian regions, to guide health service management and planning, and ultimately help reduce inequalities in gaining access to health services. However, knowledge of the true magnitude of orofacial cleft prevalence in Brazil, obtained from secondary data, requires measures that must include the improvement of birth records and the integration of the health information system databases available in the country.
In a country as expansive and diverse as Brazil, with many inequalities, several factors may be
inluencing both the prevalence rates and the access
barriers for surgical treatment of orofacial clefts. Therefore, future research should be conducted to better elucidate these issues.
Conclusions
1. Dixon MJ, Marazita ML, Beaty TH, Murray JC. Cleft lip and palate. undesrstanding genetic and
environmental influences. Nat Rev Genet. 2011;12(3):167-78.
https://doi.org/10.1038/nrg2933
2. Gil-da-Silva-Lopes VL, Monlleó IL. Risk factors and the
prevention of oral clefts. Braz Oral Res. 2014;28(n espec):1-5. http://dx.doi.org/10.1590/S1806-83242014.50000008
3. Mossey PA, Shaw WC, Munger RG, Murray JC, Murthy J, Little J. Global oral health inequalities: challenges in the prevention and management of orofacial clefts and
potential solutions. Adv Dent Res. 2011;23(2):247-58. https://doi.org/10.1177/0022034511402083
4. Freitas JAS, Neves LT, Almeida ALPF, Garib DG, Trindade-Suedam IK, Yaedú RYF et al. Rehabilitative treatment of cleft lip and palate: experience of the Hospital for Rehabilitation of Craniofacial Anomalies - USP (HRAC/USP). Part
1: overall aspects. J Appl Oral Sci. 2012;20(1):9-15.
https://doi.org/10.1590/S1678-77572012000100003 5. Campillay PL, Delgado SE, Brescovici SM.
[Evaluation of feeding in children with cleft
lip and/or palate assisted in a hospital of Porto
Alegre]. Rev CEFAC. 2010;12(2):257-266. Portuguese. httpz://doi.org/10.1590/S1516-18462010005000010
6. Silva DP, Dornelles S PLEA. Velopharyngeal sphincter pathophysiologic aspects in the in cleft palat. Arq Int
Otorrinolaringol. 2008;12(3):426-35.
7. Amaral MIR, Martins JE, Santos MFC. A study on the hearing of children with non-syndromic cleft
palate/lip. Braz J Otorhinolaringol. 2010;76(2):164-71. https://doi.org/10.1590/S1808-86942010000200004
8. Kramer F-J, Gruber R, Fialka F, Sinikovic B, Hahn
W, Schliephake H. Quality of life in
school-age children with orofacial clefts and their
families. J Craniofac Surg. 2009;20(6):2061-6.
https://doi.org/10.1097/SCS.0b013e3181be8892
9. World Health Organization – WHO. Global strategies to reduce the health-care burden of craniofacial anomalies: report of WHO meetings on International Collaborative Research on Craniofacial Anomalies. Geneva: World
Health Organization; 2002.
10. Wehby GJ, CastiLla EE, Goco N, Rittler M, Cosentino V, Javois L et al. Description of the methodology used in an ongoing pediatric care interventional study of children born with cleft lip and palate in South America. BMC
Pediatr. 2006;6(9):9. https://doi.org/10.1186/1471-2431-6-9
11. Conway JC, Taub PJ, Kling R, Oberoi K, Doucette J,
Jabs EW. Ten-year experience of more than 35.000 orofacial clefts in Africa. BMC Pediatr. 2015;15(1):8.
https://doi.org/10.1186/s12887-015-0328-5
12. Monlleó IL, Gil-Da-Silva-Lopes V. [Craniofacial anomalies: description and evaluation of treatment under the Brazilian Unified Health System]. Cad
Saúde Pública. 2006;22(5):913-22. Portuguese. https://doi.org/10.1590/S0102-311X2006000500004
13. Rice N, Smith PC. Ethics and geographical equity
in health care. J Med Ethics. 2001;27(4):256-61. https://doi.org/10.1136/jme.27.4.256
14. Rodrigues K, Sena, MF, Roncalli AG, Ferreira MAF. Prevalence of orofacial clefts and social
factors in Brazil. Braz Oral Res. 2009;23(1):38-42. https://doi.org/10.1590/S1806-83242009000100007
15. Abreu MH, Lee KH, Luquetti DV, Starr JR. Temporal trend in the reported birth prevalence of cleft lip and/or cleft palate in Brazil, 2000 to 2013. Birth
Defects Res A Clin Mol Teratol. 2016;106(9):789-92.
https://doi.org/10.1002/bdra.23528
16. Nhoncanse GC, Melo DG. [Reliability of Birth Certificates as a source of information on congenital defects in the City of São Carlos, São Paulo, Brazil].
Cienc Saúde Coletiva. 2012;17(4):955-63. Portuguese. http://dx.doi.org/10.1590/S1413-81232012000400017
17. Paiva NS, Coeli CM, Moreno AB, Guimarães RM, Camargo Júnior KR. [Brazilian live birth information system: a review study]. Cienc Saúde
Coletiva. 2011;16(Suppl.1):1211-20. Portuguese. http://dx.doi.org/10.1590/S1413-81232011000700053
18. Croen LA, Shaw GM, Wasserman CR, Tolarová MM. Racial and ethnic variations in the prevalence of orofacial clefts in California , 1983–1992. Am J Med
Genet 1998;79(1):42-7. https://doi.org/10.1002/(SICI)1096-8628(19980827)79:1<42::AID-AJMG11>3.0.CO;2-M
19. IPDTOC Working Group. Prevalence at birth of cleft lip with or without cleft palate.propor data from the International Perinatal Database of Typical Oral Clefts
(IPDTOC) Cleft Palate-Craniofac J. 2011;48(1):66-81.
https://doi.org/10.1597/09-217
20. World Health Organization – WHO. Global registry and database on craniofacial anomalies: report of a WHO registry meeting on craniofacial anomalies.Geneva:
WHO; 2003.
21. Loffredo LCM, Freitas JAS, Grigolli AAG.
[Prevalence of oral clefts from 1975 to 1994, Brazil]. Rev Saúde Pública. 2001;35(6):571-5. Portuguese. https://doi.org/10.1016/S0140-6736(11)60054-8
22. Instituto Brasileiro de Geografia e Estatística –
IBGE. Censo demográfico 2010: características da
população e dos domicílios: resultados do universo. Rio de Janeiro: Instituto Brasileiro de Geografia e
Estatística; 2011.
23. Jorge MHPDM, Laurenti R, Gotlieb SLD.
[Quality analysis of Brazilian vital statistics: the
experience of implementing the SIM and SINASC
systems]. Cienc Saúde Coletiva. 2007;12(3):643-54. https:// doi.org/10.1590/S1413-81232007000300014 24. Paim J, Travassos C, Almeida C, Bahia L, Macinko
J. The Brazilian health system: history, advances,
and challenges. Lancet. 2011;377(9779):1778-97. https://doi.org/10.1016/S0140-6736(11)60054-8
25. Monlleo IL, Mossey PA, Gil-da-Silva-Lopes VL. Evaluation of craniofacial care outside the Brazilian reference network for craniofacial treatment. Cleft Palate-Craniofac J.
2009;46(2):204-11. https://doi.org/10.1597/07-153.1
26. Pavri S, Forrest CR. Demographics of orofacial clefts in Canada from 2002 to 2008. Cleft Palate Craniofac J.
2013;50(2):224-30. https://doi.org/10.1597/10-223
27. Rede Interagencial de Informações para a Saúde – Ripsa. Indicadores de cobertura: F.16 Proporção da população coberta por planos privados de saúde - ANS. Brasília,
DF: Ministério da Saúde; 2012 [cited 2016 Abr 29].
Available from: http://tabnet.datasus.gov.br/cgi/tabcgi. exe?idb2012/f16.def
28. Jorge MHPDM, Laurenti R, Gotlieb SLD. [Evaluation of health information systems in Brazil]. Cad Saúde Coletiva.
2010;18(1):7-18. Portuguese.
29. Guerra FAR, Llerena Junior JC, Gama SGN, Cunha CB, Theme Filha MM. [Reliability of birth defect data
on birth certificates of Rio de Janeiro, Brazil, 2004]. Cad Saúde Pública. 2008;24(2):438-46. Portuguese.
https://doi.org/10.1590/S0102-311X2008000200023 30. Nunes LMN, Pereira AC, Queluz DP. [Oral cleft
and its notification in the information system: Live Births Declaration analysis in Campos dos
Goytacazes, Rio de Janeiro State, 1999-2004]. Cienc Saúde Coletiva. 2010;15(2):345-52. Portuguese. https://doi.org/10.1590/S1413-81232010000200009
31. Pedraza DF. [Quality of the Information System on Live Births /SINASC: a critical analysis of published studies].
Cienc Saúde Coletiva. 2012;17(10):2729-37. Portuguese. https://doi.org/10.1590/S1413-81232012001000021
32. Holt D, Steel DG, Tranmer M, Wrigley N.
Aggregation and Ecological effects in Geographically Based Date. Geogr Anal. 1996;28(3):244-61.