DOI: 10.5935/2359-4802.20170067
ORIGINAL ARTICLE
Mailing Address: Liz Andréa Villela Baroncini
Rua Buenos Aires, 764, ap. 601. Postal Code: 80250-070. Batel, Curitiba, PR – Brazil. E-mail: [email protected]; [email protected]
.
Hypertensive Adolescents: Correlation with Body Mass Index and Lipid and Glucose Profiles
Liz Andréa Villela Baroncini,1 Lucimary de Castro Sylvestre,1 Camila Varotto Baroncini,2 Marcieli da Luz Giroldo,1
Dalton Bertolim Précoma,1 Roberto Pecoits Filho1
Pontifícia Universidade Católica do Paraná,1 Universidade Federal do Paraná,2 PR – Brazil
Manuscript received January 04, 2016; revised manuscript August 08, 2016; accepted April 05, 2017.
Abstract
Background: The occurrence of hypertension during adolescence correlates with metabolic changes, obesity, and overweight.
Objective: To correlate the lipid and glucose profiles of hypertensive and nonhypertensive adolescents with age, gender, body mass index (BMI), weight, and height.
Methods: We selected 53 hypertensive adolescents and 182 healthy, nonhypertensive adolescents. The adolescents were divided into three groups: group I (GI; n = 108, 58 males, mean age 15.2 ± 2.2 years), consisted of healthy, nonhypertensive adolescents of healthy parents without a diagnosis of hypertension, dyslipidemia, or diabetes; group II (GII, n = 53, 28 males, mean age 13.9 ± 1.4 years), consisted of adolescents with confirmed hypertension; and group III (GIII; n = 74, 31 males, mean age 14.9 ± 2.2 years), consisted of healthy, nonhypertensive adolescents of parents with a diagnosis of hypertension, dyslipidemia, or diabetes.
Results: Gender and weight did not differ significantly among the groups. The subjects in GII were overall younger (around 1 year), shorter, and had a higher BMI compared with those in GI and GIII. After adjustment for age and BMI, GII presented higher glucose and LDL-C levels and lower HDL-C levels compared with GI and GIII. Total cholesterol and triglycerides levels showed no differences between groups. GI and GIII had no significant differences with regard to the analyzed variables.
Conclusion: Hypertensive adolescents showed higher values of BMI, and serum glucose and LDL-C levels, and lower serum HDL-C levels. These findings reveal that the changes in lipid profile and glucose metabolism that occur during adolescence may be influenced by the occurrence of hypertension during this developmental phase. (Int J Cardiovasc Sci. 2017;30(5):401-407)
Keywords: Adolescent; Hypertension; Dyslipidemias; Obesity; Body Mass Index; Overwehight.
Introduction
The continuously growing rates of obesity and overweight in children and adolescents has led to an increased prevalence of metabolic syndrome and hypertension in this population.1-3 Children with primary hypertension are usually overweight and obese, which complicates the dissociation of the effects of the blood pressure (BP) levels from those of the metabolic abnormalities.4 The prevalence of hypertension increases progressively with increasing values of body
mass index (BMI), and both the aging process (with physiological and biochemical changes) and obesity are known to contribute to BP changes during adolescence.5,6 Furthermore, hypertension in childhood and adolescence can lead to hypertension in adulthood.7
process of sexual maturation, and the levels of total cholesterol (TC) show a negative association with height.5,7 According to findings by Kouda et al.,7 height velocity is inversely associated with dynamic changes in serum lipids during puberty. These metabolic changes at puberty could reflect a potential cardiovascular risk in adulthood since a shorter stature is associated with a higher risk of development of coronary artery disease (CAD).9
Based on these observations, the objective of the present study was to assess and correlate the lipid and glucose profiles of hypertensive and nonhypertensive adolescents with these individuals’ age, gender, BMI, weight, and height.
Methods
Patients
We selected 148 consecutive adolescents regularly attending a hypertension ambulatory of a Pediatric Nephrology Clinic at the public health care system due to a diagnosis of hypertension. All hypertensive subjects had an office systolic and/or diastolic BP equal to or above the 95th percentile for gender and height on three or more occasions (office hypertension). The diagnosis of hypertension was confirmed by 24-hour ambulatory blood pressure monitoring (ABPM), in which the presence of hypertension was defined as an average daytime and/or nighttime BP equal to or above the 95th percentile for gender and height according to ABPM pediatric standards.10 We excluded from the study subjects without confirmed hypertension and included those with essential or secondary hypertension. For the control group, 182 healthy adolescents (90 males, mean age 15.1 ± 2.2 years) were selected from the public healthcare unit.
Each adolescent had their height and weight measured at the time of their appointment. In regard to BP assessment, all measurements were obtained from non-sedated subjects in the supine position and at rest. Systolic and diastolic BP recordings were obtained from the right arm with appropriately sized cuffs, after a minimum of 30 minutes of rest.Three BP measurements were obtained using a standard manual mercury sphygmomanometer, and the average of the three readings was used in the analysis. Levels of BP were classified according to established guidelines:11 normal (systolic < 120 mmHg; diastolic < 80 mmHg),
prehypertension (systolic 120-139 mmHg; diastolic 80-89 mmHg), or hypertension (systolic ≥ 140 mmHg; diastolic ≥ 90 mmHg). Participants who reported taking BP medications were considered as having hypertension regardless of their BP measurements.
The adolescents were considered overweight or obese when presenting BMI values equal to or above the 85th and 95th percentiles for age and gender, respectively.12-14 The BMI was calculated using the standard formula.12,15 Both parents and adolescents were asked to collect blood samples between 1 week before and 1 week after the appointment, for assessment of fasting serum glucose, TC, high-density lipoprotein cholesterol (HDL-C), low-density lipoprotein cholesterol (LDL-C), triglycerides (TG), and creatinine. The parents’ data were only used to establish diagnoses of diabetes and dyslipidemia and were not further analyzed in the study.
In the hypertensive and control groups, the exclusion criteria were subjects without blood samples and adolescents with a diagnosis of diabetes, dyslipidemia, and chronic kidney disease. The presence of obesity or overweight was not considered an exclusion criterion. The following tests were additionally obtained from the subjects in the hypertensive group: microalbuminuria (abnormal values between 30 to 300 mg/g creatinine),16 glomerular filtration rate (GFR; abnormal values below 75 mL/min/1.73 m²),17 and basal insulin (normal values between 5 and 25 µU/mL).6
The adolescents were divided into three groups: group I (GI; n = 108, 58 males, mean age 15.2 ± 2.2 years), comprising healthy, nonhypertensive adolescents born to healthy parents without a diagnosis of or taking any medication for hypertension, dyslipidemia, or diabetes; group II (GII; n = 53, 28 males, mean age 13.9 ± 1.4 years), comprising adolescents with confirmed hypertension; and group III (GIII; n = 74, 31 males, mean age 14.9 ± 2.2 years), comprising healthy, nonhypertensive adolescents whose parents a) were being treated for dyslipidemia or presented baseline levels of TC ≥ 200 mg/dL, LDL-C > 130 mg/dL, HDL-C < 40 mg/dL, or TG ≥ 150 mg/dL; b) had diabetes mellitus or a fasting plasma glucose ≥ 100 mg/dL; and c) were taking medications for hypertension or presented a systolic BP ≥ 140 mmHg or diastolic BP ≥ 90 mmHg.18,19
Blood sample analysis
Levels of fasting serum glucose, TC, HDL-C, LDL-C, TG, creatinine, GFR, and microalbuminuria were determined using standard techniques and assays at a central laboratory. Briefly, for measurements of TC, LDL-C, HDL-C, TG, and glucose values, approximately 5 mL of venipuncture blood were collected from each subject and placed in Vacutainer tubes after a 12- to 14-hour fast. The serum was separated from the red cells by centrifugation at 3,000 rpm for 10 minutes at 4ºC up to 2 hours after the venipuncture procedure. The serum was then placed in microtubes and stored at –20ºC for subsequent determination of lipid fractions and glucose levels. Serum levels of TC, HDL-C, TG, and glucose were determined by enzymatic methods (Roche Diagnostics), while LDL-C values were estimated by the Friedewald formula: LDL-C = TC - (HDL-C + TG / 5).13
Statistical analysis
The results of the quantitative variables are described as means and standard deviations. Frequencies and percentages for gender as a variable are presented, and the chi-square test was used to compare the groups. For age, weight, height, and BMI, the groups were compared using one-way analysis of variance (ANOVA). Lipid variables were compared with analysis of covariance (ANCOVA) including age, height, and BMI as covariables. The least significant difference (LSD) test was used for post hoc multiple comparisons. Values of p < 0.05 were considered statistically significant. The data were analyzed with the program IBM SPSS Statistics, v.20.
Results
A total of 95 hypertensive adolescents from the GII, who were younger than 12 years of age and lacked laboratory tests, were excluded from the study. Since the information regarding the Tanner pubertal stage was unavailable, the age of 11 years was used as a surrogate marker for the onset of puberty. A total of 53 hypertensive adolescents (28 males, mean age 13.9 ± 1.4 years) remained in the study. All these subjects were receiving antihypertensive therapy comprising angiotensin-converting enzyme inhibitors (ACEIs; n = 19), amlodipine (n = 5), propranolol (n = 1), or combinations of ACEI and amlodipine (n = 11), amlodipine and propranolol (n = 2), ACEI and propranolol (n = 1), and ACEI and angiotensin II receptor blockers (n = 1). None of the patients was using diuretics. In 19 adolescents
(35%), we identified potential causes of secondary hypertension including coarctation of the aorta, reflux nephropathy, ectopic kidney, polycystic kidney disease, chronic pyelonephritis, renal artery stenosis, solitary kidney, and renal atrophy.
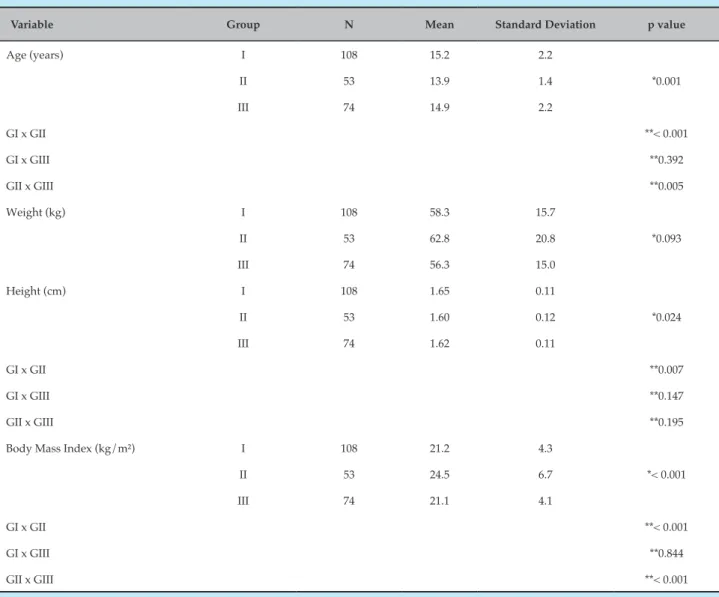
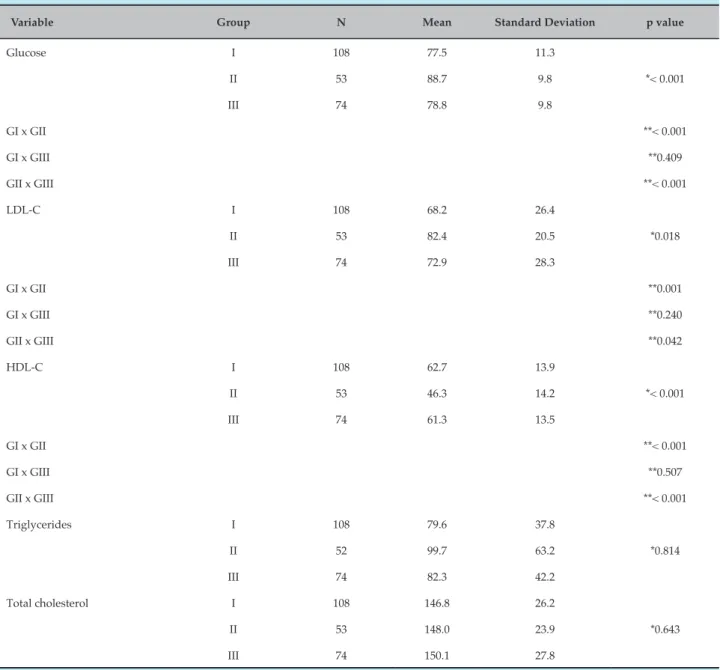
L e v e l s o f c r e a t i n i n e ( 0 . 6 ± 0 . 1 4 m g / d L ) , microalbuminuria (12.1 ± 16.7 mg/g creatinine), and GFR (161 ± 47 mL/min/1.73 m²) were normal in the hypertensive adolescents. There were no significant differences in gender and weight among the three groups. The subjects in GII were younger (maximum 1 year), shorter, and had higher BMI values compared with those in GI and GIII (Table 1). After adjustment for age and BMI values, the subjects in GII presented higher glucose and LDL-C levels and lower HDL-C levels when compared with those in GI and GIII (Table 2). Levels of TC and TG did not differ between groups. In regard to height, 25 adolescents (23%) in GI, 12 (22%) in GII, and 12 (16%) in GIII were considered short or very short for age. In regard to weight, 25 adolescents (22%) in GI, 28 (52%) in GII, and 16 (21%) in GIII were considered obese or overweight for age. When only the GII was analyzed, there was no significant difference in relation to age, height (p = 0.8), weight (p = 0.1), or levels of TC, LDL-C, HDL-C, TG, and glucose in adolescents with essential or secondary hypertension (data not shown). In both GI and GIII, there were no significant differences in regard to the analyzed variables.
Discussion
Table 1 – Basal characteristics of each group
Variable Group N Mean Standard Deviation p value
Age (years) I 108 15.2 2.2
II 53 13.9 1.4 *0.001
III 74 14.9 2.2
GI x GII **< 0.001
GI x GIII **0.392
GII x GIII **0.005
Weight (kg) I 108 58.3 15.7
II 53 62.8 20.8 *0.093
III 74 56.3 15.0
Height (cm) I 108 1.65 0.11
II 53 1.60 0.12 *0.024
III 74 1.62 0.11
GI x GII **0.007
GI x GIII **0.147
GII x GIII **0.195
Body Mass Index (kg/m²) I 108 21.2 4.3
II 53 24.5 6.7 *< 0.001
III 74 21.1 4.1
GI x GII **< 0.001
GI x GIII **0.844
GII x GIII **< 0.001
*One-way analysis of variance (ANOVA), p < 0.05. **Least significant difference (LSD), p < 0.05.
which comprised nonhypertensive adolescents. We were unable to rule out the possibility that this age difference of 1 year could have influenced the final height of the subjects in this group when compared with those in GI and GIII. Moreover, these findings corroborate those from other studies that have revealed an inverse relationship between height and lipid profile.20,21
Adolescents with a significant increase in height are likely to present decreased serum lipid levels, whereas those with a lower increase in height are likely to present increased serum lipid levels.22 A short height is also associated with other CAD risk factors such as hypertension, high LDL-C levels, and diabetes. A prospective study involving these adolescents would
be required to analyze their final height and correlate it to their lipid profile.
Table 2 – Lipids and glucose levels
Variable Group N Mean Standard Deviation p value
Glucose I 108 77.5 11.3
II 53 88.7 9.8 *< 0.001
III 74 78.8 9.8
GI x GII **< 0.001
GI x GIII **0.409
GII x GIII **< 0.001
LDL-C I 108 68.2 26.4
II 53 82.4 20.5 *0.018
III 74 72.9 28.3
GI x GII **0.001
GI x GIII **0.240
GII x GIII **0.042
HDL-C I 108 62.7 13.9
II 53 46.3 14.2 *< 0.001
III 74 61.3 13.5
GI x GII **< 0.001
GI x GIII **0.507
GII x GIII **< 0.001
Triglycerides I 108 79.6 37.8
II 52 99.7 63.2 *0.814
III 74 82.3 42.2
Total cholesterol I 108 146.8 26.2
II 53 148.0 23.9 *0.643
III 74 150.1 27.8
*One-way analysis of variance (ANOVA), p < 0.05. **Least significant difference (LSD), p < 0.05. LDL-C: low-density lipoprotein cholesterol; HDL-C: high-density lipoprotein cholesterol.
stiffness increase with age and that an early hormonal control (hormone levels and expression of receptors) may simultaneously influence the growth of long bones and arteries, leading to further developmental changes in vascular structure and function, as well as changes in the susceptibility to artery stiffness and hypertension.24,25 These alterations may also influence the thickness of the media layer which, when increased, is considered a marker of atherosclerotic disease.26-27
1. Schiel R, Beltschikow W, Radón S, Kramer G, Perenthaler T, Stein G. Increased carotid intima-media thickness and associations with cardiovascular risk factors in obese and overweight children and adolescents. Eur J Med Res. 2007;12(10):503-8.
2. Fang J, Zhang JP, Luo CX, Yu XM, Lv LQ. Carotid intima-media thickness in childhood and adolescent obesity relations to abdominal obesity, high triglycerides level and insulin resistance. Int J Med Sci. 2010;7(5):278-83.
3. D’Adamo E, Guardamagna O, Chiarelli F, Bartuli A, Liccardo D, Ferrari F, et al. Atherogenic dyslipidemia and cardiovascular risk factors in obese children. Int J Endocrinol. 2015;2015:912047. doi: 10.1155/2015/912047.
4. Stabouli S, Kotsis V, Karagianni C, Zakopoulos N, Konstantopoulos A. Blood pressure and carotid artery intima-media thickness in children and adolescents: the role of obesity. Hellenic J Cardiol. 2012;53(1):41-7.
5. Song YH. The correlation of blood pressure with height and weight in Korean adolescents aged 10 – 19 years; The Korean National Health and Nutrition Examination Surveys (2009 – 2001). Korean J Pediatr. 2014;57(1):35-40.
6. Sinaiko AR, Gomez-Marin O, Prineas RJ. Relation of fasting insulin to blood pressure and lipids in adolescents and parents. Hypertension. 1997;30(6):1554-9.
References
of coronary risk.28 Unfortunately, few studies have correlated the progression of height with the lipid profile, glucose levels, and hypertension in children and adolescents, as most seek to associate these variables with childhood and juvenile obesity.29-32 A study by Batide-Alanore et al.33 including 865 families has confirmed that short height is associated with an adverse cardiovascular profile. Despite the small number of participants, the findings of this study, showing that hypertensive adolescents (with essential or secondary hypertension) were shorter and presented higher glucose and LDL-C serum levels and lower HDL-C serum levels, may contribute to the development of further prospective studies assessing the behavior of these variables at adult age and their correlation with the incidence of CAD. These findings show the correlation and complexity of the mechanisms involving hypertension in growing adolescents, who are constantly affected by metabolic changes.
Study limitations
The present study has some important limitations, including a small number of assessed individuals, lack of fasting insulin levels6 in all groups, younger age of subjects in GII (which may have influenced their shorter height in relation to the other groups), the inclusion of adolescents with primary and secondary hypertension, and the absence of Tanner stage information to determine the sexual development of the participants (considering that early puberty is associated with short height, lipid profile alterations, and increased cardiovascular risk).20 In regard to essential and secondary hypertension, we only included in the present study those adolescents without chronic kidney disease, confirmed by levels of GFR, creatinine, and microalbuminuria, and chose adolescents with similar weight and height in both
groups. Also, we lacked data on the birth weight and abdominal circumference of the subjects, which could have added more information about these individuals.
Conclusion
Hypertensive adolescents had higher BMI values and increased serum glucose and LDL-C levels, and lower serum HDL-C levels. These findings reveal that the changes in lipid profile and glucose metabolism that occur during adolescence might be influenced by the presence of hypertension at this developmental phase.
Author contributions
Conception and design of the research: Baroncini LAV, Sylvestre LC, Giroldo ML, Précoma DB, Pecoits Filho R. Acquisition of data: Baroncini LAV, Sylvestre LC, Baroncini CV, Giroldo ML. Analysis and interpretation of the data: Baroncini LAV, Sylvestre LC, Baroncini CV, Giroldo ML, Précoma DB, Pecoits Filho R. Statistical analysis: Baroncini LAV, Sylvestre LC, Giroldo ML, Précoma DB, Pecoits Filho R. Writing of the manuscript: Baroncini LAV. Critical revision of the manuscript for intellectual content: Baroncini LAV, Pecoits Filho R.
Potential Conflict of Interest
No potential conflict of interest relevant to this article was reported.
Sources of Funding
There were no external funding sources for this study.
Study Association
7. Kouda K, Nakamura H, Fan WY, Takeuchi H. Negative relationships between growth in height and levels of cholesterol in puberty: a 3-year follow-up study. Int J Epidemiol. 2003;32(6):1105-10.
8. Shankar RR, Eckert GJ, Saha C, Tu W, Pratt H. The change in blood pressure during pubertal growth. J Clin Endocrinol Metab. 2005;90(1):163-7. doi: 10.1210/jc.2004-0926.
9. Bjornsson E, Thorgeirsson G, Gudnason T. Adult height associates with angiographic extent of coronary artery disease. Atherosclerosis. 2016;254:237-41. doi: 10.1016/j.atherosclerosis.2016.07.918.
10. Soergel M, Kirschstein M, Busch C, Danne T, Gellermann J, Holl R, et al. Oscillometric twenty-four hour ambulatory blood pressure values in healthy children and adolescents: a multicenter trial including 1141 subjects. J Pediatr. 1997;130(2):178-84.
11. National High Blood Pressure Education Program Working Group on High Blood Pressure in Children and Adolescents. The fourth report on the diagnosis, evaluation, and treatment of high blood pressure in children and adolescents. Pediatrics. 2004;114(2 Suppl 4th Report):555-76.
12. Krebs NF, Jacobson MF; American Academy of Pediatrics Committee on Nutrition. Prevention of overweight and obesity. Pediactris. 2003;112(2):424-30.
13. Conde WL, Monteiro CA. Body mass index cutoff points for evaluation of nutritional status in Brazilian children and adolescents. J Pediatr (Rio J). 2006;82(4):266-72. doi:10.2223/JPED.1502.
14. Cole TJ, Bellizzi MC, Flegal KM, Dietz WH. Establishing a standard definition for child overweight and obesity worldwide: international survey. BMJ 2000;320(7244):1240-3.
15. Galescu O, George M, Basetty S, Predescu I, Mongia A, Ten S, et al. Blood pressure over height ratios: simple and accurate method of detecting elevated blood pressure in children. Int J Pediatr. 2012;2012:253497. doi: 10.1155/2012/253497..
16. Singh A, Satchell SC. Microalbuminuria: cause and implications. Pediatr Nephrol. 2011;26(11):1957-65. doi: 10.1007/s00467-011-1777-1.
17. Pottel H, Hoste L, Delanaye P. Abnormal glomerular filtration rate in children, adolescents and young adults starts below 75 mL/min/1.73 m(2). Pediatr Nephrol. 2015;30(5):821-8. doi: 10.1007/s00467-014-3002-5.
18. Mancia G, Fagard R, Narkiewicz K, Redón J, Zanchetti A, Böhm M, et al. 2013 ESH/ESC Guidelines for the management of arterial hypertension. The task force for the management of arterial hypertension of the European Society of Hypertension (ESH) and of the European Society of Cardiology. J Hypertens. 2013;31(7):1281-357. doi: 10.1097/01. hjh.0000431740.32696.cc
19. Stone NJ, Robinson JG, Lichtenstein AH, Merz CN, Blum CB, Eckel RH, et al; American College of Cardiology/American Heart Association Task Force on Practice Guidelines. 2013 ACC/AHA Guideline on the treatment of blood cholesterol to reduce atherosclerotic cardiovascular risk in adults. A report of the American College of Cardiology/American Heart Association task force on practice guidelines. Circulation. 2014;129(25 Suppl 2):S1-45. Erratum in: Circulation. 2015;132(25):e396; Circulation. 2014;129(25 Suppl 2):S46-8. doi: 10.1161/01.cir.0000437738.63853.7a.
20. Jelenkovic A, Bogl LH, Rose RJ, Kangas AJ, Soininen P, Ala-Korpela M, et al. Association of height and pubertal timing with lipoprotein subclass
profile: exploring the role of genetic and environmental effects. Am J Hum Biol. 2013;25(4):465-72. doi: 10.1002/ajhb.22381.
21. Fujita Y, Kouda K, Nakamura H, Nishio N, Takeuchi H, Iki M. Height-specific serum cholesterol levels in pubertal children: data from population-based Japanese school screening. J Epidemiol. 2011;21(2):102-7.
22. Nelson CP, Hamby SE, Saleheen D, Hopewell JC, Zeng L, Assimes TL, et al; CardioGram+C4D Consortium. Genetically determined height and coronary artery disease. N Engl J Med. 2015;372(17):1608-18. doi: 10.1056/NEJMoa1404881.
23. Shankar RR, Eckert GJ, Saha C, Tu W, Pratt JH. The change in blood pressure during pubertal growth. J Clin Endocrinol Metab. 2005;90(1):163-7. doi: 10.1210/jc.2004-0926.
24. Langenberg C, Hardy R, Breeze E, Kuh D, Wadsworth ME. Influence of short stature on the change in pulse pressure, systolic and diastolic blood pressure from age 36 to 53 years: an analysis using multilevel models. Int J Epidemiol. 2005;34(4):905-23. doi: 10.1093/ije/dyi071.
25. Le J, Zhang D, Menees S, Chen J, Raghuveer G. “Vascular age” is advanced in children with atherosclerosis-promoting risk factors. Circ Cardiovasc Imaging. 2010;3(1):8-14. doi: 10.1161/ CIRCIMAGING.109.880070.
26. Lande MB, Carson NL, Roy J, Meagher CC. Effects of childhood primary hypertension on carotid intima media thickness: a matched controlled study. Hypertension. 2006;48(1):40-4. doi: 10.1161/01. HYP.0000227029.10536.e8
27. Flynn JT. What is the significance of increased carotid intima media thickness in hypertensive adolescents? Hypertension. 2006;48(1):23-4. doi: 10.1161/01.HYP.0000226914.44904.ca
28. Lande MB, Carson NL, Roy J, Meagher CC. Effects of childhood primarty hypertension on carotid intima media thickness: a matched controlled study. Hypertension 2006;48(1):40-4. doi: 10.1161/01. HYP.0000227029.10536.e8
29. Paajanen TA, Oksala NK, Kuukasjärvi P, Karhunen PJ. Short stature is associated with coronary heart disease: a systematic review of the literature and a meta-analysis. Eur Heart J. 2010;31(14):1802-9. doi: 10.1093/eurheartj/ehq155
30. Flynn JT, Falkner BE. Obesity hypertension in adolescents: epidemiology, evaluation, and management. J Clin Hypertens (Greenwich). 2011;13(5):323-31. doi 10.1111/j.1751-7176.2011.00452.x
31. Sorof J, Daniels S. Obesity hypertension in children: a problem of epidemic proportion. Hypertension. 2002;40(4):441-7.
32. Jago R, Harrell JS, McMurray RG, Edelstein S, Ghormli LE, Bassin S. Prevalence of abdominal lipid and blood pressure values among an ethnically diverse population of eighth-grade adolescents and screening implications. Pediatrics. 2006;117(6):2065-73. doi 10.152/ peds.2005-1716.
33. Juliaty A, Sari DM, Daud D, Lisal JS. Relationship between blood pressure and lipid profile on obese children. Am J Health Res. 2015;3(4):198-202. doi: 10.11648/j.ajhr.20150304.11