Auditory Effects of Exposure to Noise and
Solvents: A Comparative Study
Diolen Conceição Barros Lobato
1Adriana Bender Moreira De Lacerda
2Cláudia Giglio De Oliveira Gonçalves
2Herton Coifman
31Department of Audiology, Universidade Tuiuti do Paraná; Universidade da Amazônia, Belém, PA, Brazil
2Department of Comunication Disorders, Universidade Tuiuti do Paraná, Curitiba, PR, Brazil
3Departament of Otorhinolaryngology, Universidade Federal do Paraná, Curitiba, PR, Brazil
Int Arch Otorhinolaryngol 2014;18:136–141.
Address for correspondence Diolen Conceição Barros Lobato, Universidade Tuiuti do Paraná, Rua Engenheiro Niepce da Silva, 290, ap 72E, Portão, Curitiba, Paraná, Brasil 80610-280
(e-mail: [email protected]).
Introduction
The number of environmental contaminants in the workplace investigated for their ototoxic/neurotoxic properties leading to hearing loss is reduced. Three groups of contaminants are considered high priority for research to be potentially oto-toxic and are present in various production processes: sol-vents, asphyxiants, and heavy metals, as well as today’s
organophosphate pesticides.1,2
In recent decades, a few studies have identified organic solvents as environmental contaminants that are more
dan-gerous to health. It is known that organic solvents can act as ototoxic and neurotoxic agents, causing severe damage to hearing, especially in the presence of noise.2–7
The health effects depend on the toxicity of the solvent and are related to their physical-chemical and metabolic proper-ties. For the worker, the pathway, exposure concentration, absorbed dose, time of exposure, susceptibility of the indi-vidual worker, toxic metabolites, medical conditions, and combination with other chemical exposures are relevant to the associated risk. Multiple exposures to solvents are a common risk in the work environment.7
Keywords
►
solvents
►
occupational health
►
audiology
►
hearing loss
►
noise-induced
Abstract
Introduction
Industry workers are exposed to different environmental risk agents
that, when combined, may potentiate risks to hearing.
Objective
To evaluate the effects of the combined exposure to noise and solvents on
hearing in workers.
Methods
A transversal retrospective cohort study was performed through
documen-tary analysis of an industry. The sample (
n
¼
198) was divided into four groups: the
noise group (NG), exposed only to noise; the noise and solvents group (NSG), exposed to
noise and solvents; the noise control group and noise and solvents control group (CNS),
no exposure.
Results
The NG showed 16.66% of cases suggestive of bilateral noise-induced hearing
loss and NSG showed 5.26%. The NG and NSG had worse thresholds than their respective
control groups. Females were less susceptible to noise than males; however, when
simultaneously exposed to solvents, hearing was affected in a similar way, resulting in
signi
fi
cant differences (
p
<
0.05). The 40- to 49-year-old age group was signi
fi
cantly
worse (
p
<
0.05) in the auditory thresholds in the NSG compared with the CNS.
Conclusion
The results observed in this study indicate that simultaneous exposure to
noise and solvents can damage the peripheral auditory system.
received July 27, 2013 accepted
September 10, 2013
DOI http://dx.doi.org/ 10.1055/s-0033-1361083. ISSN 1809-9777.
Copyright © 2014 by Thieme Publicações Ltda, Rio de Janeiro, Brazil
It is possible to verify that simultaneous exposure to noise and solvents has a additive toxic effect to the peripheral auditory system, confirming the harmfulness of associated agents,8–15 leaving sequelae in specific frequencies 2 to 4 kHz,16 and significantly increasing the risk of acquiring occupational hearing loss. In this context, noise cannot be considered the only threat to workers’hearing.1,3,8–11
Other studies suggest that workers exposed to solvents are more likely to acquire central auditory disorders. The studies conclude that the exclusive use of pure tone audiometry is insufficient to assess the auditory system (peripheral and central).6,10,17–20
Studies suggest that auditory damage (peripheral or cen-tral) is observed,11even though the exposures to each risk agent (noise and solvents) are within the limits permitted in Regulatory Norm (NR)-15 (noise: 85 dBA (Decibel – the
weightingfilter A) and solvents: 78 parts per million).16,21,22 The aim of this study was to evaluate the effects of simultaneous exposure to noise and solvents on hearing in workers.
Materials and Method
This is a transversal retrospective cohort study,23approved by the Ethics Committee on Human and Animal Research under number 000183/2009, with proper signatures on consent forms. The study was performed by documentary analysis for a metal graphics company that operates in the steel container market of paints, varnishes, and automotive fillers. The production sector operates in two brick-construction bar-racks, equipped with an exhaust system and a natural venti-lation system and with artificial and natural lighting systems. The total area of the company is 8,384.93 m2. The company offers specialized services in safety engineering and occupa-tional medicine and its 207 employees worked in two 8-hour shifts. The personal protective equipment, such as hearing protection, gloves, and masks, were provided and the staff signed receipts for this material.
We analyzed the following documents in the years 2009 to 2010: the Medical Control and Occupational Health Program, Program for the Prevention of Environmental Risks, Quanti-tative Environmental Assessment for Chemical Agents, Risk Map, and the staff’s medical records, including laboratory
tests and pure tone audiometry for the latest yearly exam (NR-7, NR-9, NR-15).24,25
Of the 207 workers, 108 were excluded. Inclusion criteria were: working in the production sector, absence of clinical audiological history, absence of exposure to noise or chem-icals outside work, normal meatoscopy, and exposure to solvents for more than 2 years (because there are reports in the literature that the time required for hearing disorders is triggered as a result of exposure to solvents at around 2 to 3 years16or even more than 5 years of exposure, and exposure to only noise can have side effects in the first 5 years of exposure).8,16Inclusion criteria for the control groups were: all volunteer participants without complaints or hearing impairment, without history of ear problems, and without exposure to noise and chemicals.
Thus, the study group consisted of 198 participants, in-cluding 134 males and 64 females, distributed according to the current occupational exposure to risk agents (noise and noise plus solvents). For the formation of the noise control group (CN) and noise and solvents control group (CNS), the database of the Department of Audiology at the University was used.
The participants were distributed in four groups:
• Noise group (NG): 42 subjects exposed only to noise
(standard levels of exposure equivalent to 85 to 93 dBA)
• Noise and solvents group (NSG): 57 subjects
simulta-neously exposed to noise (standard levels of exposure equivalent to 88 to 98 dBA) and solvents (aromatic hydro-carbons, toluene, xylene, turpentine, oils, greases, lead chromates and molybdates), considered to be below the tolerances set out in NR-1522
• CN: 42 subjects from the database of the Department of
Audiology at the Universidade Tuiuti do Paraná without noise and contaminants exposure
• CNS: 57 subjects from the database of the Department of
Audiology at the Universidade Tuiuti do Paraná, without noise and contaminants exposure
Because there were two different experimental groups (NG and NSG), each study group had their respective matched control group in terms of age and gender.
Due to this being a cross-sectional study, previous expo-sure was not controlled. We emphasize that none of these subjects presented auditory problems before starting work for the company, as the company’s policy is to only hire
employees with normal hearing thresholds.
The audiometric tests were classified according to the criteria of Appendix I of NR-7 (Ordinance 19) of the Ministry of Labor (1998).24Subjects with hearing thresholds above 25-dB hearing loss at frequencies of 3, 4, and/or 6 kHz and higher than other tested frequencies, whether the latter were altered or not, were considered to have hearing loss induced by high-intensity sound pressure levels.24
The group characteristics and the prevalence of hearing loss were analyzed. Descriptive analyses were performed on the basis of documentary analysis. For the characterization of workers in relation to the variables of age, gender, and duration of exposure to noise and noise and solvent with the results of audiometry, descriptive methods and the Mann-Whitney test were used, and ap value less than or equal to 0.05 was considered statistically significant.
Results
Ourfindings demonstrate the existence of a significant positive correlation between age and duration of exposure (i. e., the higher the age, the higher the exposure time: NG, p¼0.0001, and NSG,p¼0.0010).
►Table 2shows the results of the audiological evaluation groups, by ear, according to the classification proposed by Appendix I of NR-7 (Ordinance 19). Results showed that most participants in the subject groups, noise as well as noise and solvents, had normal hearing.
►Table 3shows the mean thresholds of the NG, NSG, CN,
and CNS as a function of gender. Significant values were observed in male workers in the NG at frequencies of 4 kHz bilaterally and 6 kHz in the left ear.
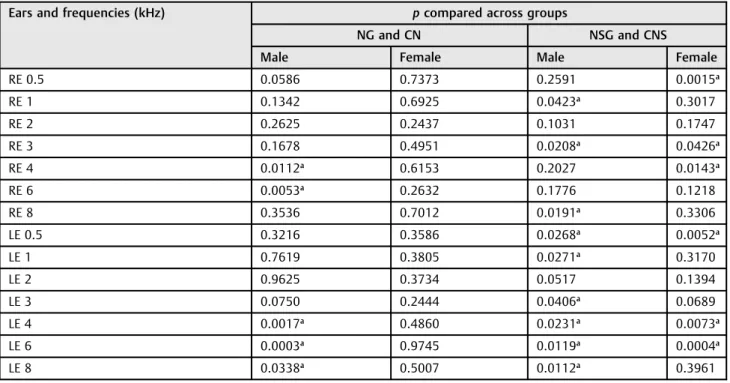
►Table 4shows the comparison of hearing thresholds of
NG, CN, NSG, and CNS as a function of gender. Significant values were observed in male workers in the NG at frequen-cies of 4 and 6 kHz bilaterally and 8 kHz in the left ear. In the NSG, significant differences were observed in both sexes for low as well as high frequencies.
►Table 5shows the comparison of hearing thresholds of
NG, CN, NSG, and CNS as a function of age. There was a statistically significant difference between the thresholds of the NSG especially in the 40- to 49-year age group.
Discussion
This study had a predominance of male subjects under 40 years of age and a time of exposure to risk agents of less than 9 years, which is common in most research in the occupational area, as these are developed exclusively with males working in the production phase.2,6,8,10,11,13,19,20
Aromatic hydrocarbons, toluene, turpentine, and xylene (mixed solvents) used in the evaluated industry are classified as ototoxic contaminants.3,4However, the concentration at which the study’s subjects are exposed, according to the
Quantitative Environmental Assessment, is below the toler-ances set out in NR-1522and American Conference of Gov-ernmental Industrial Hygienists (ACGIH).26
Research institutions such as National Institute for Occu-pational Safety and Health and ACGIH recommend that work-ers exposed to chemicals undergo audiometric testing.1,26In Brazil, labor legislation does not recommend periodic audio-metric examinations in workers exposed to ototoxic contam-inants except for those exposed to noise levels above 85 dBA for 8 hours per day.24 But Social Security Decree 3048 of May 6, 1999, recognizes some chemicals as risk factors for occupational hearing loss, suggesting that this type of expo-sure should be considered when evaluating the causal link between hearing loss and environment work conditions.27
Thefindings in►Tables 2and3lead us to the hypothesis that the noise effects outweigh the effects of solvents, and audiometry alone cannot identify early hearing loss (periph-eral and central) arising from exposure to noise and solvents, as suggested by some authors.3,5,20,21
When comparing male subjects exposed only to noise with controls, as shown in►Table 4, it is clear the influence of noise on hearing thresholds of participants agrees with other national studies.1,13This effect was not seen in female participants, which leads us to think that they are less susceptible to noise than males,28 that this difference may be related to the fact that changes in hearing happen earlier in men than in women as suggested by the literature,29or that women are more preven-tive than men and make better use of hearing protection.30
The same comparison was performed with the NSG and its respective controls (►Table 4), and it was noted that when the solvent was present and associated with noise, both the female and the male hearing thresholds were worse com-pared with the controls, strengthening the influence of the simultaneous action of noise and solvents on hearing.14,15
Thesefindings demonstrate that the effects of exposure to noise and solvents by gender manifest themselves differently to the effects of exposure to noise only and are consistent with other studies (►Table 4).9,13,14Thisfinding deserves further investigation, as most research on combined exposures of noise and environmental contaminants are developed exclu-sively for males.7,12,16,21,22
Table 1 Descriptive statistics of the groups according to age and time of exposure to noise and solvents (n¼198)
Groups Age (y) Time of exposure (y)
Average SD Minimum Maximum Average SD Minimum Maximum
NG 39.3 10.3 20.0 65.0 9.0 6.5 2 35
NSG 38.7 8.9 22.0 60.0 9.2 5.8 2 32
Abbreviations: NG, noise group; NSG, noise and solvent group; SD, standard deviation.
Table 2 Audiological assessment results, classified according to Appendix I of Regulatory Norm 7
Groups Right ear Left ear
Normal NIHL Others Normal NIHL Others
n % n % n % n % n % n %
NG 33 78.57 7 16.66 2 4.76 29 69.04 7 16.66 6 14.28
NSG 47 82.45 3 5.26 7 12.28 46 80.70 3 5.26 8 14.03
Importantly, in the group exposed to noise and solvents simultaneously, worsening thresholds occurred not only at high frequencies but also at low frequencies (►Table 4), which indicates that simultaneous exposure results in
sequelae in different regions of the cochlea.16In contrast, exposure to noise only left sequelae only at high frequen-cies (►Table 4), confirming data reported in Appendix I of NR-7.24
Table 3 Averages of hearing thresholds of groups according to gender (n¼198)
Ears and
frequencies (kHz)
Threshold averages—groups and gender (n)
NG CN NSG CNS
M (n¼30)
F (n¼12)
M (n¼30)
F (n¼12)
M (n¼37)
F (n¼20)
M (n¼37)
F (n¼20)
RE 0.5 11.8 10.4 8.7 9.6 12.4 11.3 8.1 9.5
RE 1 11.7 8.3 8.5 7.1 12.3 11.3 8.9 7.5
RE 2 10.2 9.6 8.2 7.1 12.4 10.8 8.0 6.8
RE 3 17.2 8.8 10.5 6.7 15.8 9.5 9.3 5.3
RE 4 23.2a
10.4 12.5 10.4 19.2 11.8 11.9 8.8
RE 6 22.8 15.8 13.3 15.0 20.7 17.0 13.4 13.3
RE 8 18.5 14.2 14.3 14.2 18.2 16.3 13.1 8.3
LE 0.5 10.3 8.6 8.3 10.0 13.5 12.0 8.1 8.0
LE 1 10.2 15.8 9.5 7.1 12.3 11.8 8.6 6.5
LE 2 11.8 15.4 9.7 5.8 13.9 10.3 8.4 6.0
LE 3 18.2 16.3 10.3 5.8 17.4 11.0 9.9 5.5
LE 4 26.2a
17.1 12.3 7.9 22.0 13.5 12.3 6.8
LE 6 27.2a
12.3 13.0 12.1 22.8 16.8 11.8 10.8
LE 8 22.5 12.3 13.7 10.0 20.5 14.8 14.6 8.3
Abbreviations: CN, control noise group; CNS, control noise and solvent group; LE, left ear; NG, noise group; NSG, noise and solvent group; RE, right ear. aStatistically signi
ficant (p<0.05), Mann-Whitney test.
Table 4 Comparing hearing thresholds of the four groups according to gender (n¼198)
Ears and frequencies (kHz) pcompared across groups
NG and CN NSG and CNS
Male Female Male Female
RE 0.5 0.0586 0.7373 0.2591 0.0015a
RE 1 0.1342 0.6925 0.0423a
0.3017
RE 2 0.2625 0.2437 0.1031 0.1747
RE 3 0.1678 0.4951 0.0208a
0.0426a
RE 4 0.0112a
0.6153 0.2027 0.0143a
RE 6 0.0053a
0.2632 0.1776 0.1218
RE 8 0.3536 0.7012 0.0191a
0.3306
LE 0.5 0.3216 0.3586 0.0268a
0.0052a
LE 1 0.7619 0.3805 0.0271a 0.3170
LE 2 0.9625 0.3734 0.0517 0.1394
LE 3 0.0750 0.2444 0.0406a
0.0689
LE 4 0.0017a
0.4860 0.0231a
0.0073a
LE 6 0.0003a
0.9745 0.0119a
0.0004a
LE 8 0.0338a
0.5007 0.0112a
0.3961
Abbreviations: CN, control noise group; CNS, control noise and solvent group; LE, left ear; NG, noise group; NSG, noise and solvent group; RE, right ear. aStatistically signi
In►Table 5, comparing the hearing thresholds with age, there was a statistically significant difference between the thresholds of the NSG in relation to CNS in participants ages 40 to 49, in accordance with the literature.28–30
During the research we found some limitations: (1) access only to the last regular audiometry exam and (2) access only to biological concentration (hippuric acid and methyl hippuric) of 19 subjects in the NSG, which ranged from 0.02 to 0.667 g/g of creatinine (hippuric acid) and from 0.001 to 0.58 g/g of creatinine (methyl hippuric acid). These limitations do not allow identification of hearing losses (onset or worsening of noise-induced hearing loss) and the realization of associations between audiologicalfindings and solvent concentration.
To prevent hearing loss in workers exposed to noise and solvents, the inclusion of this population in Hearing Conser-vation Programs is recommended, even when the concentra-tion of solvents and noise levels are below or within the limits of tolerance, because the combined effect may be additive.
Conclusion
Exposure to noise and solvents poses a risk to hearing. Females showed less susceptibility to noise than the males at frequencies of 4 kHz and 6 kHz; however, when exposed to solvents, female hearing was affected similarly to male hear-ing. The 40- to 49-year age group showed significant wors-ening in hearing thresholds of the NSG compared with CNS. The ongoing research on this issue is essential because there is strong evidence that hearing loss can be caused not only by noise but also by exposure to solvents or other environmental
contaminants.20,21Also recommended are new studies relat-ed to combinrelat-ed exposure by gender.
References
1 NIOSH—National Institute for Occupational Safety and Health.
Preventing occupational hearing loss—a practical guide. Pub. No. 96–110. Washington, DC: U.S. Department of Health and Human
Services; 1996
2 Lacerda ABM, Morata TC. O risco de perda auditiva decorrente da
exposição ao ruído associada a agentes químicos. In: Morata TC, Zucki F, ed. Saúde Auditiva—Avaliação de Riscos e Prevenção. São
Paulo, Brazil: Plexus; 2010:99–117
3 Morata TC, Little MB. Suggested guidelines for studying the
combined effects os occupational exposure to noise and chemicals on hearing. Noise Health 2002;14(4):73–87
4 Werner AF. Afecciones auditivas de origem ocupacional: de la
prevención a la rehabilitación. Buenos Aires, Brazil: Ed. Dosyuna; 2006
5 Morata TC. Promoting hearing health and the combined risk of
noise-induced hearing loss and ototoxicity. Audiol Med 2007; 5:33–40
6 Fuente A, Slade MD, Taylor T, et al. Peripheral and central auditory
dysfunction induced by occupational exposure to organic solvents. J Occup Environ Med 2009;51(10):1202–1211
7 Aylott S, Prasher D. Solvents impair balance in man. Noise Health
2002;4(14):63–71
8 Sliwinska-Kowalska M, Zamyslowska-Szmytke E, Szymczak W,
et al. Effects of coexposure to noise and mixture of organic solvents on hearing in dockyard workers. J Occup Environ Med 2004;46(1): 30–38
9 Kim J, Park H, Ha E, Jung T, Paik N, Yang S. Combined effects of
noise and mixed solvents exposure on hearing function among workers in the aviation industry. Ind Health 2005;43(3): 567–73
Table 5 Comparison of the groups according to age group (n¼198)
Ears and
frequencies (kHz)
Age group (y)
Under 30 30–39 40–49 50 and over
NGCN NSGCNS NG x CN NSGCNS NG x CN NSGCNS NGCN NSGCNS
RE 0.5 0.0241a
0.1553 0.1386 0.3503 0.0807 0.0010a
0.1074 0.7820
RE 1 0.0205a
0.7966 0.2331 0.5704 0.0862 0.0043a
h 0.5965 0.8378
RE 2 0.0477a
0.7142 0.5059 0.1781 0.0890 0.0028a
0.6927 0.1284
RE 3 0.0262a 0.5505 0.0471a 0.1194 0.0631 0.0008a 0.2165 0.1715
RE 4 0.2500 0.8823 0.3769 0.4321 0.0015a
0.0005a
0.2191 0.9481
RE 6 0.1141 0.8039 0.6168 0.1482 0.0011a
0.0442a
0.3347 0.6708
RE 8 0.0673 0.6244 0.3104 0.0617 0.2990 0.0147a
0.7968 0.5183
LE 0.5 0.5037 0.3720 0.1539 0.0583 0.1450 0.0042a 0.5117 0.3191
LE 1 0.5761 0.3175 0.4967 0.2645 0.8581 0.0532 0.3609 0.9470
LE 2 0.3429 0.6537 0.1236 0.3588 0.2495 0.0070a
0.3658 1.0000
LE 3 0.0510 0.4189 0.2670 0.9057 0.0116a
0.0012a
0.3668 0.4773
LE 4 0.0629 0.4334 0.6114 0.2610 0.0010a
0.0002a
0.0464a
0.3994
LE 6 0.1242 0.1554 0.1694 0.0028a
0.0021a
0.0010 0.0981 0.6493
LE 8 0.2544 0.9222 0.4853 0.0724 0.0647 0.0391 0.1961 0.9483
Abbreviations: CN, control noise group; CNS, control noise and solvent group; LE, left ear; NG, noise group; NSG, noise and solvent group; RE, right ear. aStatistically signi
10 Fuente A, McPherson B. Organic solvents and hearing loss: the
challenge for audiology. Int J Audiol 2006;45(7):367–381
11 Fuente A, McPherson B, Muñoz V, Pablo Espina J. Assessment of
central auditory processing in a group of workers exposed to solvents. Acta Otolaryngol 2006;126(11):1188–1194
12 Volpin A, Saia B. Interazione tra solventi e rumore: stato dell’arte. G
Ital Med Lav Ergon 2006;28(1):20–24
13 Botelho CT, Paz APML, Gonçalves AM, Frota S. Comparative study of
audiometrics tests on metallurgical workers exposed to noise only as well as noise associated to the handling of chemical products. Rev Bras Otorrinolaringol 2009;75(1):95–102
14 Mohammadi S, Labbafinejad Y, Attarchi M. Combined effects of ototoxic solvents and noise on hearing in automobile plant work-ers in Iran. Arh Hig Rada Toksikol 2010;61(3):267–274
15 Rizk SA, Sharaf NE. Health hazards among a sample of workers
exposed to a combination of noise and organic solvents in a fermentation factory in Egypt. Nature Sci 2010;8(6):95–99 16 Sliwinska-Kowalska M, Zamyslowska-Szmytke E, Szymczak W,
et al. Hearing loss among workers exposed to moderate concen-trations of solvents. Scand J Work Environ Health 2001;27(5): 335–342
17 Morata TC, Dunn DE, Kretschmer LW, Lemasters GK, Keith RW.
Effects of occupational exposure to organic solvents and noise on hearing. Scand J Work Environ Health 1993;19(4):245–254
18 Chang SJ, Chen CJ, Lien CH, Sung FC. Hearing loss in workers
exposed to toluene and noise. Environ Health Perspect 2006; 114(8):1283–1286
19 Morata TC. Interaction between noise and asphyxiants: a concern
for toxicology and occupational health. Toxicol Sci 2002;66(1):1–3 20 Fuente A, McPherson B. Central auditory processing effects
in-duced by solvent exposure. Int J Occup Med Environ Health 2007; 20(3):271–279
21 Fuente A, McPherson B. Central auditory damage induced by
solvent exposure. Int J Occup Saf Ergon 2007;13(4):391–397
22 Brasil. Normas regulamentadoras n° 15. Atividades e Operações
Insalubres. In: Segurança e Medicina do Trabalho. 56° ed. São Paulo, Brazil: Atlas; 2005
23 Vieira S, Hossne WS. Metodologia Científica para a Área da Saúde. Rio de Janeiro, Brazil: Ed. Campus; 2001
24 Brasil. Ministério do Trabalho. Secretaria de Saúde e Segurança no
Trabalho Portaria No. 19, de 9 de abril de 1998. Estabelece diretrizes e parâmetros mínimos para avaliação e acompanha-mento da audição em trabalhadores expostos a níveis de pressão sonora elevados. Diário Oficial da República Federativa do Brasil, Brasília (DF); 1998(Abr 9; Seção I):64–6
25 Brasil. Norma Regulamentadora n° 9—Programa de Prevenção de Riscos Ambientais. In: Segurança e Medicina do Trabalho. 56° ed. São Paulo, Brazil: Atlas; 2005
26 American Conference of Governmental Industrial Hygienists—
ACGIH. Threshold Limit Values for Chemical Substances and Physical Agents and Biological Exposure Indices 1998–1999.
Cin-cinnati, OH: ACGIH; 1999
27 Brasil. Ministério da Previdência e Assistência Social. Decreto n
3048, 12 maio 1999
28 Gates GA, Cooper JC Jr, Kannel WB, Miller NJ. Hearing in the
elderly: the Framingham cohort, 1983–1985. Part I. Basic audio-metric test results. Ear Hear 1990;11(4):247–256
29 Pearson JD, Morrell CH, Gordon-Salant S, et al. Gender differences
in a longitudinal study of age-associated hearing loss. J Acoust Soc Am 1995;97(2):1196–1205
30 Pinto NMC. Alternativa para análise longitudinal de resultados
audiométricos. In: Morata TC, Zucki F, eds. Caminhos para saúde Auditiva—Ambiental—Ocupacional. São Paulo, Brazil: Plexus;