Frequency Dependence Hearing Loss Evaluation
in Perforated Tympanic Membrane
Mohammed Radef Dawood
11Department of Otolaryngology, AL Mustansiriya University, College of Medicine, Baghdad, Iraq
Int Arch Otorhinolaryngol 2017;21:336–342.
Address for correspondence Mohammed Radef Dawood, FCIMS, Department of Otolaryngology, AL Mustansiriya University, College of Medicine, Baghdad 10001, Iraq (e-mail: [email protected]).
Introduction
In the normal ear the difference in sound pressure that develops between the external and the middle ear is respon-sible for sound transmission that causes the vibratory move-ments of the tympanic membrane and the lever action of the ossicles.1
In case there is a perforation in the tympanic membrane, this is going to reduce the surface area that is available for this sound pressure transmission. Therefore, the sound pressure gradient becomes effectively insignificant, as is determined by the loss of the impedance of the tympanic membrane. Thus,
when the movements of ossicles were hypothesized not im-paired, this hypothesis proposed that the only auditory struc-ture that is responsible for hearing loss in this case is the perforation of the tympanic membrane.2
In addition to this sound wave transmission across the middle ear cleft, and of special concern, it serves a pro-tective function that shields the round window niche from direct sound waves which is referred as “round window baffle”.3
This shielding effect is a matter of debate. Some studies do not support the hypothesis of a shielding effect of the tympanic membrane.1,4
Keywords
►
tympanic membrane
►
perforation
►
hearing loss
Abstract
Introduction
Tympanic membrane perforation is a relatively common problem that
predisposes patients to varying degrees of conductive hearing loss.
Objective
The objective of this study is to evaluate and analyze the frequency
dependence hearing loss in tympanic membrane perforation based on the size and
the site of perforation.
Methods
For the study, I selected 71 patients
’
(89) ears for the cross-sectional study
with tympanic membrane perforations; I examined the size and the site of perforations
under the microscope and classi
fi
ed them into small, moderate, large, and subtotal
perforations, and into anterior central, posterior central, malleolor central, and big
central perforations. I measured mean level of speech frequencies hearing loss, and its
relation with the site and the size of the perforation analyzed.
Results
The mean hearing loss at different sizes of the perforation at all speech
frequencies was 37.4 dB, with ABG of 26.6 dB, and its maximum loss was detected in
subtotal perforation of 42.3 dB, with ABG of 33.7 dB, at 500 Hz frequency, while in
relation to the sites, it was 38.2 dB, with ABG of 26.8 dB, and its maximum loss was
detected in big central site perforation of 42.1 dB, with ABG of 33.6 dB, at 500 Hz
frequency.
Conclusions
The hearing loss was proportionally related with the sizes of the
perforations, and the posterior site had greater impact on the hearing than anterior
site perforations. This was also applied to the frequency dependence hearing level, as
was detected to be worse at lower frequencies as 500 Hz, than those of 1000
–
2000 Hz.
received July 28, 2016 accepted November 3, 2016 published online February 28, 2017
DOI https://doi.org/ 10.1055/s-0037-1598597. ISSN 1809-9777.
Copyright © 2017 by Thieme Revinter Publicações Ltda, Rio de Janeiro, Brazil Original Research
So the pressure is increased by the ratio of the two areas, and it is considered the virtual factor in establishing the impedance transformation, since it is larger than that of the stapes footplate which is 3.2 mm2, the pressure exerted on
the stapes footplate is increased by 60/3.2¼18.75.5 Whereas, in the case of a perforation in the tympanic membrane, the sound stimulus might be insufficiently coupled to the tympanic membrane and the impedance transformer action might be lost. Then, the ability to move the middle ear ossicles might be impaired.6
The perforation of the tympanic membranes is a relatively common problem observed in ENT practice, and it usually results from various factors such as infection, trauma, and sometimes iatrogenic causes. It can predispose to conductive hearing loss, although its range usually does not exceed 50 dB (this is not surprising because 60 dB is the maximal conductive hearing loss). Moreover, hearing loss depends upon the frequency, perforation size, and air space volume of the middle ear.1 Various authors believe the site of the perforation has a significant impact on the level of the hearing loss,6 while other researchers believe that it has no significant effect.7
Given this divided conception, I set out to investigate the relationship between the site, the sizes of the tympanic membrane perforations, and the degree of the conductive hearing loss, with a view to contribute to the body of knowledge on this issue.
Hearing loss is a national health problem and has a significant impact on the person’s physical and psychosocial condition. Therefore, it is essential for early recognition and effective management of the tympanic membrane perfora-tion, since the untreated tympanic membrane perforation may lead to progressing destructive changes in the middle ear cavity, thus adding to further deterioration in the hearing threshold.8Also, the need for water protection to prevent infections is sometimes very troublesome.
The aim of the study was to evaluate and analyze the frequency dependence hearing loss in tympanic membrane perforation based on the size and site of perforation.
Patients and Methods
This is a cross-sectional study conducted at the ENT clinic from June 2015 to June 2016, which included 71 patients (89) ears complaining of hearing difficulty, attributed to their tympanic membrane perforations. I assessed the cases based on relevant history and full ENT examination and the selection was according to the following inclusion criteria; age above 18 years, history of the perforation was within one year of presentation, dry central type of tympanic membrane perforation for more than 3 months, middle ear cavity without abnormalities as cholesteatoma, polypi, or granulation tissue, intact ossicular chain was checked by paper patch test, functioning Eustachian tube was tested by Toynbee’s test via the impedance audiometer, mastoid status (no sign of mastoiditis), no middle ear surgery, a conductive deafness (with adequate cochlear reserve, i.e., not mixed hearing loss).
An examination of the ears was done under a Carl Zeiss microscope with 200 mm lenses. A single surgeon evaluated the size of the perforation by applying the software package AutoCAD classic 2015 program, which measured the total area of tympanic membrane and perforation, and calculated the percentage of the perforation according to the following formula:
Thus, the perforation of the tympanic membrane was classified as follows: small perforation when it constituted less than 25% of the whole tympanic membrane; moderate size perforation if constituted 25–50% of the whole tympanic membrane; large perforation when constituted 50–75% of the whole tympanic membrane; and subtotal perforation if constituted more than 75% of the whole tympanic membrane. The site of perforation was classified in relation to the handle of the malleus into: anterior central, posterior central, malleolar central, and the big central, when it involved all the quadrants of the tympanic membrane, as shown in►Fig. 1.
I assessed patients’hearing levels in decibel with AMBCO 650 clinical diagnostic pure tone audiometry, which was recently calibrated according to international organization of standardization (ISO) standard in a soundproof room at frequencies of 250, 500, 1000, 2000, 4000, and 8000 Hz, and the air. I assessed bone conduction hearing threshold with appropriate masking technique whenever required. I determined hearing level by calculating the mean (average) of air conduction and air-bone (ABG) at the speech frequen-cies of 500, 1000, and 2000 Hz.
The ethical and the scientific committee approved the study and participating patients gave their consent.
Statistical Analysis
I performed the statistical analysis using the software Statistical Package for Social Sciences (version 17; SPSS Inc, Chicago, Illinois, USA). The sites and sizes of the tympanic membrane perforations were separately corre-lated with the magnitude of hearing losses through Pear-son’s test. I express data as mean standard deviation (SD) for parametric data and as numbers and percent for non-parametric data. I applied the t-test wherever necessary, with the p value <0.05 being considered sta-tistically significant.
Results
The current study comprised of 71 patients (89 ears): 53 (74.6%) patients with unilateral ear involvement and 18 (25.3%) patients with bilateral ear involvement. There were 48 men (67.6%) and 23 women (32.3%); mean age was 27.579 (8.649) years. With regards to the etiology of the perforation, 73 ears (82%) were due to CSOM, and 16 ears (17.9%) resulted from old traumatic tympanic membrane perforation.
The distribution of frequencies of the sizes and the sites of the tympanic membrane perforation are shown in►Table 1 and►Table 2, respectively.
The mean hearing loss, irrespective to the sizes and the sites of the perforations and at all speech frequencies, was 37.8 dB. I analyzed the relation between the mean hearing loss and the size of the tympanic membrane perforation, which re-vealed a mean hearing loss of 32.2 dB in small size perforation, 36.4 dB in medium perforation, and 39.6 dB in large size perforation, whereas in subtotal perforation it was 41.5 dB.
The relation between the mean hearing loss and the site of the tympanic membrane perforation revealed that the mean hearing loss in anterior central perforation was 34.7 dB, in posterior central perforation was 37.8 dB, and in malleolar central perforation was 39.2 dB, while in the big central perforation it was 41.2 dB.
The relation between the mean hearing loss at different speech frequencies in 89 ears irrespective to the sizes and the sites of the tympanic membrane perforations was: 38.8 dB at 500 Hz frequency, 38.1 dB at 1000 Hz, and 37.8 dB at 2000 Hz. I analyzed the relation between the mean hearing loss at different speech frequencies and the sizes of the tympanic membrane perforation (►Table 3). The mean hearing loss at Table 1 Tympanic membrane perforation sizes
Size No. Percentage
Small 16 17.9%
Medium 21 23.5%
Large 23 25.8%
Subtotal 29 32.5%
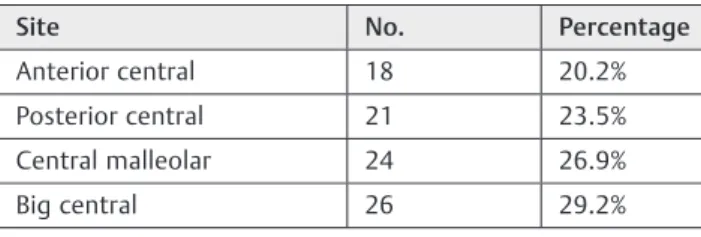
Table 2 Tympanic membrane perforation sites
Site No. Percentage
Anterior central 18 20.2%
Posterior central 21 23.5%
Central malleolar 24 26.9%
Big central 26 29.2%
Table 3 Hearing level distribution with speech frequencies among the sizes of the perforations
Size Hearing loss at 500 Hz
Hearing loss at 1000 Hz
Hearing loss at 2000 Hz
Mean hearing loss
pvalue
Small
mean 34 33.1 29.5 32.2 0.025
SD 3.273 6.942 11.791 5.35836
Medium
mean 37.1 36.3 35.8 36.4 0.003
SD 9.328 8.103 8.343 6.34011
Large
mean 39.7 39.6 39.5 39.6 0.006
SD 7.710 11.060 8.427 6.65332
Subtotal
mean 42.3 41.4 40.8 41.5 0.005
SD 8.168 11.392 9.996 8.21201
Total
mean 38.3 37.6 36.4 37.4 0.001
SD 9.527 11.183 9.361 8.08674
all frequencies irrespective to the sizes of the tympanic membrane perforation was 37.4 dB. The maximum hearing loss detected in subtotal perforation at 500 Hz frequency was 42.3 dB, while the minimum hearing loss detected in small size perforation at 2000 Hz frequency was 29.5 dB.
I studied the relation between the mean of the hearing loss at different speech frequencies and sites of the tympanic membrane perforation (►Table 4). The mean hearing loss at all frequencies irrespective to the sites of the tympanic membrane perforation was 38.2 dB. I detected a maximum hearing loss of 42.1 dB in big central perforation at 500 Hz frequency, and minimum hearing loss of 31.8 dB in anterior site perforation at 2000 Hz frequency.
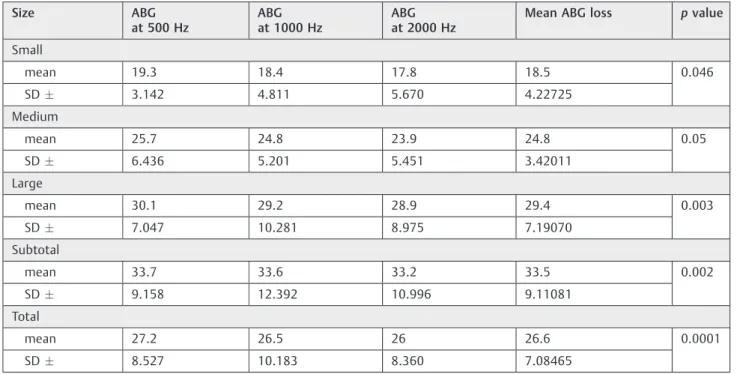
I also used another audiometric parameter in the assess-ment of the hearing loss, which was the air-bone gap (ABG). The results showed mean ABG level at all speech frequencies irrespective to the sizes and the sites of the perforation of 26.7 dB.
The relation of the ABG measurement in different speech frequencies for comparison with different sizes of the tym-panic membrane perforation was shown in►Table 5, where the the maximum ABG level irrespective to the all speech frequencies was 33.5 dB in subtotal perforation, and mini-mum ABG level was 18.5 dB in small size perforation. As for the relation to specific speech frequency, the maximum ABG detected with subtotal size perforation 33.7 dB at 500 Hz frequency, and minimum ABG detected with small size perforation was 17.8 dB at 2000 Hz frequency.
ABG measurements for comparison with different sites of the tympanic membrane perforation in relation with the speech frequencies are shown in ►Table 6. The maximum ABG detected irrespective of the frequencies was 33.4 dB in big central perforation, and minimum ABG was 19.4 dB in anterior central perforation. As for specific speech frequency;
the maximum ABG was detected with big central perforation 33.6 dB at 500 Hz frequency, and minimum ABG was detected with anterior central perforation 18.8 dB at 2000 Hz frequency.
Discussion
The tympanic membrane plays an important role in the tympano-ossicular system for sound transmission in the middle ear.
Perforation of the tympanic membrane is one of the main causes of conductive hearing impairment, and its magnitude is usually less than 50 dB.1
In the current study, 82% of the perforations resulted from CSOM. This high incidence was probably related to patients’
poor cultural and socioeconomic level, as well as their life style. Thisfinding is in agreement with that from Biswas et al.9
The current study’s results for maximum frequencies of tympanic membrane perforation detected in subtotal sized and big central located perforations as well as for mean hearing loss in all enrolled ears, irrespective to the site and the size parameters, was almost comparable with those of Nahata et al10and Ristovska et al.11
The current study had revealed a linear correlation be-tween the sizes of the perforation and the hearing loss, as the highest degree of hearing loss detected with subtotal size perforation with the air conduction was 41.5 dB with an ABG of 33.5 dB. Thus, the greater the increase in the size of the tympanic membrane perforation meant a steeper decline in auditory perception. This observation is supported by several studies,2,8,12,13and the explanation for it is attributable to the impedance matching impairment of the hydraulic action of the tympanic membrane, as it is related to the reduction in Table 4 Hearing level distribution with speech frequencies among perforation sites
Site Hearing loss at 500 Hz Hearing loss at 1000 Hz Hearing loss at 2000 Hz Mean hearing loss pvalue
Anterior central
mean 36.4 35.9 31.8 34.7 0.04
SD 3.361 2.653 6.251 2.01765
Posterior central
mean 38.7 37.8 36.9 37.8 0.003
SD 7.473 12.554 9.129 8.11767
Central malleolar
mean 40 39.1 38.5 39.2 0.002
SD 7.192 7.415 9.416 4.89134
Big central
mean 42.1 41.2 40.3 41.2 0.001
SD 8.289 11.648 11.569 8.7291
Total
mean 39.3 38.5 36.9 38.2 0.0001
SD 8.527 10.183 8.360 7.18465
its surface area as compared with that of the stapedial footplate. Thus, there was reduction in the ossicular coupling due to the sound pressure difference that had been abolished across the tympanic membrane, which resulted in a decrease of sound amplification, and therefore had significant impact on auditory perception.14
However, there is little consensus between various authors on the effect of the site of the perforation on the hearing
threshold. In the current study, the level of the hearing loss detected in posterior central sited perforation was 37.8 dB, with ABG of 25.6 dB, while that at the anterior central site perforation was 34.7 dB, with ABG of 19.4 dB. This result was statistically significant with P value of 0.001. The central malleolar and the big central were not included in this comparison, since they involved both areas. Ourfinding was in agreement with other studies,4,10,15and results were likely Table 5 Mean ABG with different perforation sizes in relation to speech frequencies
Size ABG at 500 Hz
ABG at 1000 Hz
ABG at 2000 Hz
Mean ABG loss pvalue
Small
mean 19.3 18.4 17.8 18.5 0.046
SD 3.142 4.811 5.670 4.22725
Medium
mean 25.7 24.8 23.9 24.8 0.05
SD 6.436 5.201 5.451 3.42011
Large
mean 30.1 29.2 28.9 29.4 0.003
SD 7.047 10.281 8.975 7.19070
Subtotal
mean 33.7 33.6 33.2 33.5 0.002
SD 9.158 12.392 10.996 9.11081
Total
mean 27.2 26.5 26 26.6 0.0001
SD 8.527 10.183 8.360 7.08465
Abbreviations: ABG, air bone gap; Hz, Hertz; SD, standard deviation.
Table 6 Mean ABG with different perforation sizes in relation to speech frequencies
Site ABG at 500 Hz
ABG at 1000 Hz
ABG at 2000 Hz
Mean ABG loss pvalue
Anterior central
mean 20.1 19.3 18.8 19.4 0.06
SD 4.583 3.875 3.471 3.22987
Posterior central
mean 26.3 25.6 24.9 25.6 0.002
SD 6.582 11.665 8.239 7.23879
Central malleolar
mean 28.9 28.8 28.4 28.7 0.003
SD 7.192 7.415 9.416 4.89134
Big central
mean 33.6 33.4 33.2 33.4 0.007
SD 8.298 11.648 11.569 8.72391
Total
mean 27.2 26.8 26.4 26.8 0.0001
SD 8.527 10.183 8.361 7.08464
due to the impairment of the potential effect of the“round window baffle” on hearing threshold. Other studies,12,13,16 however, did not detect any significant differences in hearing loss in anterior versus posterior site of the perforations. Mehta et al2in their study also stated that hearing loss did not vary substantially with site of the perforation and any such varia-tion was negligible. Thus, the shielding effect remains a subject of debate.4
Most of the research that analyzes the relationship be-tween the perforations in the tympanic membrane and hearing thresholds at various frequencies concludes that hearing loss is frequency dependent, with most maximum losses detected at the lower frequencies.17The current study reveals the same observations, that is, hearing loss was greater at lower frequencies, and decreased as the frequency increased, as the maximum hearing loss at 500 Hz frequency was 38.8 dB in air conduction hearing loss, and 27.2 dB in ABG level. Our results were in agreement with international studies, as those of Nahata et al,10Ristavska et al,11those on temporal bones by Ahmad and Ramani,14Bigelow et al18on rats, in the clinical studies of Bhusal et al,19Omari, and Al-Doski.20
Lerut et al,21in their study, revealed that the frequency pattern was similar to an“inverted V shape”at the audio-gram, with a turning point around 2000Hz, as the ABG (hearing loss) at frequencies below the 2000Hz frequency were larger than those above 2000 Hz frequency. Simlarly, Nahata et al10concluded that the inherent frequency of the tympanic membrane had been calculated to beat 2000 Hz, since the tympanic membrane vibrates the most at this frequency. Röösli et al,22 however, observed that hearing loss at 2000 Hz frequency cannot be explained by tympanic membrane perforation alone. Nonetheless, it is worth noting here that I did not include the frequencies above 2000 Hz in the calculation of the hearing threshold in the current study.
The study by Austin23disagreed with ourfinding, as he concluded that the presence of the perforation did not have a significant impact on frequency dependent hearing loss. His audiometric pattern revealed a flat curve pattern at all speech frequencies (500, 1000, 2000 Hz), as well as in relation to each size of tympanic membrane perforation. Since there was no further detailed information on his study, it is difficult to devise an explanation for the differences in results for both studies.
The outcome of this study will provide a better under-standing of hearing loss attributed to tympanic membrane perforation. This can help specialists manage such cases more efficiently, given that hearing loss represents a major health problem and this is the time to educate people on its severe consequences.
Conclusions
The level of the hearing loss was proportionately related with the size of the tympanic membrane perforation. Moreover, the posterior sited perforation had greater impact on the threshold of the hearing than those with anterior sited
location. The same applied to the frequency dependence of hearing loss, as detected at lower speech frequencies. The results of the study indicated that hearing loss was worse at lower frequencies, such as 500 Hz, than at higher frequen-cies, such as 1000–2000 Hz, irrespective of the sizes and sites of the tympanic membrane perforations.
Conflicts of interest
Author declares no conflict of interest.
References
1 Voss SE, Rosowski JJ, Merchant SN, Peake WT. Middle-ear function with tympanic-membrane perforations. I. Measurements and mechanisms. J Acoust Soc Am 2001;110(3 Pt 1):1432–1444 2 Mehta RP, Rosowski JJ, Voss SE, O’Neil E, Merchant SN.
Determi-nants of hearing loss in perforations of the tympanic membrane. Otol Neurotol 2006;27(02):136–143
3 Ogisi FO, Adobamen P. Type 1 Tympanoplasty in Benin: a 10-year review. Niger Postgrad Med J 2004;11(02):84–87
4 Voss SE, Rosowski JJ, Merchant SN, Peake WT. How do tympanic-membrane perforations affect human middle-ear sound trans-mission? Acta Otolaryngol 2001;121(02):169–173
5 Pickles JO. Physiology of hearing. In: Scott-browns Otolaryngol-ogy. Michael Gleeson, George GB, Martin JB, Ray C, John H, Nicholas SJ, et al editors. 7th ed. London: Hodder Arnold; 2008: 3181
6 Peake WT, Rosowski JJ, Lynch TJ III. Middle-ear transmission: acoustic versus ossicular coupling in cat and human. Hear Res 1992;57(02):245–268
7 Roland NJ, McRae RDR, Mc Combe AW. Chronic suppurative otitis media. In: Key topics in Otolaryngology and head and neck surgery. 2nd ed. Wales, Bios scientific publishers; 2001: 38–41
8 Pannu KK, Chadha S, Kumar D, Preeti. Evaluation of hearing loss in tympanic membrane perforation. Indian J Otolaryngol Head Neck Surg 2011;63(03):208–213
9 Biswas SS, Hossain A, Alam M, Atiq T, Al-Amin Z. Hearing evaluation after myringoplasty. Bangladesh J Otorhinolaryngol. 2010;16(01):23–28
10 Nahata V, Patil CY, Patil RK, Gattani G, Disawal A, Roy A. Tympanic membrane Perforation: Its correlation with hearing loss and frequency affected - An analytical study. Indian J of Otology. 2014;20(01):10–15
11 Ristovska L, Jachova Z, Filipovski R, Atanasovska N. Correlation between tympanic membrane perforation. JSER 2016;17(02): 36–49
12 Rafique M, Farrukh MS, Shaikh FS. Assessment of hearing loss in tympanic membrane perforation at tertiary care hospitals. JLUMHS 2014;13(01):32–36
13 Park H, Hong SN, Kim HS, et al. Determinants of conductive hearing loss in tympanic membrane perforation. Clin Exp Otor-hinolaryngol 2015;8(02):92–96
14 Ahmad SW, Ramani GV. Hearing loss in perforations of the tympanic membrane. J Laryngol Otol 1979;93(11):1091–1098 15 Nepal A, Bhandary S, Mishra SC, Singh I, Kumar P. The morphology
of central tympanic membrane perforations. Nepal Med Coll J 2007;9(04):239–244
16 Ibekwe TS, Ijaduola GT, Nwaorgu OG. Tympanic membrane perforation among adults in West Africa. Otol Neurotol 2007; 28(03):348–352
18 Bigelow DC, Swanson PB, Saunders JC. The effect of tympanic membrane perforation size on umbo velocity in the rat. Laryngo-scope 1996;106(1 Pt 1):71–76
19 Bhusal CL, Guragain RP, Shrivastav RP. Frequency dependence of hearing loss with perforations. JNMA J Nepal Med Assoc 2007; 46(168):180–184
20 Al-Omari AF, Al-Doski FS. Effect of the size of tympanic mem-brane perforation on hearing. Tikrit J Pharma Sci. 2013;9(01): 154–161
21 Lerut B, Pfammatter A, Moons J, Linder T. Functional correlations of tympanic membrane perforation size. Otol Neurotol 2012; 33(03):379–386
22 Röösli C, Sim JH, Chatzimichalis M, Huber AM. How does closure of tympanic membrane perforations affect hearing and middle ear mechanics? An evaluation in a patient cohort and temporal bone models. Otol Neurotol 2012;33(03):371–378