Characterization of Hearing Thresholds from 500
to 16,000 Hz in Dentists: A Comparative Study
Claudia Giglio de Oliveira Gonçalves
1Luciana Santos
1Diolen Lobato
1Angela Ribas
1Adriana Bender Moreira Lacerda
1Jair Marques
1,21Post-Graduation Program in Communication Disorders, Universidade Tuiuti do Paraná, Curitiba, Paraná, Brazil 2Department of Audiology, Universidade Tuiuti do Paraná,
Curitiba, Brazil
Int Arch Otorhinolaryngol 2015;19:156–160.
Address for correspondence Claudia Giglio de Oliveira Gonçalves, MSc, PhD, Universidade Tuiuti do Paraná, Rua Sidenei Antonio Rangel Santos, 238 Curitiba, Paraná 82010330, Brazil
(e-mail: [email protected]).
Introduction
Noise is present in different environments of human society, including the workplace, and may cause irreversible damage to the human body.1Loud noise is present in dentists’workplaces, whether from the clinical equipment used, such as dental drills, suction tubes, amalgamators, air compressors (when located in the room), suction pumps, autoclaves, and air conditioners, or
from external sources, such as ambient noise including traffic from nearby vehicles and other urban noise.2–4
High-level noise exposure may damage the auditory sys-tem in dentists. Since the 1950s, some studies have shown high sound pressure levels in high-speed equipment in dentists’workplaces.5In 1959, the American Dental Associa-tion recommended periodic audiological evaluaAssocia-tions for den-tists due to noise exposure.6
Keywords
►
noise induced
►
dentist
►
hearing loss
Abstract
Introduction
High-level noise exposure in dentists
’
workplaces may cause damages to
the auditory systems. High-frequency audiometry is an important tool in the
investiga-tion in the early diagnosis of hearing loss.
Objectives
To analyze the auditory thresholds at frequencies from 500 to 16,000 Hz of
dentists in the city of Curitiba.
Methods
This historic cohort study retrospectively tested hearing thresholds from
500 to 16,000 Hz with a group of dentists from Curitiba, in the state of Paraná, Brazil.
Eighty subjects participated in the study, separated into a dentist group and a control
group, with the same age range and gender across groups but with no history of
occupational exposure to high levels of sound pressure in the control group. Subjects
were tested with conventional audiometry and high-frequency audiometry and
an-swered a questionnaire about exposure to noise.
Results
Results showed that 81% of dentists did not receive any information regarding
noise at university; 6 (15%) dentists had sensorineural hearing impairment; signi
fi
cant
differences were observed between the groups only at frequencies of 500 Hz and 1,000,
6,000 and 8,000 Hz in the right ear. There was no signi
fi
cant difference between the
groups after analysis of mean hearing thresholds of high frequencies with the average
hearing thresholds in conventional frequencies; subjects who had been working as
dentists for longer than 10 years had worse tonal hearing thresholds at high frequencies.
Conclusions
In this study, we observed that dentists are at risk for the development of
sensorineural hearing loss especially after 10 years of service.
received
April 1, 2014
accepted after revision
July 23, 2014
published online
November 28, 2014
DOI http://dx.doi.org/ 10.1055/s-0034-1390138.
ISSN 1809-9777.
Copyright © 2015 by Thieme Publicações Ltda, Rio de Janeiro, Brazil
Many studies showed that dentists are at risk of developing noise-induced hearing loss (NIHL).7–10The damage caused by exposure affects the inner ear and causes an irreversible hearing loss. The auditory thresholds show a classic sign of NIHL in the audiometric notch at the frequencies in the range between 3 and 6 KHz.11–13
Because early diagnosis of NIHL is prioritized, additional audiological tests are used to add value to basic audiological evaluations; among them, high-frequency audiometry (from 8,000 Hz) is used.14Studies show that high-frequency audi-ometry is an important tool in the investigation of the basal cochlear response as well as an instrument that helps in the early diagnosis of NIHL.15–18Research using high-frequency audiometry has suggested that with increasing noise expo-sure and age on dentists, there is a decrease in auditory thresholds.9,19–21
As a result of these considerations, this study aimed to analyze the auditory thresholds at frequencies from 500 to 16,000 Hz of dentists in the city of Curitiba.
Methods
This historic cohort study retrospectively tested hearing thresholds from 500 to 16,000 Hz in a group of dentists from Curitiba, in the state of Paraná, Brazil. The study took place from August to December 2011.
The dentists’time of professional practice was considered in the analysis. The auditory threshold of dentists was also compared with a group of subjects with the same age range and gender, but with no history of occupational exposure to high levels of sound pressure (control group).
This study was approved by the Ethics Research Commit-tee, number 017/2008. The procedures were performed after each participant signed the informed consent form—TCLE (Resolution MS/CNS/CNEP, Number 196/96, October 10, 1996). Subjects were excluded if they had compromised middle ear or previous hearing damage.
To be included in the dentist group, the subject had to be an active dentist. To be included in the control group, subjects had to not be exposed to occupational noise and to be of the same sex and age as one of the dentists for paired data.
The group of dentists was composed of 40 subjects, 10 men and 32 women. The subjects’ages ranged from 23 to 61 years (mean 40.55 years, standard deviation 9.87 years, median 41.5 years) and time of practice was 1 to 39 years (mean 16.32 years and standard deviation 9.67 years). Sub-jects in the dentists’group worked 6 to 12 hours daily, but this variable was not considered in this study because accurate noise exposure assessments in hours/years are difficult in such cases. All participants were handed a questionnaire about noise exposure.
The control group had a total of 40 subjects. This group was composed of students and subjects from different professional activities who did not present noise exposure. They were all volunteers who were invited to participate in this study. For the analysis of the data, each subject from control group was matched one-to-one with someone from the group of dentists. All 80 subjects submitted to ear canal inspection to rule out possible obstructions that could compromise the hearing test. All subjects were at acoustic rest for at least 14 hours before audiometry.
Pure tone hearing thresholds were tested by conventional audiometry (frequencies from 500 to 8,000 Hz using a Mad-sen Itera II model audiometer (GN Otometrics Schaumburg, IL, USA), calibrated according to the International Organiza-tion of Standards 389/64 standards) and high-frequency audiometry with the same equipment but with HDA 200 headphones (Sennheiser, Old Lyme, CT, USA) with a sound intensity in decibels hearing loss (dB HL), frequency 9,000 to 16,000 Hz, calibrated according to the American National Standards Institute S3.6/69.
The hearing normality criterion was defined for aerial tone hearing thresholds up to 25-dB HL for the frequency rate of 500 to 8,000 Hz. In the case of changes in pure tone air conduction thresholds, pure tone audiometry was performed by bone conduction.22
For the analysis of high-frequency hearing thresholds (from 9,000 Hz), as there are no standardized normal results, we used the group of subjects not exposed to occupational noise (control group) for comparison with the group of dentists.
Statistical methods that enabled the determination of significant audiologic assessment between groups’ results
Table 1 Conventional hearing thresholds in the groups (n¼80)
Frequency (Hz) Right ear Left ear
Dentists Controls p Dentists Controls p
Avg σ Avg σ Avg σ Avg σ
500 15.12 3.84 9.00 5.09 0.0000a 17.00 3.89 9.25 6.26 0.0000a
1,000 12.00 5.04 8.50 5.91 0.0056a 10.00 4.94 9.38 6.12 0.6164
2,000 9.25 6.36 7.38 5.43 0.1601 7.87 7.15 7.63 7.34 0.8778
3,000 7.38 7.59 6.75 6.06 0.6850 7.88 6.59 10.25 7.07 0.1241
4,000 9.62 9.63 7.75 7.07 0.3240 9.37 8.26 10.37 8.04 0.5847
6,000 18.63 12.86 12.75 9.27 0.0216a 19.25 11.30 15.38 7.02 0.0691
8,000 15.75 13.71 10.63 8.49 0.0478a 15.50 15.01 15.63 7.94 0.9630
Abbreviations: Avg, average;σ, standard deviation. aSigni
were used for data analysis, considering a 0.05 significance level (5%).
Descriptive statistics were applied. Studentttest was used to compare the thresholds of the groups and the analysis of tonal hearing thresholds as a relation of time of service in years for dentists’group.
Results
Forty dentists from Curitiba took the hearing tests and answered a questionnaire about exposure to noise in their workplace. We observed that 81% of dentists did not receive any information regarding noise during their academic training; however, 51% said they knew the effects of noise on health. All (100%) acknowledged the existence of noise in their workplace, and 54% believe that noise to be of medium intensity and 24% believe it to be of loud intensity. Only two dentists used hearing protection devices.
Six (15%) dentists had sensorineural hearing impairment, only 1 (2.5%) with unilateral hearing loss (left ear) and 1 (2.5%) individual with hearing impairment among the group not exposed to occupational noise.
Auditory thresholds for the 40 dentists were analyzed and compared with the group of 40 subjects not exposed to occupational noise. Comparison of hearing thresholds in conventional frequencies between groups is shown
in►Table 1. There were differences between the frequencies
of 500 Hz in both ears and in 1,000, 6,000, and 8,000 Hz for the right ear; results were worse in dentists compared to controls.
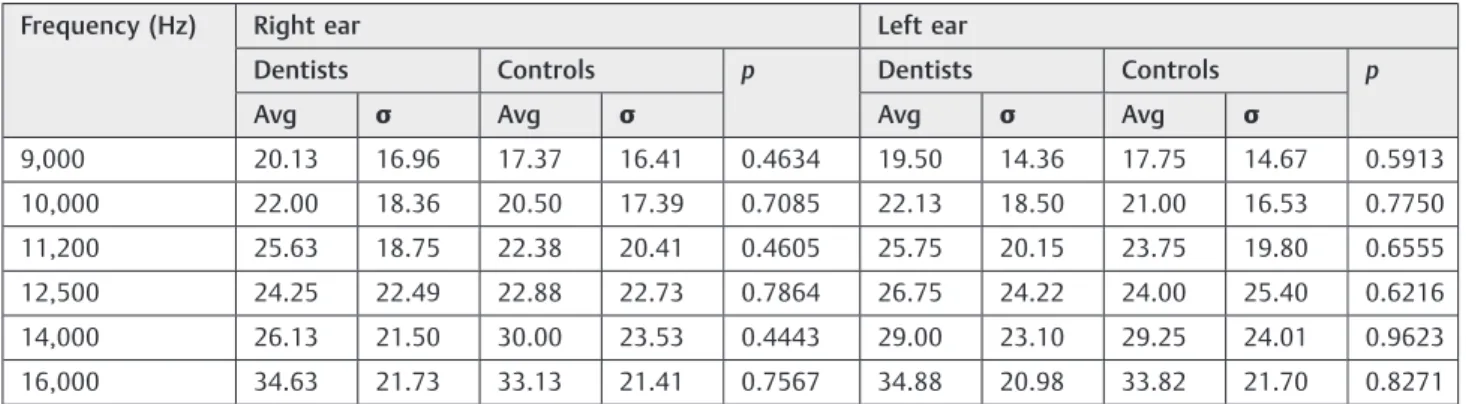
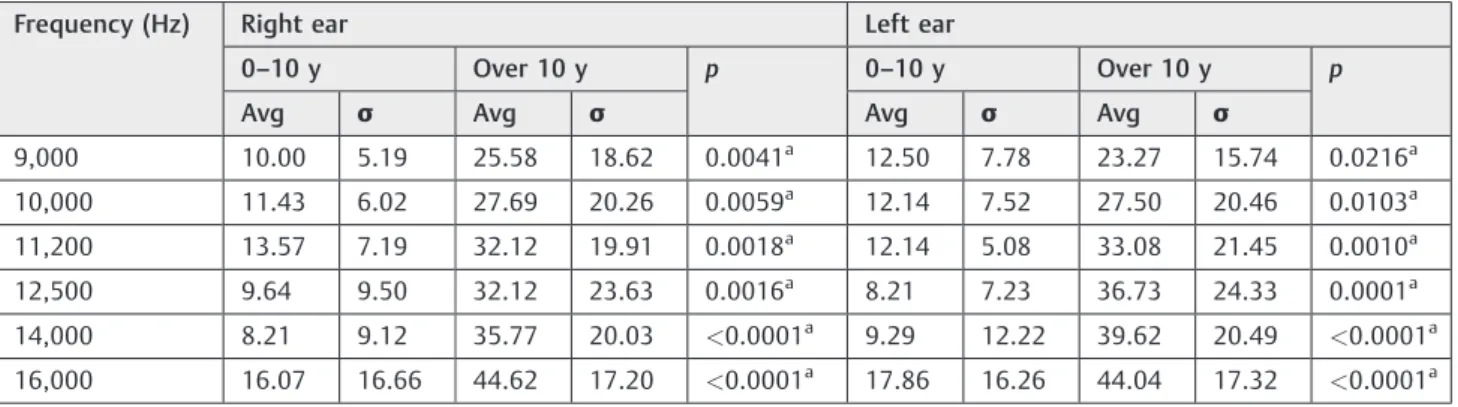
The results of pure tone hearing thresholds at higher frequencies are shown in►Table 2. No differences between the groups for the high frequencies were observed. To compare conventional and high-frequency auditory thresh-olds, dentists were separated into two groups: those with over 10 years of experience and those with less than 10 years, shown in►Tables 3and4. Differences were noted between the frequencies of 2,000, 4,000, and 6,000 Hz for the right ear, and the average conventional auditory tone thresholds were worse among those with more than 10 years of experience.
There was no difference at all for frequencies in both ears, and those who had been working as dentists for longer than 10 years had worse tonal hearing thresholds at high frequencies.
Table 3 Conventional thresholds among dentists with time in service of up to 10 years (n¼14) and over 10 years (n¼26)
Frequency (Hz) Right ear Left ear
0–10 y Over 10 y p 0–10 y Over 10 y p
Avg σ Avg σ Avg σ Avg σ
250 13.21 4.21 14.62 4.88 0.3705 18.21 5.41 15.19 5.00 0.0842
500 13.93 2.89 15.77 4.17 0.1503 17.50 5.10 16.73 3.14 0.5576
1,000 11.43 4.57 12.31 5.33 0.6051 10.36 4.14 9.81 5.38 0.7417
2,000 6.07 5.25 10.96 6.33 0.0183a 6.79 5.41 8.46 7.97 0.4868
3,000 4.29 4.32 9.04 8.49 0.0580 6.43 6.02 8.65 6.86 0.3147
4,000 4.29 3.85 12.50 10.61 0.0083a 6.43 5.35 10.96 9.17 0.0982
6,000 13.21 6.96 21.54 14.41 0.0495a 15.71 8.29 21.15 12.35 0.1487
8,000 10.00 6.79 18.85 15.51 0.0502 10.71 6.46 18.08 17.61 0.1411
Abbreviations: Avg, average;σ, standard deviation. aSigni
ficant differences between the mean thresholds according to Studentttest at a significance level of 0.05.
Table 2 High-frequency hearing thresholds in the groups (n¼80)
Frequency (Hz) Right ear Left ear
Dentists Controls p Dentists Controls p
Avg σ Avg σ Avg σ Avg σ
9,000 20.13 16.96 17.37 16.41 0.4634 19.50 14.36 17.75 14.67 0.5913
10,000 22.00 18.36 20.50 17.39 0.7085 22.13 18.50 21.00 16.53 0.7750
11,200 25.63 18.75 22.38 20.41 0.4605 25.75 20.15 23.75 19.80 0.6555
12,500 24.25 22.49 22.88 22.73 0.7864 26.75 24.22 24.00 25.40 0.6216
14,000 26.13 21.50 30.00 23.53 0.4443 29.00 23.10 29.25 24.01 0.9623
16,000 34.63 21.73 33.13 21.41 0.7567 34.88 20.98 33.82 21.70 0.8271
Discussion
In researching information on the effects of exposure to noise at work for dentists, it was observed that most had no training about noise in their formal education and 50% of the subjects knew the harmful effects of noise on health; however, only two dentists claimed to use hearing protection device even though they recognized that there was noise at work. Such
findings corroborate another study in which 48 dentists, ages 22 to 55, participated, with only one reporting the use of hearing protection.23
In another study on the perception of noise from dentists, 49% of the 163 professionals surveyed felt that the noise in their workplace was of medium intensity. Only 3% knew the effects of noise on health and used hearing protection.10
Even with the presence of noise in the dentist’s workplace, a lack of information is still dominant regarding the educa-tional process for these professionals, and the lack of hearing health is shown in the low level of use of protection.
In the present study, we observed 6 (15%) cases of dentists with sensorineural hearing impairment. Other studies have found cases of hearing loss in dentists in various percentages. In a study conducted in the city of Cascavel, Paraná, with 85 dentists between 25 and 60 years of age and of both genders, 43.5% were found to have audiograms suggestive of NIHL.9In another study of 198 dentists in the state of Paraná, 27% had sensorineural hearing loss suggestive of NIHL.10 Another study in Recife of 50 dental professionals of both genders aged between 25 and 54, and with work experience between 3 and 29 years, found 28 (56%) dentists had hearing loss.24In a study in the city of João Pessoa with 48 dentists, conventional audiometry was performed and 52.17% subjects had bilateral hearing loss, taking into account the frequencies of 3, 4, and 6 kHz.23
Dentists had lower mean hearing thresholds than the control group, and in the right ear, this difference was significant at frequencies of 500, 1,000, 6,000, and 8,000 Hz
(►Table 1). A study with dentists in Bauru, Sao Paulo, also
found the right ear to have worse hearing thresholds than the left ear.21Other studies identified dentists presenting worse
thresholds in their left ears.25,26In relation to the laterality of the hearing thresholds, an unexpectedfinding was that the dentists’group had worse hearing thresholds in the right ear, because both ears are exposed to the noise simultaneously. Future research needs to address this issue.
Even considering that hearing thresholds at high fre-quencies were higher than those at conventional frequen-cies, there was no difference between the groups. Studies analyzing high-frequency audiometry in dentists observed a predisposition to hearing impairment; however, in these studies control groups were not used as a comparison to dentists.9,21
After 10 years of working as a dentist, there were reduced hearing thresholds in conventional audiometry for the right ear at frequencies of 2,000, 4,000, and 6,000 Hz, configured as an acoustic notch characteristic of hearing loss due to exposure to high sound pressure levels. In dentists with over 10 years’experience, all high frequencies showed significant worsening. Thesefindings corroborate research that found that older workers with a longer time of service are most vulnerable to hearing impairment.9,27It is noteworthy that the age factor may also affect the results, especially in high-frequency hearing thresholds, because those with longer service as a dentist are also older.23,28
Conclusion
This study showed that dentists are at risk for the develop-ment of sensorineural hearing loss, especially after 10 years of service. However, there were significant differences between the group of dentists and the control group (which was not exposed to occupational noise) only at frequencies of 500 Hz in both ears and 1,000, 6,000 and 8,000 Hz in the right ear. Even with the average hearing thresholds at high frequencies being worse than in conventional frequencies, there were no significant differences between groups.
We suggest further studies to compare groups exposed to and not exposed to occupational noise to better understand the pattern of hearing damage.
Table 4 Thresholds at high frequencies among dentists with time in service of up to 10 years (n¼14) and over 10 years (n¼26)
Frequency (Hz) Right ear Left ear
0–10 y Over 10 y p 0–10 y Over 10 y p
Avg σ Avg σ Avg σ Avg σ
9,000 10.00 5.19 25.58 18.62 0.0041a 12.50 7.78 23.27 15.74 0.0216a
10,000 11.43 6.02 27.69 20.26 0.0059a 12.14 7.52 27.50 20.46 0.0103a
11,200 13.57 7.19 32.12 19.91 0.0018a 12.14 5.08 33.08 21.45 0.0010a
12,500 9.64 9.50 32.12 23.63 0.0016a 8.21 7.23 36.73 24.33 0.0001a
14,000 8.21 9.12 35.77 20.03 <0.0001a 9.29 12.22 39.62 20.49 <0.0001a
16,000 16.07 16.66 44.62 17.20 <0.0001a 17.86 16.26 44.04 17.32 <0.0001a
Abbreviations: Avg, average;σ, standard deviation. aSigni
References
1 Souto Souza NS, Carvalho FM, de Cássia Pereira Fernandes R. Hipertensão arterial entre trabalhadores de petróleo expostos a ruído. Cad Saude Publica 2001;17(6):1481–1488
2 Ribas A, Scmidt A, Ronconi E. Conforto ambiental e o ruído urbano como risco ambiental: a percepção de moradores dos setores especiais estruturais da cidade de Curitiba. Desenvolvimento e Meio Ambiente 2010;21:183–199
3 Lourenço EA, Berto JMR, Duarte SB, Greco JPM. Ruído em con-sultórios odontológicos pode produzir perda auditiva? Arq Int Otorrinolaringol 2011;15(1):84–88
4 Gonçalves CGO, Marques JM, Ribas A, et al. Caracterização dos limiares auditivos de odontólogos numa população da cidade de Curitiba–PR, Brasil. Arq Int Otorrinolaringol 2012;16(1):32–38 5 Paraguay ATT. Perda auditiva induzida por ruído em consultório
odontológico [Trabalho de conclusão de curso]. Recife, Brazil: CEFAC; 1999
6 American Dental Association. Council on dental research. Sound hazard of high speed cutting instruments. J Am Dent Assoc 1959; 58:145
7 Lacerda A, Melo SCS, Mezzadri SD, Zonta WG. Nível de pressão sonora de um consultório odontológico: uma análise ergonômica. Tuiuti Ciência e Cultura 2002;26(03):17–24
8 Berro RJ, Nerm K. Avaliação dos ruídos em alta freqüência dos aparelhos odontológicos. Rev CEFAC 2004;6(4):300–305 9 Mota SSR. Limiares auditivos de cirurgiões dentistas nas frequências
de 250 a 16000Hz. In: Morata TC, Zucki F, eds. Caminhos para a Saúde Auditiva ambiental-ocupacional. São Paulo, Brazil: Plexus; 2005 10 Gonçalves CGO, Lacerda ABM, Ribas A, Oliva FC, Almeida SB,
Marques JM. Exposição ocupacional ao ruído em odontólogos do Paraná: percepção e efeitos auditivos. Rev Odontol UNESP 2009; 38(4):235–243
11 BRASIL. Ministério do Trabalho Secretaria da Segurança e Saúde do Trabalho. Portaria n° 19, de 09 de abril de 1998. Diretrizes e parâmetros mínimos para a avaliação da audição em trabalha-dores expostos a níveis de pressão sonora elevados. Diário Oficial da União. Brasília, 22 de abril de 1998
12 Sisnando MSM. Perfil auditivo em disc jockeys. Fono Atual 2002; 5(19):27–32
13 Macedo EMB, Andrade WTL. Queixas auditivas de disc jockeys da cidade de Recife. Rev CEFAC 2011;13(3):452–459
14 Lopes AC, Godoy JB. Considerações metodológicas para a investigação dos limiares de frequência ultra-altas em indivíduos expostos a ruído ocupacional. Salusvita 2006;25(2):149–160
15 Carvallo RMM. Audição em altas frequências: repercussões no reconhecimento de fala no ruído e nas emissões otoacústicas [Tese]. São Paulo, Brazil: Faculdade de Medicina da USP; 2002: 156
16 Sayeb DR, Filho OAC, Alvarenga KF. Audiometria de altas frequên-cias: estudo com indivíduos audiologicamente normais. Rev Bras Otorrinolaringol 2003;69:93–99
17 Klagenberg KF, Oliva FC, Gonçalves CGO, Lacerda ABM, Garofani VG, Zeigelboim BS. Audiometria de altas frequências no diagnós-tico complementar em audiologia: uma revisão da literatura nacional. Rev Soc Bras Fonoaudiol 2011;16(1):109–114
18 Gonçalves CGO, Lacerda ABM, Zeigelboim B, Marques JM, Luders D. Limiares auditivos em músicos militares: convencionais e altas frequências. CoDAS 2013;25(2):181–187
19 Mota SSR. Estudo dos limiares auditivos de cirurgiões dentistas nas frequências de 500 a 16000 Hz [Dissertação de Mestrado]. Curitiba, Brazil: Universidade Tuiuti do Paraná; 2002:87 20 Berbare GM, Fukusima SS. Perda auditiva induzida por ruído de
motores de alta rotação em odontólogos e alunos de odontologia: análise audiométrica em frequências de 250Hz a 16KHz. Rev Bras Saúde Ocup 2003;28(107/108):29–38
21 Lopes AC, Melo ADP, Santos CC. Estudo limiares de audibilidade nas altas frequências em trabalhadores da área odontológica. Int Arch Otorhinolaryngol 2012;16(2):226–231
22 Lloyd LL, Kaplan H. Audiometric Interpretation: A Manual Basic Audiometry. Baltimore, MD: University Park Press; 1978 23 Gambarra PAN, Valença AMG, Rocha AV, Cunha DGP. As
repercus-sões do ruído ocupacional na audição dos cirurgiões dentistas das unidades de saúde da família de João Pessoa/PB. Revista Brasileira de Ciências da Saúde 2012;16(3):361–370
24 Cavalcanti TLO, Andrade WTL. Efeitos Auditivos e Extra-Auditivos decorrentes do Ruído na Saúde do Dentista. Rev Bras Ciênc Saúde 2012;16(2):161–166
25 Szymanska J. Work-related noise hazards in the dental surgery. Ann Agric Environ Med 2000;7(2):67–70
26 Gijbels F, Jacobs R, Princen K, Nackaerts O, Debruyne F. Potential occupational health problems for dentists in Flanders, Belgium. Clin Oral Investig 2006;10(1):8–16
27 Gonçalves CGO. Mota PHM, Marques JM. Ruído e idade: análise da influência na audição em indivíduos com 50–70 anos. PROFONO Revista de Atualização Científica 2009;21(4):57–61