* Professor do Departamento de Economia Agrária da Universidad de Talca, Chile. [email protected]
**Departamento de Economia Agrária, Universidad de Talca, Chile. [email protected]
effect on two annual Chilean crops: corn and wheat
José Díaz Osorio* Roberto Jara Rojas**
Abstract: The development strategies for Chile have been oriented toward a greater commercial openness. Chile and the United States signed a Free Trade Agreement (FTA) that has triggered controversies between producers directed to the internal market due to the production and export subsidies that this country carries out. This study analyzed the effect of subsidies
granted by the United States to wheat (Tritricum aestivum) and corn (Zea
mays) growers (Farm Bill 2002). For the study, Technical Standard sheet
were drawn up, from which were determined the direct production costs and the gross margins. The variables used (market prices, subsidies, freight costs and tariffs) and determining the average variable costs allowed us to do a sensitivity analysis, thus establishing the minimum level of produc-tion that naproduc-tional farmers must achieve in order to maintain competitive-ness while a free trade is in force. The signing of a trade agreement could provoke the eventual withdrawal of many Chilean producers from the busi-ness arena while at the same time, favoring consumers with lower prices for the goods derived from these grains.
JEL Classification:
Q 18
Introduction
A country with a limited internal market such as that of Chile re-quires an active participation in the international market in order to maintain a sustained rhythm of growth. Approximately 50% of the goods and services that are transacted in the country in one year form part of Chile’s foreign trade (Pro Chile, 1995). In agreement with the policy of international insertion propounded by Chile, the country has underwritten in the last decades various multilateral or bilateral agree-ments tending to generate a gradual commercial openness, translating into a reduction of tariffs or custom duties. As of 2002, and after a long and difficult negotiation, Chile and the United States signed, in 2003, a Free Trade Agreement, which came into effect in 2004 (Silva, 2003).
This fact has far reaching consequences given that an agreement has been signed with the main economic power in the world, which signifies access to a market of 284 million people with a high power of consumption
and a per capita GDP reaching US$35,300 (ODEPA, 2003). However, this
event has generated more than one controversy, especially in the traditional agricultural sector of our country. Without a doubt the main discussion is about the effect that the American government’s agricultural subsidies will have on Chilean agriculture, specifically on the so-called traditional crops. As a result of this new development, the objective of this study is to quantify the effect of certain types of farm subsides granted by the U.S. on traditional crops in Chile, measured through the production of two important grains.
The farming sector in the United States
According to the information from the World Trade Organization (WTO, 2000) the U.S. is the biggest importer and exporter in the world given that it alone has 12% of the world trade. By comparison, Chile participates in only 0.2% of the world trade.
According to the American Agricultural Census, the most relevant aspects of this sector would be:
xOf the 377.09 million arable hectares, 174.48 million are dedicated
xUnder a system of special programs for annual land retirement (Acre-age Reduction Program), there are 11.93 million hectares in fallow (3%).
xForestry occupies a surface area of 28.92 million hectares.
xLand for haying or grazing amounts to a surface area of 160.92
million hectares.
xThe average size of farming operations is about 197.09 hectares.
The United States Farm Bill 2002
The new American agricultural law, Farm Security and Rural
Invest-ment Act, was passed the 13th of May in 2002, and replaced the FAIR
Act of 1996. The application of this law came into force in 2002 and will extend until 2007 (Methol, 2002). This bill, reaching at $248.6 billion dollars, means an 80% increase in agricultural subsidies over those of the FAIR Act of 1996 (Mittal, 2002).
The principal objectives of this law are:
xTo generate adequate income for farmers.
xTo supply food at reasonable prices
xMaintain a competitive international position.
xSupport the conservation and protection of the environment.
xMaintain the viability of the product industry.
xMaintain an adequate level of reserves in case of production
problems.
xReach all the previous objectives at the lowest possible cost to the
American government.
Although the new law is organized in ten Titles, only the first three (Commodities Program, Conservation and Trade) have direct impact on the trade of agricultural goods (Basco, 2002). The same author in-dicates that the most important title and the one to which the greater part of the budget is assigned, is the Commodities article. This includes diverse support programs for the following products: wheat, corn, rice, sorghum, barley, forage crops, oats, soybeans and cotton.
The Commodities Programs are: - Guaranteed Loan Rates
- Fixed or Direct Payments - Guaranteed Real Price - Target Price
- Counter-cyclical Payments
The guaranteed loan rate and fixed payment plans existed in the 1996 law, consequently the most relevant change is the counter-cyclical payment program that reestablishes target prices with the objective of maintaining the income of the producers.
While the Farm Bill of 1996 established maximum annual amounts of direct payments, the new agricultural law does not. The direct pay-ments vary between US$ 5.8 billion in 1998 and 4 billion in 2002 of which nearly 85 % of these amounts were distributed among wheat (26 %), corn (46 %), and cotton (12 %). Nevertheless, the new Farm Bill establishes specific amounts per ton of produce. That is to say, there is no established total annual maximum amount of aid, but rather; it depends on the levels of production (Basco, 2002).
Economic relations between Chile and the United States
Trade negotiations bring together two countries that are significant-ly unequal in terms of size, economic development and political power.
This inequality is expressed in the first place by the per capita income
(US$ 35,300 in the U.S. versus US$ 4,500 in Chile). In the second place, although the U.S. is the number one trade partner of Chile, our country
occupies the 38th place among the U.S. foreign trade partners.
The trade balance between the two economies presents a histori-cally unfavorable deficit for Chile even though in the last two years, this situation has turned around (see Table 3).
from the U.S. to Chile are principally made up of intermediate goods such as petroleum, lubricants and other fuels. In 1996, these represent-ed 51% while in 2001 they reachrepresent-ed 53% of the imports. Capital assets participated in1996 with 40% of total imports and in 2001 this amount decreased to 38% (Silva, 2003).
Table 3 - Trade Balance between Chile and the U.S., 1996-2002 (nominal millions of US dollars)
1996 1997 1998 1999 2000 2001 2002
Chilean exports to the
United States 1,944.7 2,075.2 1,926.9 2,327.8 2,360.3 2,581.1 2,687.0 Chilean imports from
the United States 2,917.6 3,165.6 3,163.9 2,245.5 2,495.4 2,254.7 1,958.4 Trade balance
-972.9 -1,090.4 -1,237.0 82.3 -135.1 326.4 728.6 Source: Silva, 2003, with information from the Banco Central de Chile, based on reports from the National Customs Service. (Servicio Nacional de Aduanas).
Chile – U.S. Free Trade Agreement:
case history for wheat and corn
In overall terms, at the end of twelve years 100% of the trade be-tween Chile and the U.S. will be free. However, it is important to men-tion that a large percentage of products will be able to be traded without tariffs as soon as the FTA comes into force.
With respect to imports, 88.5% of the American products will im-mediately have lowered tariffs and, in the case of Chilean exports, 87% of the products will be able to enter on the American market in the same manner.
Concerning the farming sector, 87% of the produce exported by Chile will remain with zero tariffs at the moment of confirming the treaty while only 62% of the products sent to our country from the U.S. will obtain this freedom from duties (ODEPA, 2003).
For wheat, the main supplying countries in order of importance are: the United States, Argentina and Canada. In order to export wheat to
Chile, these countries are currently subject to an ad valorem tariff of
subtracted the discount in accordance with the current price list. How-ever, with Argentina there is a Chile-MERCOSUR trade agreement that
will allow the entrance of this commodity free from the ad valorem tariff
only in 2014. As for Canada, the signing of the FTA with Chile will al-low the free entrance of this grain as of the year 2014 (ODEPA, 2001). In agreement with the treaty with the U.S., the tariff reduction corresponds to a non linear type in 12 years, from a tariff of 31.5% (consolidated maximum in the WTO). In the following four years, the tariff is reduced to 21% to later become duty free (Ministerio de Economía, 2002).
Concerning corn, the principal suppliers are Argentina and the U.S. For the first country there is a real tariff of 4% but in accordance with the agreement Number 35 Chile-MERCOSUR, corn will enter duty free as of 2006. On the other hand, corn coming from the U.S. is subject to a tariff of 8%, but when the FTA comes into force, corn will immediately be totally duty free (ODEPA, 2001).
Objectives
General Objective
xTo quantify the effect that applying American agricultural
subsi-dies has on two Chilean agricultural products, wheat and corn.
Specific Objectives
xDetermine, according to the Farm Bill 2002, the subsidy
contribu-tion granted by the U.S. government to its farmers for these two prod-ucts.
xDetermine, for different scenarios, the effect of importing wheat
and corn from the U.S. on the degree of competitiveness of Chilean producers.
Materials and Methods
xBackground statistics obtained from the United Nations Organiza-tion for Food and Agriculture (FAOSTAT); from the United States De-partment of Agriculture (USDA); from the Oficina de Estudios y Políti-cas Agrarias (Office of Agricultural Research and Policy) (ODEPA) and from the Banco Central de Chile. In addition to these sources, informa-tion was compiled about cultivated surface areas, producinforma-tion volume, yields, prices and the trade balance between Chile and the U.S.
xBibliographic information obtained from reviewing magazine
ar-ticles, research and publications on the FAIR Act of 1996 and the Agri-cultural Farm Bill of 2002.
In order to prepare the technical data about crops, research and articles from the U.S. Department of Agriculture (USDA), Departmento de Economía Agraria de la Universidad de Talca (Agricultural Econom-ics Department), the Instituto de Investigaciones Agropecuarias (INIA) (Agricultural Research Institute), and Fundación Chile.
From the American market prices for wheat and seed corn in the 2002-2003 season, subsidies granted by the American government to its farmers under Title 1 (referring to commodities) of the Farm Bill were determined.
This law establishes the following prices and payments as detailed below:
xGuaranteed Loan Rates.
xCompensatory Payments
xFixed or Direct Payments
xGuaranteed Real Price, which corresponds to loan rates plus fixed
payments
xTarget price, which is the minimum amount farmers received per
ton of produce.
xCounter-cyclical payments, which are activated when the income
of the producers falls below the Target Price, which is determined for each crop.
market price falls below the guaranteed loan rates. The counter-cycli-cal payments are activated when the producers’ income falls below the target price, that is, when the market price plus the fixed payment is inferior to the target price. In the case where the market price was less than the guaranteed loan rate, the counter-cyclical payment would cor-respond to the following equation:
Counter-cyclical payments = target price – [fixed price +
guaranteed loan rate)] (1)
All the prices and payments previously detailed were calculated in dollars per 100 kilograms (US$/100 kg.).
The wheat and corn technical data for Chile, as well as the U.S., are found in the attached tables. For the latter country, a standard data card for both grains was considered, where the items for production factors and items are grouped together, but not so for farm labor. In addition, considering that the biggest and best producers in the U.S. receive a greater amount of subsidies, a high technological level for both coun-tries was assumed. On the other hand, given the differences between the crop data cards for each country, a standard card was adapted for these which included all the items in the production process (see Table 4). The above-mentioned card allowed a more homogeneous compari-son and analysis of the competitive position in which the Chilean pro-ducers for both crops find themselves.
According to Table 4, the production costs in the U.S. for both crops consider: seeds, fertilizers, pesticides. In addition, the item “Agricul-tural machinery expenses” includes diesel oil, oil and repairs; the item “Other Costs” includes water rights payments; the item “Labour” in-cludes personal and contracted hours of work. The items “harvest and freight” were not included as direct production costs due to the follow-ing suppositions:
xThe big agricultural producers in the U.S. have their own
machin-ery and transport.
xWheat farmers cultivate on average 30% of their total lands to this
xIn the case of corn producers, 40% of the total cost of machinery depreciation was considered as a direct production cost, since these farmers dedicate, on average, this percentage of their total cultivation area to this cereal.
Table 4 - Technical Standard sheet for direct production costs in Chile and the U.S.
ITEM Seeds Fertilizers Pesticides
Agricultural machinery expenses
Machinery depreciation Labour
Harvest Freight Other expenses DIRECT COSTS Source: Adapted from annex, 2003.
The production costs for wheat and seed corn in Chile, include seeds; fertilizers; pesticides (herbicides, fungicides and insecticides); for the item “Agricultural machinery costs”, the cost of the payment for such services was considered (that is, machinery depreciation is not included); other costs (unexpected items which correspond to 5% of the total direct cost); labor, harvest costs (equivalent to the cost of the service of an automotive harvester) and finally, freight. For this last item the following suppositions are made:
- Wheat freight costs: $350 pesos/100 kg (4.99 US$/ton). - Corn freight costs: $430 pesos/100 kg (6.13 US$/ton).
The technical data cards for both countries were valued in dollars per hectare (US$/h.), using the average price of the dollar in July of 2003.
GROSS MARGIN = TOTAL INCOME - TOTAL DIRECT COSTS (US$/h.) (US$/h.) (US$/h.)
Where:
Total Income: yield (100 kg/h.) * Price (US$/100 kg). Total Direct Costs: of direct costs specified in the Technical
Standard sheet (2)
In the case of the U.S., the payments made by the Government through the Farm Bill 2002 (Title I) were added, and those payments were added to the Gross Margin. Determining wheat and seed corn production costs for both Chile and the U.S. allowed making a comparison between the Gross Margin and Average Cost Variables for both countries.
To determine the import costs to Chile of wheat and corn coming from the U.S., the market prices of these products for the 2002-03 sea-son, plus the freight, insurance and current tariffs were considered.
As well, the effect of importing wheat and corn from the U.S. on the national agricultural market was analyzed, which permitted us to measure the degree of competitiveness for the Chilean producers of these grains.
The latter was done through a sensitivity analysis with respect to the import cost (measured in US$/100 kg) of wheat and corn, compared with the variable average cost for national producers. The sensitivity analysis in the case of corn was done considering two types of produc-ers: those using their own fields for their productive process and those who do the process in rented fields, which currently represent a signifi-cant percentage of the total cultivated surface area.
The following scenarios were studied:
Case 1 Without fixed payments, without counter-cyclical payments, without export subsidy, with tariff
Case 2 Without fixed payments, without counter-cyclical payments, without export subsidy, without tariff
Case 3 With fixed payments, with counter-cyclical payments, without export sub-sidy, with tariff
Case 4 With fixed payments, with counter-cyclical payments, without export sub-sidy, without tariff
Case 6 Without fixed payments, without counter-cyclical payments, with export subsidy, without tariff
Case 7 With fixed payments, without counter-cyclical payments, with export sub-sidy, with tariff
Case 8 With fixed payments, with counter-cyclical payments, with export subsidy, with tariff
Case 9 With fixed payments, with counter-cyclical payments, with export subsidy, without tariff
The terms are defined as:
- Fixed Payment, determined by the Farm Bill 2002 for wheat and corn in the 2002/03 season.
- Counter-cyclical Payments (Title I, Farm Bill 2002).
- Export Subsidies: Amount assumed by the U.S. government, to finance part of the costs associated with the marketing of export goods among which freight and insurance costs are highlighted.
- Tariff: Tax which affects the importing of wheat and corn from the U.S.
Results
Agricultural production subsidies in the United States
Direct production subsidies for wheat.
In Figure 5.3 the following subsidies for the period 2002-2003 are observed:
xGuaranteed loan rates US$10.29/ 100 kg
xFixed payments 1.91/ 100 kg
xThe sum of the guaranteed loan rates and the
fixed payments corresponds to the guaranteed
real price 12.19/ 100 kg
xTarget price 14.18/ 100 kg
xThe difference between the target price and
the guaranteed real price corresponds to the
maximum counter-cyclical payment 1.98/ 100 kg
Figure 3 - Graph of payments for wheat during 2002-2003
Source: created by the author from USDA data.
compensa-tory payment in order to reach the guaranteed loan rate, after which the fixed payment and the maximum counter-cyclical payment are made in order to arrive at the target price (US$/100 kg – 14.18 in the 2002-03 season). The agricultural law established a limit of US$ 75,000 per farmer for the compensatory payments.
If the market price is located in zone 2, the fixed payments and the counter-cyclical payments (not maximum) are made in order to reach the target price.
When the market price is located in zone 3, the fixed payments are made and the counter-cyclical payments are activated only when the market price plus the fixed payment do not reach the target price. Final-ly, if the market price is greater than the target price (zone 4) the fixed payments are still made but the counter-cyclical payments are not.
Wheat production subsidies for the period 2004-2007 had an estab-lished guaranteed loan rate of 10.10 US$/100 kg, a guaranteed real price of 12.01 US$/100 kg (the fixed payment was maintained at 1.99US$/100 kg) and a target price of 14.40 US$/100 kg, with which the maximum counter-cyclical payments arrived at 2.39 US$/100 kg.
The price given to the producer by the USDA in July of 2003 was 12.19 US$/100 kg. If the target price was fixed at 14.18 US$/100 kg, the difference (1.99 US$/100kg) would be contributed by the Farm Bill (1.91US$/100 kg by fixed payment and 0.08US$/100 kg by counter-cy-clical payments).
Direct production subsidies for corn
Just the same as for wheat, there are two periods where the sub-sidies granted by the U.S. government to corn producers vary. For the period 2002-2003, the following values were established for subsidies:
xGuaranteed loan rate 7.80 US$/100 kg
xFixed payment 1.10 US$/100 kg
xGuaranteed real price (GLR +FP) 8.90 US$/100 kg
xTarget price 10.24 US$/100 kg
xMaximum counter-cyclical payment 1.34 US$/100 kg
In the same manner as shown in Figure 5.3, if the market price for corn corresponds to Zone 1 (below the guaranteed loan rate), the compensatory payments are activated, then the fixed payments and the maximum counter-cyclical payments until reaching the target price of 10.24 US$/100 kg for the 2002/03 season. When the market price is in Zone 2, the fixed payments and the counter-cyclical payments (not maximum) are made in order to arrive at the target price. If the market price is located in Zone 3, the fixed payments and the counter-cycli-cal payments come into effect only if the market price plus the fixed payments do not reach the target price. If the market price exceeds the target price (Zone 4) only the fixed payments are made.
For the period 2004-2007 a guaranteed loan rate was fixed at 7.68 US$/100 kg; the guaranteed real price was 8.78 US$/100 kg (the fixed payment was maintained at 1.10 US$/100 kg); the maximum counter-cyclical payment was established at 1.57 US$/100 kg; and finally, the target price reached 10.35 US$/100 kg, 0.11 US$/100 kg more than the 2002-2003 period.
The price of corn granted to the producer by the USDA in July of 2003 was 8.65 US$/100 kg. If the target price was fixed at 10.24 US$/100 kg, the difference (1.59 US$/100 kg) would be contributed by the Farm Bill (1.10 US$/100 kg by fixed payment and 0.49 US$/100 kg via the counter-cyclical payments).
28,050,000 hectares involving an average yield of 8,040 kg/h., each hect-are should receive a payment of US$127.83. Considering the yields (9,000 kg/h.) obtained by farmers possessing a high level of technology, these farmers would receive US$143.10 per hectare by way of direct subsidies.
Analysis of the competitiveness of Chilean corn and wheat producers. Comparison of direct production costs between Chilean and American wheat and corn growers
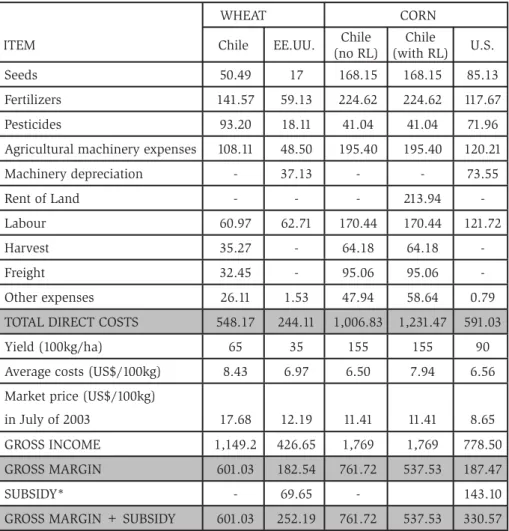
Table 5 - Direct production costs and Gross Margin for wheat and corn in Chile and the U.S. (US$/h.)
WHEAT CORN
ITEM Chile EE.UU. Chile
(no RL)
Chile
(with RL) U.S.
Seeds 50.49 17 168.15 168.15 85.13
Fertilizers 141.57 59.13 224.62 224.62 117.67
Pesticides 93.20 18.11 41.04 41.04 71.96
Agricultural machinery expenses 108.11 48.50 195.40 195.40 120.21
Machinery depreciation - 37.13 - - 73.55
Rent of Land - - - 213.94
-Labour 60.97 62.71 170.44 170.44 121.72
Harvest 35.27 - 64.18 64.18
-Freight 32.45 - 95.06 95.06
-Other expenses 26.11 1.53 47.94 58.64 0.79
TOTAL DIRECT COSTS 548.17 244.11 1,006.83 1,231.47 591.03
Yield (100kg/ha) 65 35 155 155 90
Average costs (US$/100kg) 8.43 6.97 6.50 7.94 6.56 Market price (US$/100kg)
in July of 2003 17.68 12.19 11.41 11.41 8.65 GROSS INCOME 1,149.2 426.65 1,769 1,769 778.50 GROSS MARGIN 601.03 182.54 761.72 537.53 187.47
SUBSIDY* - 69.65 - 143.10
GROSS MARGIN + SUBSIDY 601.03 252.19 761.72 537.53 330.57 No RL = without rent of land; with RL = with rent of land.
* Subsidy corresponding to Title I of the Farm Bill 2002.
With respect to wheat, Table 5 presents a comparison of the direct costs of production in Chile and the U.S. for the year 2003. As well, this Table shows the gross margins (US$/h.) for yields produced with a high level of technology, that is, 6,500 kg/h. for Chile and 3,500 kg/h. for the U.S. The prices used in this analysis (July 2003) were 17.68US$/ 100kg in the case of Chile (ODEPA, 2003) and 12.19US$/100kg for the U.S.(price estimated by the USDA). This table also shows the subsidies granted to American farmers via the Farm Bill 2002 whose amount cor-responds to the difference between the market price (12.19US$/100 kg) and the target price-2003 (14.18US$/100 kg); that is 1.99US$/100 kg. Said amount multiplied by the quantity of grain produced gives rise to a subsidy of US$69.65/ hectare. Variable average costs (US$/100 kg) were lower in the U.S., however the great difference in yield and price per hundredweight, resulted in Chile’s gross margin being 138% greater. This percentage would increase to 229% if the government of the U.S. did not directly subsidize the production of agricultural goods.
In Chile, the direct production costs for corn reached US$1,006.83 / h., (US$415.80/h. more than in the U.S.). However, the variable average costs are slightly lower in Chile mainly due to its yield levels (15,500kg/ h. versus 9,000 kg/h. in the U.S.).
Direct subsidies for the production of corn in the U.S. correspond – as do those for wheat – to the difference between the market price (8.65US$/100kg) and the target price-2003 (10.24US$/100 kg), that is 1.59 US$/100 kg. Said amount multiplied by the yield (9,000 kg/h.) gives us a total subsidy of US$ 143,10/h.
The differences between gross margins, without considering sub-sidies, are greater in Chile by US$574.25/ h. than in the U.S. Upon inclusion of the subsidies, the difference between gross margins lowers to US$431.10/h. In other words, through subsidies alone, the corn pro-ducers in the U.S. increase their gross margin by 76.33%, reflecting the great influence that subsidies have on agricultural production, which in this case corresponds only to Title 1 of the Farm Bill 2002.
Nevertheless, considering the market prices of 2003, this gross margin remains competitive compared to that obtained by American producers (330.57 US$/h.).
In this scenario, the Chilean producers’ gross margin exceeds by US$206.96/h. that obtained by their American counterparts even with the subsidies that they receive. Without taking into consideration the item “rent of land”, the difference in these gross margins is US$270.46/ h., 52% greater.
For both wheat and corn production the differences in the use of agricultural products for production of these grains in the two countries call our attention:
- Seeds: Chilean producers use a significantly greater amount of seeds than the U.S. producers, which is reflected in the density of plants per hectare permitting higher yields.
- Fertilizers: For both crops, a great difference in the use of these products is shown. It could be thought of as excessive fertilization in Chile; however the difference clearly points out the strength/density of the crops. While in Chile there is a very intensive crop growing, the producer in the U.S. opts for much more extensive crops corresponding to the size of the properties and the availability of labour. The quantity of fertilizer used is also evident in the crop yields in each country.
- Agricultural chemical products: In the case of wheat, the use of a greater quantity of these products is observed in Chile mainly due to continuously planting the same crop (one-crop systems), of which the consequence is an increase in plant diseases. In the case of corn, the U.S. shows a higher level of use of agricultural chemicals, nevertheless they are considered within the normal range and, as in Chile, a reason-able use is made of them.
Wheat Producers
U.S. to the port of San Antonio, Chile was US$ 1,575 per container (40-foot, maximum weight of 26.681 tons); that is, 59.03 US$/ton. Conse-quently it is assumed that there would be an export subsidy that would cover 70.33% of the costs associated with exporting goods (freight and insurance, f+i) between the U.S. and Chile.
The tariff on wheat coming into our country from the U. S.
corre-sponds to an 8% ad valorem the sum of which should be adjusted to
the price list in force. On average, up to August 2003, the CIF value of a ton of wheat coming from the U.S. reached US$ 148.52. If we add the 8% tariff to this amount, we arrive at a total of 160.40 US$/ton, a value very close to the floor of the list in force for wheat (161 US$/ton).
The following sensitivity analysis makes reference to the cost of importing 100 kg of wheat from the U.S. according to the various sce-narios mentioned in the methods section. These values are compared with the cost of producing 100 kg in Chile (AVC, Average Variable Cost) for producers with a high level of technology, that is, those who pro-duce 6,500 kg/h. and whose direct production costs are 548.17US$/h. (AVC = 8.43US$/100 kg). The fixed payments and the counter-cyclical payments correspond to direct production subsidies for agriculture in the U.S. The fixed payment was 1.91US$/100 kg, while the counter-cy-clical payment corresponds to the difference between the target price – 14.18 US$/100 kg in the 2002/03 season – and the market price (12.19 US$/100 kg) plus the fixed payment. That is to say, CCP = TP – (mar-ket price +FP). According to this formula, the counter-cyclical payment was 0.08 US$/100 kg.
In the scenarios where the fixed payments and the counter-cyclical payments are included, these will be discounted from the direct produc-tion costs and will be seen reflected in a decrease in the AVC (Figure 4). As previously mentioned, the subsidy associated with marketing export products plus the cost of insurance covers 70.33% of the freight costs. In the cases which include an export subsidy, the cost of freight and insurance will be 1.75 US$/100 kg, while in the cases where there is
no export subsidy, these costs will be 5.90 US$/100 kg. The ad valorem
Figure 4 - Cost of importing 100 kg of wheat from the U.S.
0 2 4 6 8 10 12 14 16 18
US$/100 Kg
Case 1 Case 2 Case 3 Case 4 Case 5 Case 6 Case 7 Case 8 Case 9
AVC f+i Tariff
14.06 12.87
12.07 10.88
9.91 8.72
8.00 7.92
8.43 (1) 6.73
17.68 (a)
12.19 (b)
1. Corresponds to AVC of Chilean wheat producers (8.43 US$/100 kg). a. Price for Chilean producers, July 2003 (17.68 US$/100 kg).
b. Price for American producers, July 2003 (12.19 US$/100 kg). Source: created by the author, with information by ODEPA, USDA 2003.
Case 1 of Figure 4 shows a favourable scenario for the national pro-ducers who possess an AVC of 8.43 US$/100 kg, given that the cost of importing one 100 kg of wheat from the U.S. is 14.06 US$/100 kg with-out considering subsidies and including the tariff. The American export subsidy greatly affects the lowering of import costs per 100 kg of wheat if we compare the costs where an export subsidy is granted to those where only the direct production subsidy is applied (case 6 versus case 4).
Corn producers
The difference between the CIF and Fob prices in 2002 reached 9.09 US$/ton. For the year 2003, the CIF price (without tariff) for one ton of grain coming from the U.S. was estimated at 124 US$/ton, while the Golfo FOB value was 109.10 US$/ton, making a difference of 14.90 US$/ ton. As previously mentioned, the cost of freight plus insurance between the U.S. and Chile was 59.03 US$/ton, estimating a 74.75% subsidy for freight and insurance (f+i) from the U.S. government. Hence the ex-planation of why grains sent from the U.S. arrive in our country at price ranges that are competitive with, or even inferior to, the price of grain from other countries that have lower freight costs such as Argentina.
The tariff on corn shipments from the U.S. corresponds to 8% ad
valorem. With the coming into force of the FTA, an immediate tariff
reduction would take place. If the tariff is discounted from the entry price of corn (134.06 US$/ton in July 2003) imported from the U.S., it would fall to 124 US$/ton, which would be lower than the current price of corn imported from Argentina (128.36 US$/ton).
The following sensitivity analysis makes reference to the import cost per 100 kg of corn from the U.S. assuming the same scenarios that were used for the wheat analysis. These values are compared with the cost of producing 100 kg of corn in Chile (AVC) for producers with a high level of technology, producing 15,500 kg/h. and whose direct production costs are 1,006.83 US$/h., that is with an AVC of 6.50 US$/100 kg.
The fixed payments and the counter-cyclical payments correspond to direct agricultural subsidies for corn production in the U.S., with the fixed payment being 1.10 US$/100 kg while the counter-cyclical pay-ment corresponds to the difference between the target price – which was 10.24 US$/100 kg in the 2002/03 season- and the market price (8.65 US$/100 kg) plus the fixed payment, arriving at a counter-cyclical payment of 0.49 US$/100 kg.
the cost of freight and insurance will be 1.49US$/100 kg, while in the cases not including the export subsidy, the cost will be 5.90 US$/100 kg.
The 8% ad valorem tariff represents an additional cost of 0.99 US$/100 kg and is calculated on the estimated CIF value in January – August of 2003 for one ton of corn coming from the U.S. (124.00 US$/ton).
As in the nine cases previously analyzed, Figure 5 graphs the dif-ferent import costs for 100 kg of corn coming from the U.S. in terms of AVC, freight + insurance, and tariffs. In Case 1, a scenario where there are tariffs but no subsidies, the cost of importing corn is 13.45 US$/ 100 kg, which is a very favouable for national corn producers possessing an AVC of 6.50 US$/100kg. Just as for wheat, the export subsidy has a greater percentage of influence on the import value than the direct product subsidy has. That is to say that the export subsidy on 100 kg of corn coming from the U.S. is more detrimental to national producers than the second subsidy mentioned (Case 6 versus Case 4).
Figure 5 - Cost of importing 100 kg of corn from the United States
0 2 4 6 8 10 12 14 16
US$/100 Kg
Case 1 Case 2 Case 3 Case 4 Case 5 Case 6 Case 7 Case 8 Case 9
AVC f+i Tariff
6.50 (2) 13.45
12.46 11.86
10.87
9.04
8.05 7.94
7.45 6.46
7.94 (1) 11.41 (a)
8.65 (b)
1. Corresponds to the AVC of Chilean corn producers including land rent (7.94US$/100kg) 2. Corresponds to the AVC of Chilean corn producers (6.50 US$/100 kg).
For the year 2003, the cost of corn coming from the U.S. was 7.45 US$/100 kg (Case 8), which allowed national corn producers to still be competitive.
Case 9 graphs a scenario where corn is imported from the U.S. with the corresponding subsidies granted by the U.S. but without tariffs. Here, the cost of importing corn is 6.46 US$/100 kg, a value lower than the AVC of national producers. This case makes clear the effect of the
current tariff on corn imported from the U.S. (8% ad valorem).
It must be noted that with the coming into force of the FTA, this product will have an immediate tariff reduction, a situation as presented in Case 9. In this scenario, producers find themselves in a rather unfa-vourable position for maintaining adequate competitiveness (measured by the AVC, they will have to produce a minimum of 15,585 kg/h.).
For Chilean producers who rent land, which today is a very com-mon practice involving a large surface area of corn (Departamento de Economía Agraria, 2001), the AVC increases from 6.50 to 7.94 US$/100 kg. In this case, so that these farmers can maintain their competitive-ness, they would have to produce 19,000 kg/ h. or else reduce their production costs by 18.7%.
After having done this analysis, we can firmly state that with respect to shipments from the U.S. the loss of competitiveness for the corn pro-ducers in our country (whether they rent the land or not) is due to the large quantity of subsidies involved. Seen in this manner, one form of confronting this type of distortion existing in international trade would be to apply tariffs. However, as previously mentioned, these tariffs will be eliminated.
Conclusions
With respect to the American Food Security and Rural Investment Act or Farm Bill 2002 (Title 1), the following can be concluded:
xIn the 2002/2003 season each hectare of wheat received an average
yield) would have received a subsidy of 143.10 US$/h. It’s mean that the U.S. the direct subsidies increase the gross margin of the wheat and corn producers by 30.64% and 76.33%, respectively.
With respect to the comparison between Chilean and American di-rect production costs and gross margin for wheat and corn, the follow-ing could be concluded:
xThe direct costs of wheat production in Chile are greater than
those of the U.S. by 127.7% (548.17 US$/h. versus 244.11 US$/h.) On the other hand, the wheat yields in Chile reached 6,500 kg/h. exceeding those of the U.S. by 116.6% (3,500 kg/h.), considering similar techno-logical conditions.
xThe gross margin for national wheat supersedes that of the U.S. by
229%, but when the direct production subsidies to American farmers are included, the difference diminishes to 138%. The direct subsidies granted by the U.S. to its farmers enable them to increase the gross mar-gin by 38.16%, considering the aforementioned production rate.
xWith reference to corn, the total direct costs in Chile are 1,006.83
US$/h., while in the U.S. they reach 591.03 US$/h. However, the yield from farmers with a high level of technology is 15,500 kg/h. and those of the U.S. only reach 9,000 kg/h.
xThe gross margin for corn in the U.S. is 330.57 US$/h. including
direct subsidies, whereas that of the Chilean producers is 761.72 US$/ h. By eliminating the direct subsidies for corn production in the U.S., the gross margin for Chilean producers exceeds that of their U.S. coun-terparts by 306.09%. Considering the previously indicated production rate, the American farmers obtain 187.47 US$/h. in direct subsidies, which increase their gross margin by 76.33%.
xBy including land rent in the direct production costs for Chilean corn producers, the gross margin decreases by 29%. The difference in gross mar-gin compared with that of the U.S. decreases from 431.15 to 206.96 US$/h. With respect to the competitiveness of national wheat and corn pro-ducers the following is concluded:
xThe cost of importing wheat from the U.S. with a 0% tariff, export
xThe cost of importing corn from the U.S. with a 0% tariff, export subsidies and direct production subsidies is 6.46 US$/ 100kg, a value very similar to the AVC (6.50 US$/100 kg) incurred by the Chilean pro-ducers with a high level of technology. However, in order to achieve this level of AVC, it is necessary to obtain yields superior to 15,500kg/h.
With respect to the grain trade between Chile and U.S. the following can be concluded:
xBoth Corn and Wheat production in Chile does not have
influ-ence on the international trade and world-wide prices, because Chile is an import country of these goods, and its internal prices of market are based on international prices. If the prices of grains drop given by a gradual diminish in the applied tariffs, then the viable option for these producers -to medium and long term- is the to change his production to other agricultural goods such as fresh fruits or other raw materials for food industries. These kinds of goods have real opportunities of inter-national trade due to the commercial agreements that Chile has signed in the last years.
xIn Chile, habitually the wheat producers do not rent land; only the
corn producers do it, because this type of producers has lower land. Therefore, if the price of corn is high, then the corn producer makes the decision to rent land. On the other hand, if the price is low these growers would not rent land, as answer to a probable diminution of the yield of corn. That is to say, the opportunity cost of land is a short term decision, based on the corn price of the previous season.
References
ACTIONAID. 2002. Rentabilidad en la agricultura. Available in http://www. actionaid.org. [20 March, 2003].
BANCO CENTRAL DE CHILE, 2003. Bases de datos económicos, Indicado-res del día. Available in http://www.bcentral/basedatoseconómicos. [6 August, 2003]
DEPARTAMENTO DE ECONOMÍA AGRARIA. 2001. Economía Agraria de la producción de maíz en la VI región. Universidad de Talca. 117 p.
DIRECCIÓN DE PROMOCIÓN DE EXPORTACIONES (ProChile). 1995. New York. 39 p.
EL MERCURIO. Insumos agropecuarios. En: Revista del campo. Nº 1.408. Cuerpo B, p.5. [7 July, 2003].
INSTITUTO NACIONAL DE ESTADÍSTICA (INE), 2003. Estadísticas Ag-ropecuarias. Available in http://www.ine.cl [20 September, 2003].
METHOL, M. 2002. Nueva Ley agrícola de Estados Unidos: algunos aspectos destacados. ODYPA-ANUARIO. 5p.
MITTOL, A. 2002. Perdiendo nuestra tierra: La Ley Agrícola del 2002. Food First Institute for food and development. Policy, USA. Available in http://
ZZZIRRG¿UVWRUJSXEVEDFNJUGUVOH\DJUtFRODKWPl. [16 March, 2003].
OFICINA DE ESTUDIOS Y POLÍTICAS AGRARIAS (ODEPA). 2001. Condiciones de ingreso para los productos silvoagropecuarios importados por Chile. Available in http://www.odepa.cl. [21 May, 2003].
OFICINA DE ESTUDIOS Y POLÍTICAS AGRARIAS (ODEPA), 2002. Situación del mercado del maíz. Ministerio de Agricultura, Gobierno de Chile. Available in http://www.odepa.cl. [14 March, 2003].
OFICINA DE ESTUDIOS Y POLÍTICAS AGRARIAS (ODEPA), 2002. Mercado del trigo. Ministerio de Agricultura, Gobierno de Chile. Available in http://www.odepa.cl. [23 April, 2003].
OFICINA DE ESTUDIOS Y POLÍTICAS AGRARIAS (ODEPA). 2003. El tratado de libre comercio entre Chile y EE.UU. Available in http://www.ode-pa.cl. [5 March, 2003].
OFICINA DE ESTUDIOS Y POLÍTICAS AGRARIAS (ODEPA), 2003. El mercado del maíz. Ministerio de Agricultura, Gobierno de Chile. Available in http://www.odepa.cl. [2 August, 2003].
OFICINA DE ESTUDIOS Y POLÍTICAS AGRARIAS (ODEPA), 2003. Pre-cios mayoristas: trigo y maíz. PrePre-cios reales sin IVA con IPC de 07/2003. Ministerio de Agricultura, Gobierno de Chile. Available in http://www.odepa. cl. [15 de August, 2003].
OFICINA DE ESTUDIOS Y POLÍTICAS AGRARIAS (ODEPA), 2003. Pre-cios Internacionales: trigo y maíz, nominales sin IVA. Ministerio de Agricultura, Gobierno de Chile. Available in http://www.odepa.cl. [15 de August, 2003].
ORGANIZACIÓN MUNDIAL DE COMERCIO (OMC). 2000. El Comer-cio Mundial en el año 2000. Visión general. Available in http://www.wto.org/ spanish/res_s/statis_s/its.2001_s/chp-1.pdf. [2 June, 2003].
SILVA, C. 2003. Notas acerca del Tratado de Libre Comercio entre Chile y Estados Unidos. Santiago de Chile. 21 p.
UNITED STATED DEPARTMENT OF AGRICULTURE (USDA). 2001. Characteristics and Production Costs of U.S. Corn Farms. Electronic Report from the ERS. Available in http://www.ers.usda.gov. [23 June, 2003].
UNITED STATED DEPARTMENT OF AGRICULTURE (USDA). 2002. Di-rect payments for wheat, feed grains. Available in http://www.ers.usda.gov/ Features/FarmBill/analysis/directpayments2002act.htm.[8 May, 2003].
UNITED STATED DEPARTMENT OF AGRICULTURE (USDA). 2002. Farm Characteristics, Farm Financial Indicators. Economic Research Service, USDA, Washington DC. 2002. Available in http://www.ers.usda.gov. [20 Au-gust, 2003].
UNITED STATED DEPARTMENT OF AGRICULTURE (USDA), 2003. World Agricultural Supply And Demand Estimates (WASDE-96). Available in http://www.usda.gov. [13 May, 2003].
UNITED STATED DEPARTMENT OF AGRICULTURE (USDA), 2003. World Agricultural Supply And Demand Estimates (WASDE-401). Available in http://www.usda.gov/oce/waob/wasde/latest. [28 August, 2003].
Annex
Costs of Production: Corn-Chile1A Chilean
($)/h. US$/h. 1. Factor: Labour
Harrow 3,000 4.28
Urea 5,000 7.13
Herbicides 3,000 4.28
Sowing, Fertilizers
+ pesticides 6,000 8.56
Contour-furrow irrigation 2,500 3.57 Thinning and to earth 30,000 42.79 To weed manually 25,000 35.66 Irrigations 45,000 64.18 Sub - Total 119,500 170.44 2. Factor: Machinery
Front power lift plough 52,000 74.16 Chisel plough 30,000 42.79 Fertilizer distributor 8,000 11.41
Fumigator 16,000 22.82
Corn drill 20,000 28.52
Reaper 45,000 64.18
Sub - Total 171,000 243.89 3. Factor: Animal Labour
11,000 15.69
Sub - Total 11,000 15.69
4. Factor: Means
Seed 117,900 168.15
Urea 98,400 140.34
Phosphate Fertilizer 40,250 57.41 Potash Fertilizer 18,840 26.87
Lorsban 12,624 18
Atrazine 6,840 9.76
MCPA 9,308 13.28
Sub - Total 304,162 433.81
Freight 66,650 95.06
Costs de Production: Wheat -ChileA Chilean
($)/h. US$/h. 1. Factor: Labour
Harrow 2,700 3.85
Urea 2,700 3.85
Herbicides 4,500 6.42
Sowing, Fertilizers +
pesticides 4,500 6.42
To clean 1,350 1.93
Contour-furrow irrigation 6,750 9.63
Fungicides 4,500 6.42
Irrigations 15,750 22.46
Sub - Total 42,750 60.97
2. Factor: Machinery
Farm cart 7,055 10.06
Plough 13,046 18.61
Mouldboard plough 6,855 9.78 Ditching plough 3,129 4.46 Fertilizer distributor 7,000 9.98
Fumigator 18,854 26.89
Drilling machine 19,864 28.33
Reaper 24,732 35.27
Sub - Total 100,569 129.15 3. Factor: Means
Seed 35,400 50.49
Urea 57,400 81.87
Phosphate fertilizer 41,860 59.7
Vincit Flo 6,287 8.97
Banvel 480 SL 9,346 13.33 Iloxan 28 EC 31,500 44.93
MCPA 750 2,058 2.93
Bayleton 25% WP 16,156 23.04 Sub - Total 200,006 285.26
Freight 22,750 32.45
Costs of Production: Wheat – USAB US$/
acre US$/h. Ch.$/ha. ITEM
Operating Costs
Seed 6.88 17 11,919
Fertilizer 23.93 59.13 41,458
Pesticides 7.33 18.11 12,698
Hired Labour 8.9 21.99 15,418 Unpaid Labour 16.48 40.72 28,550 Fuel, lube and other 9.26 22.88 16,042
Repairs 10.37 25.62 17,963
Other variable expenses (1) 0.62 1.53 1,073 DIRECT COSTS 83.77 206.98 145,121 Allocated overhead:
Depreciation (2) 50.08 123.75 86,766
*Land 39.63 97.93 68,663
*Insurance and taxes 4.04 9.98 6,997 *General indirect expenses 7.28 17.99 12,614
*Interests 0.6 1.48 1,038
Costs OF Production: Corn-USA2B US$/ acre
US$/
h. Ch.$/h. ITEM
Operating Costs
Seed 34.45 85.13 59,688
Fertilizer 47.62 117.67 82,503
Pesticides 29.12 71.96 50,454
Hired Labour 15.02 37.11 26,019 Unpaid Labour 34.24 84.61 59,323 Fuel, lube and other 30.03 74.2 52,025
Repairs 18.62 46.01 32,259
Other variable expenses (1) 0.32 0.79 554 DIRECT COSTS 209.42 517.48 362,825 Allocated overhead:
Depreciation (2) 74.42 183.89 128,933
*Land 90.33 223.21 156,501
*Insurance and taxes 7.5 18.53 12,992 *General farm overhead 11.78 29.11 20,410
*Interests 1.65 4.08 2,861
TOTAL ALLOCATED COSTS 185.68 458.82 321,697 TOTAL COSTS 395.1 976.3 684,522 TOTAL DIRECTS COSTS (3) 239.18 591.03 414,394
Recebido em abril de 2005 e revisto em junho de 2006
A Source: created by the author, 2003. with information from the ODEPA, INIA, Depar-tamento de Economía Agraria Universidad de Talca, Banco Central de Chile and Revista del Campo.
BSource: USDA, 2003.
(1) Cost of purchased irrigation water.
(2) Costs of Depreciations: In the case of corn producers, 40% of the total cost of ma-chinery depreciation was considered as a direct production cost, and 30% in the case of wheat producers.
(3) Total Directs Costs = Operating Costs plus 30-40% of the total cost of machinery depreciation (wheat and corn respectively).