HEDONIC ANALYSIS OF CELL PHONES SOLD WITH POST-PAID
SERVICE PLANS IN BRAZIL
ANÁLISE HEDÔNICA DE CELULARES VENDIDOS COM PLANO DE SERVIÇO PÓS-PAGO NO BRASIL
ANÁLISIS HEDÓNICO DE CELULARES VENDIDOS CON PLAN DE SERVICIO POSPAGO EN BRASIL
The aim of this paper is to analyze the determining fac-tors for the pricing of handsets sold with service plans, using the hedonic price method. This was undertaken by building a database comprising 48 handset models, under nine different service plans, over a period of 53 weeks in 2008, and resulted in 27 different attributes and a total number of nearly 300,000 data registers. The results suggest that the value of monthly subscriptions
and calling minutes are important to explain the prices of handsets. Furthermore, both the physical volume and number of megapixels of a camera had an effect on the prices. The bigger the handset, the cheaper it becomes, and the more megapixels a camera phone has, the more expensive it becomes. Additionally, it was found that in 2008 Brazilian phone companies were subsidizing enabled data connection handsets.
ABSTRACT
Resumo: O objetivo deste artigo é analisar os determinantes dos preços dos aparelhos celulares vendidos com planos de serviço, usando a metodologia de preços hedônicos. Neste sentido, foi construída uma base de dados compreendendo 48 modelos de aparelhos, em nove categorias de planos de serviço, durante 53 semanas em 2008, com 27 atributos diferentes totalizando quase 300,000 registros de dados. Os resultados indicam que o valor da assinatura mensal e dos minutos de chamadas são importantes para explicar os preços do aparelho. Além do mais tanto o volume físico quanto o número de megapixels de uma câmera possuem efeitos sobre os preços. Quanto maior o aparelho, mais barato ele é, e quantos mais megapixels a câmera possui, mais caro o aparelho se torna. Outra veriicação encontrada é que em 2008 as operadoras brasileiras subsidiaram celulares habilitados com conexão de dados.
Palavras-chave: Celulares, preços hedônicos, planos de serviço pós-pagos, telecomunicações, atributos.
Resumen El objetivo de este artículo es analizar los determinantes de los precios de los aparatos celulares vendidos con planes de servicio, usando la metodología de precios hedónicos. Con esa inalidad, fue construida una base de datos que comprende 48 modelos de aparatos, en nueve categorías de planes de servicio, durante 53 semanas en 2008, con 27 atributos diferentes que totalizan casi 300.000 registros de datos. Los resultados indican que el valor de la suscripción mensual y de los minutos de llamadas es importante para explicar los precios del aparato. Además, tanto el volumen físico como el número de megapixels de una cámara tienen efecto sobre los precios. Cuanto mayor el aparato, más barato es, y cuantos más megapixels la cámara posee, más caro es el aparato. Otra veriicación es que en 2008 las operadoras brasileñas subsidiaron celulares habilitados con conexión de datos.
Palabras clave Celulares, precios hedónicos, planes de servicio pospagos, telecomunicaciones, atributos.
Rodrigo de Santi rodrigodesanti@yahoo.com.br
Mestre Profissional em Economia e Finanças pela Escola de Economia de São Paulo, Fundação Getulio Vargas – São Paulo – SP, Brasil
Cláudio R. Lucinda claudiolucinda@fearp.usp.br
Professor da Faculdade de Economia, Administração e Contabilidade de Ribeirão Preto, Universidade de São Paulo – Ribeirão Preto – SP, Brasil
INTRODUCTION
Owing to its wide range of features, the cell phone sec-tor in Brazil has become a key area of research in the industrial economy. Since the 1990s and the first de-cade of this century, cell phones have no longer been regarded as luxury items, targeted at higher-income classes, but products for the masses as well. Accord-ing to data from the International Telecommunications Union (ITU), Brazil is now the fifth largest cell phone market in number of units and has even outstripped Japan. In terms of penetration, the figures are also im-pressive: in October, 2011, there were 118 cell phones per 100 inhabitants.
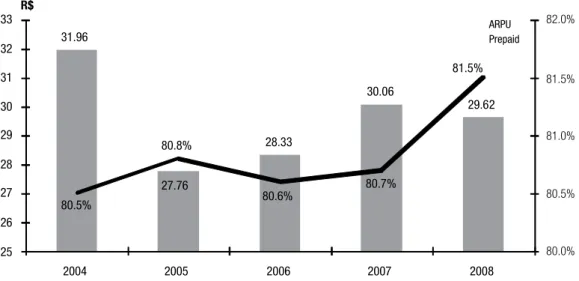
The competition between cell phone operators has been one of the main reasons for this increase, espe-cially with regard to pre-paid phone plans, which have accounted for over 80% of the number of users in the past few years, as shown in Figure 1. However, when income and profit are taken into account, the postpaid cell phone plans are extremely important to the ope-rators’ business model. As a result, there has been a growing momentum in our understanding of the role of product differentiation and price discrimination in this niche of the market.
In our analysis of the commercial aspects of this industry, we employed the hedonic price model for a Brazilian dataset consisting of 48 different handset models, belonging to six brands and three operators, and being sold under nine different subscription plans. The weekly prices were assessed throughout 2008, and data for 27 different attributes and 292,410 data registers were compiled.
Even though the hedonic price structure was ap-plied to a wide range of empirical studies about qua-lity changes of several goods and commodities, it was the computer and automobile sectors that attracted the attention of the applied econometricians. Both sectors are characterized by rapid technological advances, and this also applies to the cell phone sector, as cell phones contain several high-tech features in a single handset. For the purposes of strategic analysis and product posi-tioning, manufacturers and operators usually compare their products with others that contain similar attributes, in an extremely subjective assessment procedure. The drawback of this process is that it fails to quantify the ap-proximate impact of these attributes on the product’s final price. In other words, although some important features of the consumer can be characterized by trial and error,
it is not possible measure the exact value of this attribute by simply taking into account the consumer’s opinion, on the basis of perceptions of prices in this market.
This problem is more acute in the case of post-paid service plans, where the price of the handset, product attributes and service plan characteristics are interrelated to comprise a single set of features for the consumer. One of the goals of this study is to fill this gap and help con-sumers decide which product to buy, while at the same time, enabling operators to promote their cell phones and service plans. From the manufacturer’s perspective, the goal is to assist in the growth and sales of products that are regarded as valuable by consumers, and to take account of the fact that the product will be sold by the operator with a service plan whose attributes really affect the price of the handset.
The chief question to be answered by the present study is as follows: on balance, what is the essential price of each attribute of a handset and post-paid service plan when combined with a handset? This question leads to another pertinent question: what factors determine the price of a handset when combined with a post-paid plan?
In seeking the answers to these questions, this pa-per goes beyond the existing literature, in two direc-tions. First, it uses a database of handsets and plans for one of the largest middle- income emerging markets, with different characteristics from the German market as assessed by Dewenter et al. (2007), and also different from the Chinese market analyzed by Shi, Wildman and Hao (2010). Second, by extrapolating the studies con-ducted by Rodrigues and Lucinda (2010) and Dewen-ter et al. (2007), it explores the relationships between handset attributes, service plan characteristics, and handset prices for the end-consumer. This last point is not covered by any of these papers.
THE CELL PHONE MARKET IN BRAZIL
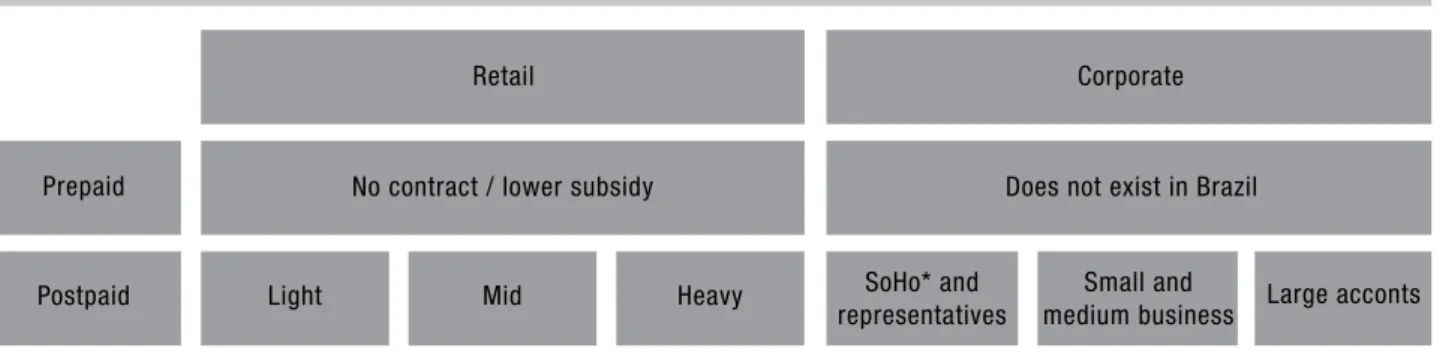
The cell phone market is divided into two macro-seg-ments: corporate and consumer, (also known as retail). The latter is subdivided into postpaid and prepaid, as shown in Figure 2. If, on the one hand, some prepaid customers would rather buy a handset without having to stick to a subscription plan for a given time, some of those with a postpaid deal might prefer to buy a handset for a lower price or even get it free, since it is bundled with a basket of cell phone services, including a monthly subscription fee and a packet with talk- time minutes. However, these consumers have to pay an ad-ditional fee to cancel the contract before its expiration date, even if they intend to use the services of another cell phone operator.
The Brazilian cell phone market is strongly tilted towards prepaid plans, as the data depicted in Figure 1 show. Moreover, it appears that, for several years this imbalance has become more accentuated. At the same time, the average revenue per user (ARPU) has been falling, (from R$ 31.96 in 2004 to R$ 29.62 in 2008). One of the reasons for this fall may be that the average number of minutes of use (MOU) of prepaid customers is considerably lower than that of postpaid customers. Since postpaid plans are likely to be more profitable
(BUSINESS INTERNATIONAL LIMITED, 2009) and, as Yamamoto (2006) showed that the customer lifetime value (CLV) of postpaid users is much higher than that of prepaid users, most operators prefer to concentrate on selling postpaid plans.
This policy is recognized by the operators, who either subsidize handsets in postpaid plans in order to attract new customers or maintain the ones in current use. Economically, the handset subsidy phenomenon makes sense, given the costs incurred by the change of operators. Gruber (2005) stated that in markets where switching costs are charged, small price reductions do not cause a large migration of users across operators, and thus, in the case of the cell phone market, this may mean that operators do not have to be unduly aggressive, in terms of service prices, to keep their customer base.
Nevertheless, as Farrel and Klemperer (2001) pointed out, the competition for new customers in a highly competitive area such as the Brazilian cell phone market, tends to lower the total cost incurred by the consumer (i.e. the handset purchasing price plus the service cost) to a point where operators can only manage to cover their costs and have no profit. This generally means that operators give huge initial discounts via handset subsidies, to bind the customer
Source: Anatel and Operators, 2009 31.96
27.76
28.33
30.06
29.62
80.5%
80.8%
80.6% 80.7%
81.5%
25 26 27 28 29 30 31 32 33
2004 2005 2006 2007 2008
R$
ARPU Prepaid
Figure 1 – Comparison between % of prepaid cell phones in Brazil and the ARPU obtained by Brazilian cell phone operators
82.0%
81.5%
81.0%
80.5%
with a long term contract. A handset subsidy should be seen as an investment by the operator in its customer base, which is necessary to encourage consumers to abide by the terms of the contract.
With regard to the structure of different service plans, the characteristics of Brazilian plans do not differ sharply from the world pattern, and can be grouped into three families:
• Light: plans with up to 49 calling minutes per month
• Mid: plans with 50 to 99 calling minutes per month
• Heavy: plans with over 99 calling minutes per
month
Figure 2 shows a schematic structure of cell phone plans, that takes account of the retail and corporate sectors. Since this study is concerned with handsets combined with postpaid plans, in analyzing the price determinants for the end-consumer, consideration will be given to the characteristics of postpaid plans on the left side of the figure.
As described in the following sections, this study has sought to assess a large number of handsets linked to postpaid plans in the retail sector to explain to what extent their prices are determined by their attributes. However, before conducting the analysis, it is necessary to review the literature on this subject.
LITERATURE REVIEW
The idea that more complex products (e.g. handsets) can be decomposed into different characteristics
(attri-butes) which consumers regard as important, became popular after the work carried out by Lancaster (1966). At the time, the economic theory that prevailed, viewed consumer preference from the standpoint of the choice of bundles of goods. On the basis of this approach, which is still common in microeconomics textbooks, where a vector of prices and incomes (or an endow-ment of goods) is provided, the customer chooses the amount of different goods which gives him or her the highest level of utility.
Despite being theoretically consistent and able to provide some empirical insights into the substitution patterns of consumers, this approach is quickly seen to be unwieldy for markets where there is extensive product differentiation or where the customer’s decision is discrete, rather than continuous. It is difficult to carry out an empirical analysis based on a traditional micro--economics approach to markets for cell phones, where several suppliers offer differentiated products and the consumer’s decision is not about the quantities of goods to be purchased but whether or not to purchase them.
Lancaster’s (1966) approach was based on the view that, at least in some situations, the customer is not interested in purchasing bundles of goods, as in traditional microeconomics, but rather in a set of cha-racteristics. That is, the customer is not interested in a collection of different cell phones, but rather in having a bundle of product features in a single product. By employing this concept, it was perceived that the price of a given attribute can be regarded as an implicit or hedonic price, thus the price of a handset can be split between a fixed-price element and several unit prices linked to the attributes, and reflects the willingness of a consumer to pay for a given attribute.
Figure 2 – Macro representation of existing cell phone plans in the Brazilian telecommunications market
* Small ofice Home ofice Source: Data supplied by the authors
Retail
Prepaid
Postpaid Light Mid Heavy SoHo* and
representatives
Small and medium business Does not exist in Brazil No contract / lower subsidy
This study is based on an extensive literature, both theoretical and applied. On the theoretical side, one can recover primitives – such as cost and demand parameters – can be recovered from the hedonic prices. Rosen (1974) pointed out that when a product can be regarded as a group of services and/or attributes, its price can also be decomposed by the hedonic price method. He also laid down the conditions under which one could determine cost and demand parameters from the hedonic prices. Another important study (TRAIN, 2003) examined how to recover the effects of utility from changes in attribu-tes by using discrete choice methods. . A third line of research focused on constructing Quality Adjusted Price Indexes. Quality Adjusted Price Indexes are price inde-xes that were originally introduced by Griliches (1961) to investigate the effects of changes in the characteristics of products on the way the price of consumer goods evolves. They are particularly relevant for studies of In-formation Technology and Telecommunication goods and services, in view of their rapid rate of change. In the case of Information Technology products, Gandal (1994) computes these indexes for spreadsheets and sof-tware packages for personal productivity, and Nelson et al. (1994) do the same for personal computers. Berndt, Griliches and Rapoport (1995) do this too. Brown and Greenstein (2000) compute them for mainframe compu-ters as do Chewlos et al. (2008) for PDA.
In the area of applications, the literature is enormous. The technique has been applied widely from wine to housing markets with important results. An example of a selective survey of more recent developments with a focus on the housing market can be found in Malpezzi (2002) and further references are De Voor and Groot (2011) and Favero, Angelo and Belfiore (2008).
In their study of the Brazilian cell phone market, Rodrigues and Lucinda (2010) only focused on the pre-paid cell phone market, and sidestepped the problem of cell phones with zero price which is addressed here. Their approach is quite similar to that of Shi, Wildman and Hao (2010) in their study of the Chinese mobile market. Dewenter et al. (2007) also investigated the factors that determine handset prices in Germany, but they did not consider the characteristics of the plans which are bound to the handsets. Recent stu-dies, such as Watanabe, Nakajima and Ida (2010) use the hedonic price method to determine the strategies used by Japanese carriers to gain a market share when introducing new handset models. Their application of hedonic price models leads to the estimates of Quality Adjusted Price Indexes discussed above.
Karjaluoto et al. (2005) observed that, even though the main reason for changing handsets in Finland is the presence of operational problems, there are other fac-tors that affect the choice of a new cell phone - price, brand, interface and properties. However, it is important to draw a distinction between the selection of different cell phone models and brands and the reasons for chan-ging and/or buying them. Since the cell phone market is a technologically- driven market whose products and attributes are usually designed before consumers are aware of their needs, the development of cell phone models is based on what one expects the future needs of consumers to be. This means that companies that are better at predicting and meeting the future needs of consumers are able to release more successful pro-ducts onto this market.
Cell phones have attributes with instrumental and/or functional applications, such as battery time and calling minutes, among others; and hedonistic features, which provide pleasure, fun, and well-being, such as video recorder, MP3 player, etc. And as Wil-ska (2003) makes clear, the younger the consumer, the greater the value he/she tends to ascribe to the hedonistic features of a cell phone.
Despite the various applications that are linked to the hedonic price method, one should bear in mind that this method has some natural limiting factors. As Pakes (2002) underscored when he stated that, in a context of heterogeneous consumers, competition is based on product differentiation and adaptation to rapid technolo-gical changes (which can be found in the Brazilian cell phone market), in general, it is not possible to regard the parameters in the hedonic price equation as struc-tural parameters either on the demand side or on the production cost side; instead, they are a combination of both supply and demand aspects of the market that are analyzed here, that is, the Brazilian postpaid cell phone market.
METHODOLOGY
However, some choices had to be made for the cre-ation of the database. The first was to analyze the retail market of Brazilian postpaid cell phones for the following reasons: it has not been common to conduct academic studies in this sector; the information on this market is easy to obtain; the composition of attributes is more complex (due to the inclusion of calling minutes, subscription fees, etc); and the handset subsidy from the operators is larger. As for the supply chain of handsets, initially they were only sold by the operators themselves, both throu-gh their own stores and by authorized resellers. In the case of prepaid phones or, more recently, unlocked phones, the larger Brazilian retailers have become im-portant competitors to operators’ stores and authorized resellers. As regards post-paid cellular phones, the do-minant distribution channel still remains the operators’ stores and authorized resellers, because of the impor-tance of the subsidy.
With regard to the postpaid market, we will analyze the key characteristics for the pricing of handsets at stores and their implicit prices based on the attributes. We will use the hedonic price method to build models that can determine how much an attribute is valued by the consumer.
It was necessary to restrict the geographical region where handset prices were to be obtained (dependent variable), as each Brazilian state has the right to choose the tax burden (ICMS) that it will levy on cell phones. Since the same cell phone model has different prices depending on the Brazilian state that is surveyed, we decided to confine the study to the prices charged in the state of São Paulo , in view of the fact that it is the most important market sector in Brazil.
In addition, the study only took account of handsets equipped with GSM technology (which had the highest rates of adoption, growth and release of new products). Handsets with 3G (mobile broadband) technology were not used for data connection because most operators only introduced this service in 2008 and there were still few 3G handsets in the market at the time of the study; as a result, the existing coverage was also small, and the percentage of new 3G handsets being released was not significant. All in all, this would have caused a number of problems that could have affected the quality and consistency of this study.
This study included information on prices, plans and products offered to consumers on the website of three operators that sold postpaid handsets in the state of São Paulo in 2008: Vivo, Claro and TIM since Oi did not offer any product in this market in that year.
Whenever some question arose about the weekly data, the information was confirmed at the store of the operator under analysis, and in addition the website of at least one of the major retail stores of the state of São Paulo was visited –, namely, Ponto Frio, Magazine Lui-za, Lojas Americanas, Pernambucanas and Submarino.
Whenever available, we included the weekly prices of 48 cell phone models under nine different postpaid plans (three similar plans in each of the cell phone companies operating in the state). In addition, we also surveyed the characteristics of each plan.
After that, the database containing the market prices was compared with another database, which contai-ned the attributes of each of the 48 cell phone models whose prices had been previously investigated. The specifications of each handset were subjected to a tho-rough scrutiny on the website of the manufacturers of the six largest brands: Blackberry, LG, Motorola, Nokia, Samsung and Sony Ericsson – Apple was not officially present in Brazil in 2008.
At the end of the data survey, it was possible to ensure that the prices, plans and models reflected the weekly updates conducted by the market of postpaid GSM handsets offered to consumers in the state of São Paulo. A total number of 48 products were assessed, which represents a significant share of the sales obtai-ned by the operators, and there was a weekly update from January 3, 2008 to January 4, 2009, resulting in 27 different attributes and a total of 292,410 registers.
It should be highlighted that we did not exclude any case where the sales price of a handset might have been zero (free of charge) or high-priced, even if this might increase the risk of problems with the residuals generated by the developed model, as will be discus-sed in Section 5.
One of the most sensitive stages in the construction of a hedonic price model concerns the selection of explanatory or independent variables – in the present study, the handset attributes and characteristics of the plans – since it is essential to take note of the key fac-tors that make up and explain the dependent variable, (in this case the handset price), and given the fact that they must not be closely correlated.
possible to persuade consumers that it is advantageous for them to sign a postpaid plan.
As a means of reflecting the awareness of the con-sumer and the variables that influence this purchasing decision, we selected characteristics for the construction of the hedonic price model that depict the attributes most widely advertised in leaflets and on websites of cell phone operators and large retail stores. Not all of the selected attributes were advertised in a single ad, but they had all been observed in several ads throu-ghout the year of 2008.
As well as analyzing the advertising techniques of the operators and retail stores, we also asked (by means of unstructured interviews) market specialists for their opinions about which attributes and characteristics of handsets and postpaid plans were most important to consumers. In this way, it was possible to select some attributes or characteristics that are only perceived by the consumer at the time of the purchase, for instance, weight and dimensions, which are often assessed by making a comparison with competing models.
In what follows, we list the variables that were analyzed in this study and help determine the attributes and characteristics regarded as relevant by the consu-mer and that explain the purchasing decision and the price paid for a given postpaid handset:
• Qualitative variables (represented as dummy varia-bles in the different models deployed in this study): - Operator (TIM and Vivo are dummy variables.
Claro is the reference)
- Manufacturer (BlackBerry, Motorola, LG, Sam-sung and SonyEricsson are dummy variables. Nokia is the reference)
- Design (Flip and Slider are dummy variables. Candy Bar is the reference)
- External display (‘Yes’ is the dummy variable. ‘No’ is the reference)
- Data connection (EDGE and GPRS are dummy variables. No data connection is the reference) - Smartphone (Yes is the dummy variable. No is
the reference)
- MP3Player (Yes is the dummy variable. No is
the reference)
- MP3 ringtones (Yes is the dummy variable. No is the reference)
- FM radio (Yes is the dummy variable. No is the reference)
- Camera (Yes is the dummy variable. No is the reference)
- Video (Yes is the dummy variable. No is the reference)
- Video recording (Yes is the dummy variable. No is the reference)
- Bluetooth (Yes is the dummy variable. No is the reference)
• Quantitative variables:
- Subscription price (R$/month)
- Calling minutes offered (minutes/month) - Additional local calling minutes for the same
operator (minutes/month)
- On-net (calls between subscribers of the same operator) cost of additional local call minute (R$/minute)
- Off-net (calls between subscribers of different companies) cost of additional local call minute (R$/minute)
- Cost of additional local call minute to registered promotional users (R$/minute)
- Week (discrete variable from 1 to 53) - Volume (cm3)
- Weight (grams)
- Battery talking time (minutes) - Camera resolution (Megapixels) - Memory (Megabytes)
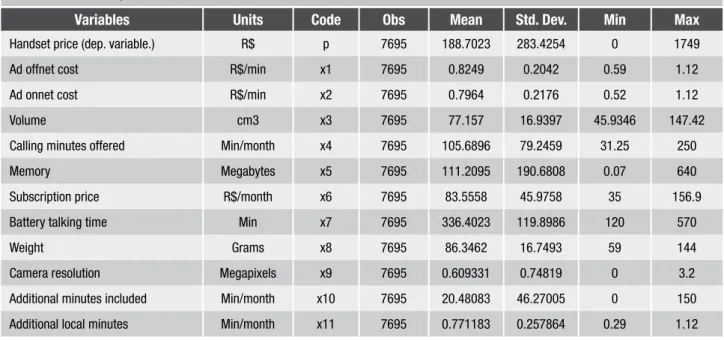
Some descriptive statistics for the quantitative va-riables are shown in Table 1 below. First of all, there is large variation in handset prices, ranging from zero – the handset completely subsidized by the operator – to R$ 1.749,00. With regard to the usage prices, the average price ranged from R$ 0,77 for additional local calls to R$ 0,83 for additional off-net calls (i.e. beyond the allotted amount included in the subscription). The highest price, R$ 1,12, is capped by the basic service plan, which all operators are required to file with the Regulatory Agency (ANATEL).
Given the importance of the handset volume for empirical studies on the subject (see DEWENTER et al (2007)), it is remarkable that there still remains a nota-ble difference between the sizes of the handsets which, range from approximately 46 cubic centimeters to 174 cubic centimeters.
Table 2 and discussed in the next section. The estimated equation can thus be represented as follows:
Pit = a + b1X1it + b2X2it + b3X3it + b4X4it + b5X5it +
b6X6it + b7X7it + b8X8it +b9X9it + b10X10it + + + + + + eit
In this equation, the X1,...X10 variables refer to the continuous variables represented in the second column of Table 1 above, the P variable represents the hand-set price. All the D variables shown refer to different qualitative characteristics: Ddesign is a set of dummies for the handset design features discussed above, Dmanufacturer for each manufacturer, the Ddata a set of dummies for data connection characteristics Doperator for each operator and Dmultimedia for multimedia characteristics (FM radio, Video Recording, MP3 Player, FM Radio, MP3 Ringtone, Smarthphone and Bluetooth). The subscript i refers to different bundles (handset and service plan) and t refers to the time period, and e is the econometric error term.
An additional factor is the large amount of obser-vations found equal to zero. This is a classic case of a truncated dependent variable, in which, from the stan-dpoint of the decision-maker, it is optimal for a given configuration of dependent variables of the model to establish a zero price for a handset.
To overcome this limitation, we use ordinary this assumption, we have to bear in mind that the
structure of prices and plans was stable throughout 2008, without the introduction of service plans that were handset-specific. Plans for specific handsets, that go beyond the scope of the present analysis and followed increasing attempts to popularize smartpho-nes and 3G handsets, were only launched in 2009.
Thus, we believe that examining the supply of handsets to the operators by the manufacturers is the most productive way to understand the identification strategy. On the basis of the price paid to the manu-facturers, the characteristics of the service plans and demand, the operator creates and adapts a menu of handset prices, which is conditional on the different benefits/services offered by the postpaid plan but not limited to only one handset.
Apart from the problem of identification, another concern is how to correct standard errors so that we can cope with the fact that there is probably a correlation between the errors for models of the same manufactu-rer. To tackle this problem, we calculated the clustered standard errors for different manufacturers and for the sampled week, as Wooldridge (2002) recommends. An inference is made from these standard errors using conventional statistics.
With regard to the functional form, we used alter-natives in which the quantitative independent variables were incorporated linearly in the function, as shown in
Variables Units Code Obs Mean Std. Dev. Min Max
Handset price (dep. variable.) R$ p 7695 188.7023 283.4254 0 1749
Ad offnet cost R$/min x1 7695 0.8249 0.2042 0.59 1.12
Ad onnet cost R$/min x2 7695 0.7964 0.2176 0.52 1.12
Volume cm3 x3 7695 77.157 16.9397 45.9346 147.42
Calling minutes offered Min/month x4 7695 105.6896 79.2459 31.25 250
Memory Megabytes x5 7695 111.2095 190.6808 0.07 640
Subscription price R$/month x6 7695 83.5558 45.9758 35 156.9
Battery talking time Min x7 7695 336.4023 119.8986 120 570
Weight Grams x8 7695 86.3462 16.7493 59 144
Camera resolution Megapixels x9 7695 0.609331 0.74819 0 3.2
Additional minutes included Min/month x10 7695 20.48083 46.27005 0 150
Additional local minutes Min/month x11 7695 0.771183 0.257864 0.29 1.12
least square estimates together with the TOBIT mo-del, based on the maximum likelihood method. The likelihood function for this type of model is made up of two parts: the first corresponds to the probability that a handset price is equal to zero, whereas the se-cond employs a probabilistic model for establishing a correlation between the prices and attributes of the handsets when the price is greater than zero. For te-chnical details and the exact formula of the estimator, see Wooldridge (2002, p. 529). The computations were carried out by Stata, version 9.0 software.
Obviously, in this case, the marginal effects from the change in each of the attributes can be considered in two different ways, which are as follows: 1) if the handset price is greater than zero, what is the effect of a marginal change in one of the handset features? 2) does this model allow us to assess the effects of a marginal change on observing a price that is greater than zero? In other words, this second type of marginal effect shows the effects on the probability of having full handset subsidy after a change in the attributes or characteristics of a handset and service plan. The models were also estimated by ordinary least squares, so that they could provide a comparison.
One last key feature regarding methodology is that the handset which is regarded as the basis – correspon-ding to a zero value for all the categorical variables – corresponds to a Nokia candy bar, from Claro, without data connection, external display or any multimedia features.
ECONOMETRIC ANALYSIS
Table 2 provides the results of the developed model. In the first column, there is the model estimated by OLS, followed by the column with the results of the TOBIT model and, finally, the marginal effects. The first column of the marginal effects shows the effects of a marginal change in one attribute on the handset price, which is conditional on the handset price be-ing greater than zero. The second column describes the effects of a marginal change in the attributes on the probability of a handset price being greater than zero, that is, the effect of a change in attributes on the likelihood of a handset having a full subsidy.
Regardless of their functional form, the variables selected for the developed model, , explain a large number of the price fluctuations in the cell phone
market, with R2 adjusted from 85t o 86%. For the sake of comparison, we calculated the squared correlation coefficient between the predicted values and observed in the TOBIT model, and the resulting measurement was quite similar to that of the OLS.
We decided to display the model with all its varia-bles – and avoid removing those which are not signi-ficant – for two reasons: even though some attributes do not seem to be significant, they might be correlated with unobserved attributes of quality and their removal from the equation could bias the estimated coefficients for the remaining attributes. The second reason the non-significant variables are retained is the number of observations in the dataset, which [alleviate] mitigate the loss of efficiency caused by the loss of degrees of freedom from these additional non-significant variables. Malpezzi (2002, p. 18) recommends a more parsimo-nious model, which despite experiencing biased coeffi-cients resulting from the omission of relevant variables, could be better for forecasting, individual coefficients even if it could not be used for interpretation. Since in this application the focus is on the estimated coefficient, these non-significant variables will be retained (even though their coefficients will be considered to be zero).
With regard to the interpretation of coefficients, the starting-point is to identify what categories should be treated as the basis for qualitative variables. It should be remembered that the handset regarded as the basis was a Nokia candy bar, from Claro, without data con-nection, external display or any multimedia features.
As for the coefficients related to qualitative varia-bles, the interpretations will be based on the TOBIT model results, in columns (3) and (4) of Table 2 shown on the previous page. With regard to the dummy va-riables of the operators, all the models show that TIM has the lowest prices. Assuming that everything else remains constant, the same handset sold by TIM tends to be R$ 12,51 cheaper than that sold by Claro or Vivo. In addition, there is a 1,99% reduction in the probabi-lity of positive prices being observed if the handset is offered by this operator.
With regard to the cell phone manufacturers, three operators show differences that can be linked to the basic category. On the one hand, in Blackberry there is a positive difference in prices, between R$ 337,40 from that of Nokia. On the other hand, LG had a lower price than that of other categories, allowing for differences in other handset attributes and service plan characteristics. This difference amounts to approximately R$ 48,09.
(1) (2) (3) (4)
OLS TOBIT Marg. Eff. E(p|p>0) Marg. Eff. Pr(p>0)
Subscription price -5.346 ** -2.294 -1.750 -0.00269
(-4.55) (-1.35) (-1.41) (-1.21)
Calling minutes offered 2.505 ** 1.072 0.817 0.00126
(4.99) (1.47) (1.54) (1.31)
Week -3.252 *** -3.785 *** -2.886 *** -0.00444 ***
(-7.18) (-8.26) (-9.99) (-4.51)
operator==TIM (d) -6.595 -16.52 *** -12.51 *** -0.0199 **
(-1.65) (-4.27) (-4.79) (-3.09)
operator==Vivo (d) -15.33 19.16 14.77 0.0215
(-0.94) (1.09) (1.03) (1.34)
manufacturer==Blackberry (d) 377.4 *** 358.0 *** 337.4 *** 0.0887 ***
(8.11) (7.79) (7.95) (3.68)
manufacturer==LG (d) -61.85 * -67.79 *** -48.09 *** -0.104 ***
(-3.68) (-4.78) (-4.66) (-3.97)
manufacturer==Motorola (d) -14.74 -28.09 -20.94 -0.0361
(-0.81) (-0.92) (-0.94) (-0.84)
manufacturer==Samsung (d) 56.38 65.23 * 53.25 * 0.0556 **
(1.81) (2.40) (2.27) (2.85)
manufacturer==Sony Ericsson (d) 11.35 30.03 23.63 0.0307
(0.48) (1.12) (1.06) (1.38)
design==lip (d) 9.750 23.92 18.23 0.0282
(0.39) (0.88) (0.87) (0.89)
design==slider (d) 62.78 * 73.08 *** 59.90 *** 0.0610 ***
(3.59) (4.02) (3.41) (5.70)
Data==edge (d) -21.42 -20.96 -15.94 -0.0248
(-0.81) (-0.96) (-0.94) (-1.00)
Data==GPRS (d) -63.37 * -75.45 *** -54.99 *** -0.106 ***
(-2.81) (-4.59) (-4.49) (-3.88)
Camera x megapixels 108.6 ** 105.7 *** 80.62 *** 0.124 ***
(6.01) (5.18) (5.09) (4.22)
Video recording (d) 57.55 66.82 * 50.90 * 0.0793 *
(2.24) (2.26) (2.16) (2.36)
MP3_player (d) -32.51 -37.55 -28.58 -0.0445
(-0.99) (-1.07) (-1.07) (-1.05)
Smartphone (d) 546.2 *** 583.8 *** 547.0 *** 0.177 ***
(10.27) (10.37) (9.36) (7.73)
Table 2 – Model 1 – OLS and TOBIT results
in the table suggest that, if everything else remains constant, data connection using GPRS technology reduces the price by R$ 54,99, which shows that Brazilian phone companies were subsidizing ena-bled data connection handsets in 2008. The result is at odds with the results of Shi, Wildman and Hao (2010) who find positive signs of the presence of a 3G connection. As regards multimedia features, not all of the categorical variables were significant. The existence of FM radio was the only one that was consistently significant in all the specifications, and yielded a positive premium of R$ 42,45. Two other attributes that were regarded as important in some models – but as unimportant in others – were the
existence of Bluetooth and MP3 ringtones. Neither proved to be significant. However, Video recording and Camera features appeared to be significant, as in Shi, Wildman and Hao (2010).
Finally, with respect to quantitative variables, volu-me was the only significant quantitative variable , with one cubic centimeter of volume corresponding to a pri-ce reduction of R$ 2.75. This is the same result as that given in the paper by Shi, Wildman and Hao (2010), although their result is based on a density variable. Similarly, increases in volume tend to be attributed to increases in the probability of a full handset subsidy. Dewenter, et al (2007), in their earlier study for the Ger-man market also obtained this result, making it one of
(1) (2) (3) (4)
OLS TOBIT Marg. Eff. E(p|p>0) Marg. Eff. Pr(p>0)
MP3 ringtones (d) 34.49 39.54 29.43 0.0511
(1.28) (1.85) (1.92) (1.62)
Ad_offnet_cost 71.45 284.6 *** 217.0 *** 0.334 ***
(2.12) (4.17) (3.63) (5.18)
Battery talking time -0.0691 -0.118 ** -0.0898 ** -0.000138 **
(-1.87) (-3.14) (-2.97) (-3.19)
Fm_radio (d) 49.62 ** 56.16 *** 42.45 *** 0.0686 ***
(5.76) (5.51) (5.10) (4.82)
Weight 1.510 2.831 2.159 0.00332
(1.50) (1.57) (1.57) (1.54)
Memory -0.0491 -0.0959 -0.0731 -0.000112
(-0.71) (-1.28) (-1.22) (-1.39)
Volume -2.572 * -3.610 * -2.752 * -0.00423 *
(-2.78) (-2.38) (-2.35) (-2.29)
Bluetooth (d) -18.24 -23.09 -17.64 -0.0269
(-1.76) (-1.50) (-1.52) (-1.43)
Constant 330.7 ** 15.24
(4.87) (0.14)
sigma 116.7 ***
(10.37)
N 7695 7695 7695 7695
R2 .8593
Pseudo R2 .1446 .1446 .1446
R2-ML .8326 .8326 .8326
T statistics in brackets
the most recurring regularities in all studies(including the present one).
To sum up, the results of our model suggest that there are differences in the pricing policies of the ope-rators, since TIM was found to provide higher handset subsidies (by charging lower prices) than its competi-tors, which could be the result of a better negotiating position with regard to handset manufacturers or more aggressive pricing policies. These conflicting inter-pretations could not be resolved through our current methodology, and must be left for further research.
These results also show that there are differences between the handset manufacturers and their brands with respect to their prices. At one extreme, there is LG with a lower handset price than other manufacturers (everything else being equal), and on the other, there is Research in Motion (the manufacturer of Blackberry) with much higher prices than our baseline handset.
Finally, the valuations of handset characteristics reveal which ones are both more valuable to the consu-mer as well as more expensive to produce. Both battery time and volume are important variables to explain the handset prices, since there are smaller volume handsets and handsets with longer battery lives. The results for volume are in line with what is found in the internatio-nal literature (such as DEWENTER et. al. 2007). Apart from physical characteristics, other attributes are also important, such as a slider handset format. In addition, there is the question of whether the handset can be considered to be a smartphone and if the handset has video recording capabilities, and could foresee the success of the iPhone in the following year.
CONCLUSIONS
The aim of the present study was to define the determi-nants of handset prices, when they are bound to post-paid plans. To achieve this , we built a database of ap-proximately 48 handsets, under nine different categories of service plans, over a period of 53 weeks in 2008 (in-cluding the last days of 2008 and first days of 2009 so as not to lose the post-Christmas sales promotion),making a total of nearly 300,000 data registers. In terms of em-pirical methodology, the approach used here is based on hedonic price models, whose goal is to determine the implicit prices that the characteristics of handsets and of the service plan have in the market.
The results given here may also be important for
the debate on the use of handset subsidies, which have a drawback – the high rates for the interconnection of postpaid and prepaid plans in Brazil. If consumers va-lue new and better features such as higher-resolution cameras or Bluetooth, which are combined with positive network external features , it may be a more efficient way of increasing the subsidies even if the cell phone penetration per inhabitant amounts to more than 100%. Although it is not within the scope of this study to con-duct a discussion on the level of penetration per inha-bitant relative to new and socially efficient features, the results obtained here are certainly of value to this debate. Two methods of estimation were employed to deal with the existence of full handset subsidies: first the ordinary least squares method and then the maximum likelihood (TOBIT). The analysis showed that handset prices are reduced by R$ 1.17 for each additional real paid for the subscription of the service plan. Each additional minute included in the service plan tends to increase handset price by approximately R$ 0.80. With regard to handset attributes, volume and camera resolution (megapixels), these were the major price premium – the larger the handset, the less expensive it becomes, and the more megapixels a camera contains, the more expensive the handset is. With regard to operators, TIM was the one with a statistically different behavior, and had lower pri-ces than the other operators. With regard to the manu-facturers, LG had lower prices and Blackberry showed the largest price differential, – over 337 Brazilian Reais, with respect to the base model.
Additional studies will be welcome to explain the remainder of the price (around 15%) that was not co-vered by the model employed in this article, as well as changes in market conditions, such as those brought about by the number, portability and mandatory unlo-cking of the cell phones.
REFERENCES
BERNDT, E. R, GRILICHES, Z; RAPPAPORT, N. J. Econo-metric estimates of price indexes for personal computers
in the 1990’s. Journal of Econometrics, v. 68, n. 1, p.
243-268, 1995.
BUSINESS INTERNATIONAL LIMITED. BMI’s Industry Survey & Forecasts Series - Brazil Telecommunications Report Q1, 2009. London, 2009. 95 p.
CHWELOS, P. D; BERNDT, E. R; I. M. COCKBURN. Faster, smaller, cheaper: an hedonic price analysis of PDAs. Applied Economics, v. 40, n. 22, p. 2839-2856, 2008.
DE VOOR, F; GROOT H. L.F. de. The Impact of Industrial Sites on Residential Property Values: A Hedonic Pricing
Analysis from the Netherlands. Regional Studies, v. 45, n.
5, p. 609-623, 2011
DEWENTER, R; HAUCAP, J; LUTHER, R; ROTZEL, P. Hedonic prices in the German market for mobile phones. Telecommunications Policy, v. 31, n. 1, p. 4-13, 2007.
FARRELL, J; KLEMPEREr P. Coordination and Lock-In: Competition with Switching Costs and Network Effects. Oxford, Inglaterra, 2001. Avaliable at: http://www.nuff. ox.ac.uk/users/klemperer/lockinwebversion.pdf. Acess on 20.01.2010.
FÁVERO, L. P. L; ANGELO, C. F; BELFIORE, P. P. Supply and demand determinants: an empirical study of
residen-tial properties in Sao Paulo, Brazil. International Journal
of Management, v. 25, n. 1, p. 512-531, 2008.
GANDAL, N. Hedonic Price Indexes for Spreadsheets and
an Empirical Test for Network Externalities. RAND
Jour-nal of Economics, The RAND Corporation, v. 25, n. 1, p. 160-170, 1994.
GRILICHES, Z. Hedonic Price Indexes for Automobiles: An
Econometric Analysis of Quality Change. Columbia
Univer-sity Press for the National Bureau of Economic Research, General Series, n. 73, p. 137-196, 1961.
GRUBER, H. The Economics of Mobile Telecommunications.
Cambridge: Cambridge Press, 2005. 323 p.
KARJALUOTO, H; KARVONEN, J; KESTI, M; KOIVUMÄKI, T; MANNINEN, M; PAKOLA, J; RISTOLA, A; SALO, J. Fac-tors Affecting Consumer Choice of Mobile Phones: Two
Studies from Finland. Journal of Euromarketing, v. 14, n.
3, p. 59-82, 2005.
LANCASTER, K. J. A New Approach to Consumer Theory. The Journal of Political Economy, v. 74, n. 2, p. 132-157, 1966.
MALPEZZI, S. Hedonic Pricing Models: A Selective and
Applied Review. Wisconsin-Madison Culer working papers
02-05, University of Wisconsin Center for Urban Land Eco-nomic Research, 2002
NELSON, R. A; TANGUAY, T. L; PATTERSON, C. D. A
Qua-lity-Adjusted Price Index for Personal Computers. Journal
of Business & Economic Statistics, American Statistical As-sociation, v. 12, n. 1, p. 23-31, 1994.
PAKES, A. A Reconsideration of Hedonic Price Indices with
an Application to PC’s. National Bureau of Economic
Re-search, Working Paper n. 8715, 2002.
RODRIGUES, A. M. O; LUCINDA, C. R. Um modelo de
preços hedônicos para celulares pré-pagos. Revista de
Economia e Administração do Insper, v. 9, n. 2, p. 247-269, 2010.
ROSEN, S. Hedonic Prices and implicit Markets: Product
Differentiation in Pure Competition. The Journal of
Politi-cal Economy, v. 82, n. 1, p. 34-35, 1974.
SHI, K.C; WILDMAN, S. S; XIAOMING H. What is the profit--making model? The hedonic analysis of mobile handsets
in China. In: The 9th International Conference on
Mobi-le Business, 2010, Athens, Greece. Anais. Athens, The 9th Global Mobility Roundtable, 2010.
TRAIN, K. E. Discrete choice methods with simulation.
Cam-bridge: Cambridge University Press, 2003. 334 p.
WATANABE, N; NAKAJIMA, R; IDA, T. Quality-Adjusted Prices of Japanese Mobile Phone Handsets and Carriers
Strategies. Review of Industrial Organization, v. 36, n. 4,
p. 391-412, 2010.
WILSKA, T. A. Mobile phone use as part of young people’s
consumption styles. Journal of Consumer Policy, v. 26, n.
4, p. 441-463, 2003.
WOOLDRIDGE, J. M. Introductory Econometrics. Ohio:
South-Western, 2002. 684 p.
YAMAMOTO, C. S. Retorno do investimento em