Inheritance of tolerance to
Cowpea Mild Mottle Virus
in soybean
Carlos A Arrabal Arias1*, Alvaro M R Almeida1, Tatiana Mituti2 and Elliot W Kitajima3
Received 17 December 2013 Accepted 16 October 2014
Abstract – Soybean stem necrosis is caused by Cowpea mild mottle virus (CPMMV) and it has been recognized as an emerging and economically important disease in Brazil. No resistant, but only tolerant cultivars have been identiied so far, and their genetic control is still unknown. To investigate the inheritance of soybean tolerance to CPMMV, two crosses between tolerant cultivars (BRS 133 x BRSMT Pintado), and between a susceptible (CD 206) and a tolerant cultivar (BRSMT Pintado) were carried out to obtain F2 and F2:3 generations. Quantitative and qualitative analyses applied to the data from greenhouse evaluations showed that there are at least two distinct major genes determining tolerance to CPMMV, one in the soybean cultivar BRS 133 and another in the cultivar BRSMT Pintado, with predominance of additive genetic effects and heritability levels that allow for eficient selection based on early generation means.
Key words: Breeding, Glycine max, CPMMV, virus tolerance, tolerance gene.
Crop Breeding and Applied Biotechnology 15: 132-138, 2015 Brazilian Society of Plant Breeding. Printed in Brazil
ARTICLE
http://dx.doi.org/10.1590/1984-70332015v15n3a24
1 Embrapa Soja, Rodovia Carlos João Strass, s/n, acesso Orlando Amaral, CP 231, Distrito de Warta, 86.001-970, Londrina, PR, Brazil. *E-mail: [email protected] 2 Universidade Estadual Paulista (UNESP), Faculdade de Ciências Agronômicas, Campus de Botucatu, CP 237, 18.603-970, Botucatu, SP, Brazil
3 Universidade de São Paulo, Escola Superior de Agricultura Luiz de Queiroz, Agronomia, CP 9, 13.418-900, Piracicaba, SP, Brazil INTRODUCTION
Stem necrosis is caused, among other plant viruses, by Cowpea mild mottle virus (CPMMV), a problem that has been affecting soybean crop in Brazil (Almeida et al. 2005)
and in Argentina (Laguna et al. 2006). CPMMV was irst identiied infecting common beans (Costa et al. 1980), and
since 2001 has spread throughout the states that grow soy-bean, and has been recognized as a quickly emerging and economically important virus in this country. It is
transmit-ted by white lies (Bemisia tabaci) in a non-persistent way (Iwaki et al. 1982, Muniyappa and Reddy 1983) and belongs to the genus Carlavirus, with a very restricted host range. A new outbreak of the disease occurred again in 2002,
devastating soybean ields, mainly cultivars UFV-19 and
Mirador, in different Brazilian regions. Recently, the disease has also been observed infecting soybean in India during the 2011 and 2012 seasons (Yadav et al. 2013).
Polymerase chain reaction (PCR), according to Badge et al. (1996), permitted to identify a band of 120 kb, which is a characteristic of CPMMV. Photomicrography presented a feather-like inclusion, another characteristic of Carlavirus.
Puriication of this virus produced a protein band of 29 Da.
Major symptoms include severe mosaic with blisters
on upper leaves, stem necrosis, brittle buds and stunting. Symptoms start appearing 2-3 weeks after infection,
usu-ally at blooming stage. Whitelies can acquire and inoculate the virus during supericial try that take only a few seconds
(Iwaki et al. 1982, Muniyappaand Reddy 1983, Perring et al. 1999), making the use of insecticides impractical.
Moreover, vectors migration to soybean ield from outside
during the season is a continuous process.
Therefore, much effort was directed toward identifying resistance sources. Through indirect ELISA, it was proved that resistant genotypes contained high titer of virus. After-wards, they were called tolerant (Hull 2002). Tolerance was observed among few commercial genotypes. The present study was carried out to investigate the inheritance of toler-ance to CPMMV in soybean.
MATERIAL AND METHODS
Genetic material
Two CPMMV tolerant cultivars, BRS 133 and BRSMT Pintado, and one susceptible cultivar, CD 206, were used in
this study. These three cultivars received this classiication
Londrina, PR. Cultivars BRS 133 and CD 206 have good adaptation to the South and Southeast Brazilian regions, and belong to the maturity group (MG) VII and VI, respectively. Cultivar BRSMT Pintado belongs to MG VIII, and presents good adaptation to the Center-West Brazilian region. For this work, seeds from individual plants for each cultivar were used to discard the possibility of genetic variability within the parental generation, since these cultivars have never been submitted to intentional selection for this trait.
Experimental seed production
Two crosses were carried out with tolerant and susceptible cultivars during the 2011/12 growing season in greenhouse environment: one of them was a tolerant x tolerant cross type (TT = BRS 133 x BRSMT Pintado), and the other one was a susceptible x tolerant cross type (ST = CD 206 x BRSMT Pintado). A portion of F1 seeds was used to produce the F2 seeds in greenhouse on February, 2012. The remaining F1
seeds were stored in the cold chamber. Traits like lower and pubescence colors were assessed to conirm the true
hybridizations. Parental generation, and remaining F1 and F2 generations were sown in greenhouse in July, 2012 in order to produce new seeds for parental, F2 and F3 generations, respectively. This procedure was carried out to obtain seeds with same age for all generations. A sample of about 150 seeds was randomly taken from the F2 seeds to originate the F2:3 families (F3 family derived from a single F2 plant).
Experimental design
A completely randomized design experiment was car-ried out under greenhouse conditions at Embrapa Soybean, in Londrina-PR, to study the inheritance of tolerance to CPMMV in these two crosses. The generations of TT and ST crosses were grown and tested on November and December of 2012, respectively. The accessions consisted of: 20 plants of each tolerant parental, 20 plants of susceptible parental, 100 F2 plants derived from each of the two crosses, 150 F2:3 families from each cross, and each family was represented
with ive plants. Each plant was grown in individual pots,
and each pot represented a plot or an experimental unit.
Pots with 4 kg soil capacity were illed with a mixture of
soil, sand and manure in a proportion of 1:2:1, treated with heated steam, at temperatures ranging from 100 to 150 oC.
Virus source, maintenance and inoculation
CPMMV was isolated from soybean plants collected in Barreiras, State of Bahia, in 2001. It was maintained in CD 206 cultivar through mechanical inoculation with phosphate buffer 0.01M, pH 7. Inoculation was carried out in the V2 soybean growth stage.
Scoring method and indirect ELISA
Individual plants at V4 and V6 soybean growth stages were rated for symptoms using the uppermost three trifoliate leaves according to the following scale: 1= symptomless; 2= very mild mosaic; 3= vein clearing and pronounced mosaic; 4=severe mosaic with blister and/or systemic necrosis.
Antiserum to CPMMV was obtained at Embrapa
Soybean´s laboratory, according to the method for puriica -tion described by Gaspar et al. (1985), and indirect ELISA (enzyme linked immunosorbent assay) was used essentially as described by Koenig (1981). Goat anti-rabbit IgG con-jugated to alkaline phosphatase (Sigma Immunochemicals)
was used at a dilution of 1:6000. Plates were irst incubated
overnight at 4 °C with antigen. At the following steps, plates were incubated during 4 h at 37 °C with IgG. Substrate (p- nitrophenylphosphate was added at 1.0 mg mL-1 in 10% diethanolamine, pH 9.8), and reactions were allowed to develop for 30 min under room temperature. A sample was considered positive for CPMMV infection when the ELISA absorbance value (at 405 nm) was greater than the average absorbance value for healthy uninoculated control tissue plus three standard deviations.
Inheritance analysis
The quantitative analysis (Mather and Jinks 1982) of the four generations (P1, P2, F2 and F3) applied on the means
and variances allowed the estimation of up to four and ive
components of a genetic model, respectively. When fewer
components were signiicant, a goodness-of-it test of the
model was carried out. Estimation of mean components included the genetic component m, the additive effect [d], the dominance component [h], and non-allelic interactions (additive by additive [i] or dominant by dominant [l]). Es-timation of variance components included the additive (D) and dominance (H) genetic variance and the environmental variance (E, E1 and E2). The narrow sense heritability also was estimated at plant level based on variance estimates. RESULTS AND DISCUSSION
ELISA results
from asymptomatic plants of cultivars BRS 133 and BRSMT
Pintado conirm their high virus concentration, and they were classiied as tolerant (Hull 2002).
The three parental cultivars conirm the expected reac -tion to CPMMV (Table 1) in the two soybean growth stages assessed (V4 and V6). The cultivar CD 206 presented grade means for disease severity greater than the other cultivars (p < 0.05), reaching 3.6 and 3.8 in the assessments carried out in the V4 and V6 soybean growth stages, respectively.
The mean grade for disease increased (but not signiicantly)
from V4 to V6 for this cultivar, unlike the other two tolerant
cultivars. This result conirms the high susceptibility reaction
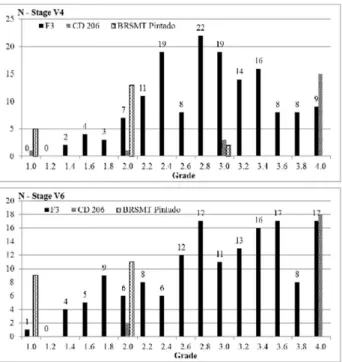
of CD 206. Besides its high susceptibility, two individual plants (in a total of 20) received grades 1 and 2 at stage V4, and grade 2 at V6 (Figure 2). At stage V6, all remaining plants of CD 206 received grade 4. The two exceptions occurred probably due to microenvironmental variations.
Cultivar BRSMT Pintado showed an average grade of 1.85 and 1.55 for the assessments at V4 and V6 (Table 1),
respectively. These values were signiicantly less in relation to the means of susceptible cultivar CD 206, conirming the
previous results obtained with soybean cultivars (Almeida et al. 2003). The cultivar BRS 133 showed the biggest level
of tolerance to CPMMV. Its mean signiicantly differed
(p<0.05) from CD 206, but not from BRSMT Pintado at V4, and differed from both other cultivars at V6. Plants representing the cultivar BRS 133 received only grades 1 or 2 along the two assessments (Figure 1). From the eight plants of BRS 133 with grade 2 at V4, only two of them had the same grade, while the remaining six plants expressed the process of “recovering” and reduced their grade to 1. A similar process occurred with the cultivar BRSMT Pintado, which had two plants with grade 3, and 13 plants with grade 2 at V4 stage, and afterwards presented only 11 plants with grade 2 at V6 stage. As previously discussed, no recovering was observed for the susceptible cultivar CD 206.
It is important to emphasize that the variances related to these cultivars at V6 stage were always lower than V4 (Table 1). As the three cultivars are genetically uniform for the character, all these variances can be considered as
estimators of environmental variance. Normally, the higher the mean the higher the variance and the reduction of culti-var culti-variance could be attributed to the reduction of means
from the irst to the second assessment. Therefore, in the
case of the susceptible cultivar CD 206, despite the increase
or maintenance of the mean (not signiicant), there was a
reduction in variance. Thus, it is possible to conclude that the assessment performed at V6 stage, besides expressing greater divergence between tolerant and susceptible culti-vars, was less affected by microenvironmental variations, increasing the reliability on trait expression.
The means for F2 and F3 generations derived from the cross between the tolerant cultivars BRS 133 and BRSMT Pintado were respectively 2.24 and 2.05 at V4 (Table 2). These values are higher than the mean value for the two parental cultivars in the same assessment (parental average = 1.625), evidencing the presence of dominance directional to susceptibility or some type of non-allelic interaction, what
can be conirmed in the genetic models. The same pattern
was observed in the second assessment, with means of 1.86 and 1.74 for the F2 and F3 generations, respectively, higher than the means of parental cultivars, which was 1.325 (Table 2). Variances related to F2 and F3 generations of this cross were higher than the variances of the two tolerant cultivars.
For the crossing between susceptible cultivar CD 206 and
Table 1. Degrees of freedom (df), means and variances (V) for the trait tolerance to CPMMV at V4 and V6 stages of soybean cultivars assessed using a scale of notes varying from 1 (more tolerant) to 4 (more susceptible)
Cultivars
V4 V6
df mean* V mean V
BRS 133 19 1.40 b 0.25 1.10 c 0.09
CD 206 19 3.60 a 0.67 3.80 a 0.38
BRSMT Pintado 19 1.85 b 0.34 1.55 b 0.26
* Means followed by the same letter in the column do not differ by Tukey test (p<0.05)
tolerant cultivar BRSMT Pintado, higher variance for the F2 and F3 generations were expected, given the higher genetic diversity of parental cultivars (Table 2). In this crossing, following a pattern very different from that observed in the
parental cultivars, the variances increased from the irst (V4)
to the second assessment (V6). As seen with parental data, there was a reduction of environmental variance from V4 to V6 and, therefore, this increase of total variance can be only attributed to an increment of genetic variance. Thus, for this cross, a more favorable situation exists for carry-ing out genetic studies with assessments based on grade for CPMMV at V6 soybean stage. Favorable attributes, such as greater genetic diversity and greater experimental precision are combined.
Mean and variance genetic models
It was possible to it genetic models to the means and
variances for the two crosses and for the two soybean
de-velopment stages (Table 3). Besides itting the models with only signiicant estimates, it always remained degrees of
freedom to use the chi-square to test the model’s
goodness-of-it. Chi-square tests produced probabilities ranging from
6% to 93%; thus, no genetic model was rejected (p<0.05). Priority was always given for simpler genetic models. For instance, if an additive-dominant model was not rejected, other more complex models (e.g. including non-allelic ef-fects) were avoided.
Cross BRS 133 x BRSMT Pintado (TT)
Considering this cross including two tolerant cultivars, there was a predominance of additive genetic effect in the inheritance of tolerance to CPMMV (Table 3). This effect
was signiicant both in the mean models [d] as in the vari -ance models (D) for the two of soybean development stages. The estimates of [d] were similar for the two development stages, and the magnitudes of these values were relatively
Table 2. Degrees of freedom (df), means and variances (V) for the trait tolerance to CPMMV at V4 and V6 stages of F2 and F3 generations derived from the two crosses, assessed using a scale of notes varying from 1 (more tolerant) to 4 (more susceptible)
Cross/Generation V4 V6
BRS 133 x BRSMT Pintado df mean V mean V
F2 99 2.24 0.69 1.86 0.63
F3 749 2.05 0.69 1.74 0.57
F3b 149 1.15 1.00
F3w 600 0.58 0.46
CD 206 x BRSMT Pintado df mean V mean V
F2 100 3.02 0.81 3.01 1.06
F3 749 2.88 1.03 2.95 1.22
F3b 149 1.95 2.80
F3w 600 0.79 0.82
Table 3. Genetic parameters itted to mean and variances of the degree of tolerance to CPMMV assessed on soybean stages V4 and V6 in the crossings
TT (BRS 133 x BRSMT Pintado) and ST (CD 206 x BRSMT Pintado)
Crossings
Genetic parameters1 TT ST
V4 V6 V4 V6
m 1.72 ± 0.06 1.75 ± 0.03 2.73 ± 0.08 2.74 ± 0.07
[d] 0.24 ± 0.08 0.22 ± 0.07 0.88 ± 0.10 1.14 ± 0.09
[h] 1.22 ± 0.24 - 0.58 ± 0.28 0.71 ± 0.27
[i] - -0.43 ± 0.07 -
-X2/df 3.07/1 2.04/1 0.01/1 1.84/1
Probability 0.08 0.15 0.93 0.17
D 0.25 ± 0.06 0.24 ± 0.05 0.48 ± 0.09 0.89 ± 0.13
H - - -
-E 0.51 ± 0.04 - 0.65 ± 0.05 0.57 ± 0.06
E1 - 0.57 ± 0.09 -
-E2 - 0.23 ± 0.07 -
-X2/df 4.10/3 5.75/2 2.79/3 4.72/3
Probability 0.25 0.06 0.43 0.19
small in relation to the mean m (about 14% in V4 and 13% in V6, Table 3). Small effect of [d] was expected for this cross since the two cultivars are tolerant. Still considering the mean models, the non-additive effects appeared through dominance [h] directional to susceptibility at stage V4, and through additive x additive epistasis [i] directional to tolerance at V6. The magnitudes of [h] and [i] were greater than the respective additive effects [d] at V4 and V6. The difference between these two non-additive effects is that
only [i] can be ixed at commercial soybean cultivars in
the form of pure lines. Considering this is a cross between tolerant cultivars, it is possible to conclude that the genes controlling tolerance in these soybean cultivars are not the same, and there are at least two segregating genes control-ling the character in this cross.
In the variance models, the estimated values for the ad-ditive variance D at stages V4 and V6 are very close (Table 3). The magnitude of additive variance D in relation to the environmental effects (E at V4 and E1 and E2 at V6) was relatively small, reaching proportions of 49% at V4 and 60% at soybean stage V6. The difference between the two models is the presence of genotype by microenvironmental
interaction, veriied by the signiicance of E1 and E2 in the
model for the stage V6. The genotype by microenvironmental interaction occurred as a consequence of very low variance of cultivar BRS 133 for the assessment at V6 stage, about a third of the value of other tolerant cultivar BRSMT Pintado (Table 1). The estimates of narrow sense heritability at in-dividual plant level were 0.20 for V4, and 0.23 for V6. The conclusion is that there is genetic variability in this cross, and that the heritability for the character is average, requiring strategies to reduce the environmental effect, as using more replications, or families with expressive number of plants, consequently avoiding the assessment of individual plants.
The frequency distribution (Figure 1) for the mean of F3 families followed a continuous distribution standard at V4, without the establishment of distinct phenotypic classes. However, for the assessment at stage V6, the frequency distribution for the tolerance grade followed a discontinuous pattern, being able to identify some F3 families with increased susceptibility in relation to the other families. This may indicate the presence of major genes determining the trait and allowing the arrangement of distinct phenotypic classes.
Cross CD 206 x BRSMT Pintado (ST)
This cross between a susceptible and a tolerant cultivar also presented predominance of additive genetic effect in the inheritance of tolerance to CPMMV. Additive effect was
signiicant both in the mean models [d] and in the variance
models (D) for the two stages of soybean development. The estimate of additive genetic effect [d] increased from stage V4 to V6, reaching proportions of 32% and 42%, respectively, in relation to the estimate of the mean m (Table 3). Higher values for the estimates of [d] were expected for this cross, as a result of higher genetic diver-gence between the parental cultivars. Only the dominance
[h] was signiicant among the non-additive effects for the
both stages of soybean development. The positive sign of [h] both for V4 andV6 shows that the dominance is directional to susceptibility, as also seen in the cross TT for the assess-ment at V4. The magnitudes of [h] were lower in relation to respective additive effects [d] at V4 and V6, which can help in the process of selection for tolerance to this disease.
In the variance models, the estimates of environmental variances (E) at V4 and V6 were similar to the estimates obtained in the first cross (Table 3), although most of generations involved in this cross have higher mean for the character.
The estimated value for the additive variance D for the stage V6 was almost twice the estimated value at V4 (Table 3). The magnitudes of the additive variance D in relation to environmental effects E was higher than that observed in the
irst cross, reaching proportions of 74% at V4, and 156% at V6. The signiicant estimates of D and E in the variance
models allow estimating the narrow sense heritability at individual plant level, obtaining values of 0.27 for V4 and 0.44 for V6. These two values of heritability are considered of average and high magnitudes, respectively. The whole
results allow afirming that there is genetic variability for the
trait tolerance to CPMMV to be explored by the breeding programs. Selection applied at V6 stage, with the
method-ology described in this paper, should produce signiicant
genetic gains, even with assessment of individual plants. The selection based on the assessment of more advanced families with greater homozygosis also should increase its
eficiency in this cross. Although heritability was relatively
high at V6 stage (44%), this value may still increase with the use of replication to reduce environmental effects.
Estimating the number of genes
Environmental effects were relatively more important in the assessments performed at stage V4 of soybean development, which normally makes the genetic studies
more complex. This complexity can be exempliied by the
after the recovering of tolerant cultivars detected by com-paring V4 and V6 assessments (see the parental reaction in Figures 1 and 2), the genetic divergence between toler-ant and susceptible cultivars increased making it easier to segregate phenotypic classes at V6. For this reason, only the frequency distributions at V6 soybean growth stage were used to estimate the number of genes.
F3 families are assessed based on the mean of five replications for the grades for susceptibility to CPMMV, varying from 1 to 4. For this reason, there are F3 families along practically all classes of grades in the two crosses (Figures 1 and 2, stage V6). The average grade of 2.5 was taken into account in order to separate tolerant (<2.5) and susceptible (>2.5) classes. This criterion to separate classes seems more appropriate for the group of segregating lines with the same level of tolerance presented by tolerant pa-rental cultivars, since all replications of these two cultivars had scores equal to or less than 2 (Figure 1). The same is not true for the group of genotypes with susceptibility reac-tion similar to CD 206, once 10% of plants (two in a total of 20 at V6, Figure 2) received grade 2 and they would be
classiied as tolerant.
Applying the grade 2.5 as a cut point to separate tolerant and susceptible F3 families on the frequency distribution of the cross BRS 133 x BRSMT Pintado (TT cross type) at V6 stage, a susceptible group with nine F3 families is formed in the right side of the Figure 1. This proportion of nine families in a total of 150 is close to the proportion of 1/16 derived from a segregation of two independent genes with predominance of additive effects and epistasy (addi-tive x addi(addi-tive) directional to tolerance as indicated in the mean genetic models. The comparison between these ex-pected and observed values for the tolerant and susceptible classes using chi-square test produces a chi-square value
of 0.016, which is not rejected at signiicance level of 5%
(P=0.90 with one degree of freedom). Probably these two major genes came, each one, from one of the two tolerant parental cultivars involved in the cross. Considering the relative reaction of these tolerant cultivars to disease, the major gene (gene A) related to BRS 133(genotype AAbb) should contribute with higher additive effect in compari-son to the other coming from BRSMT Pintado (aaBB). According to this genetic control, the F2:3 families derived from F2 plants without the major gene from BRS 133 and heterozygote for the locus from BRSMT Pintado, i.e., with genotype “aaBb”, should segregate within the family and probably belong to the intermediate classes 2.2 and 2.4 in the frequency distribution (Figure 1). Despite the attempt to explain the genetic control of this trait with a relatively simple inheritance with two genes, it is important to note
that the heritability is not so high, meaning that other minor
genes, as well as environmental effects, inevitably inluence the inal tolerance level to CPMMV.
The frequency distribution for F2:3 families means in the CD 206 x BRSMT Pintado cross (ST cross type) followed a non-continuous distribution pattern for V4 and V6 data, indicating the presence of major genes that segregated for the character tolerance to CPMMV. Despite the tolerant and susceptible classes being not totally apart along the distribution of frequencies at the both soybean stages (Figure 2), a better view of class with more tolerant F2:3 families was formed at V6 stage. This is expected due to the less participation of environmental effects and the increased additive genetic variance D at V6 stage (Table 3). In the present study, it was applied the same procedure used for the cross TT, forming a tolerant class with F2:3 families with grade ranging between 1.0 and 2.5, and a susceptible class with grades between 2.5 and 4.0. These intervals determine a tolerant group with 39 F2:3 families and a susceptible group with 111 F2:3 families. The proportion of 39 in a total of 150 families is very close to the proportion of one tolerant plant in each four assessed plants. The segregation pattern of 1T:3S (one tolerant to three susceptible) result-ing from the segregation of a recessive gene determinresult-ing the tolerance produces a chi-square value of 0.08, which is
degree of freedom).This inheritance is consistent with the genetic mean model described in Table 3 for the ST cross, which includes genetic effect of dominance directional to susceptibility. Non allelic effects are absent in this cross, and there is no evidence of additional genes determining the tolerance to CPMMV. The F2:3 families derived from F2 plants with “aaBb” genotype discussed in the TT cross should present average grade in the intermediate classes 2.2 and 2.4, but in the ST cross, the expected proportion of this type of segregate family is concentrated between the grades 2.6 and 3.4 (69 families).
CONCLUSIONS
The joint quantitative and qualitative genetic studies
regarding the soybean tolerance to CPMMV allow the following conclusions: 1) Additive genetic effects pre-dominantly control the tolerance; 2) Non-additive effects, like partial dominance toward susceptibility and additive x additive type epistasis, are also involved in the tolerance
expression; 3) The heritability level allows for eficient
selection based on early generation means; 4) There are at least two distinct major genes, one in the soybean cultivar BRS 133, and another in the cultivar BRSMT Pintado, which determine tolerance to CPMMV.
ACKNOWLEDGMENTS
This study was partially supported by CNPq (National
Council for Scientiic and Technological Development).
Herança da tolerância da soja ao
Cowpea Mild Mottle Virus
Resumo – A necrose da haste em soja é causada pelo vírus Cowpea mild mottle virus (CPMMV) e é considerada uma doença emer-gente e economicamente importante no Brasil. Apenas cultivares tolerantes foram identiicadas até o momento, e o controle genético da tolerância permanece desconhecido. Para estudar a herança da tolerância ao CPMMV foram realizados dois cruzamentos para obter as gerações F2 e F2:3, um entre duas cultivares tolerantes (BRS 133 x BRSMT Pintado) e outro entre uma cultivar suscetível (CD 206) e outra tolerante (BRSMT Pintado). Análises qualitativas e quantitativas aplicadas sobre os dados obtidos nas avaliações em casa-de-vegetação mostraram que existem pelo menos dois genes maiores distintos, um na cultivar de soja BRS 133 e outro na cultivar BRSMT Pintado, determinando a tolerância ao CPMMV. Houve predominância de efeitos genéticos aditivos e herdabilidade, que permite a seleção eiciente baseada em médias, mesmo nas primeiras gerações após o cruzamento.
Palavras-chave: Melhoramento, Glycine max, CPMMV, tolerância a vírus, gene de tolerância.
REFERENCES
Almeida AMR, Guerzoni RA, Nunes JJ, Meyer MC, Hoffmann LL, Oliveira TG and Piuga FF (2003) Expansão do vírus da necrose da
haste da soja e identiicação de cultivares resistentes. Fitopatologia Brasileira 28: 287-288.
Almeida AMR, Piuga FF, Marim SRR, Kitajima EW, Gaspar JO, Oliveira TG and Moraes TG (2005) Detection and Partial characterization of a carlavirus causing stem necrosis of soybean in Brazil. Fitopatologia Brasileira 30: 191-194.
Badge J, Brunt A, Dagless E, Karamagioli M, Phillips S, Seal S, Turner R
and Foster GDA (1996) Carlavirus - speciic PCR primer and partial
nucleotide sequence provides further evidence for the recognition
of cowpea mild mottle virus as a whitely - transmitted carlavirus.
European Journal of Plant Pathology 102: 305-310.
Costa AS, Gaspar JO and Vega J (1980) Mosaico angular do feijoeiro Jalo causado por um “Carlavírus” transmitido pela mosca branca Bemisia
tabaci. Fitopatologia Brasileira 8: 325-337.
Gaspar JO, Beriam LOS, Alves MN, Oliveira AR and Costa AS (1985) Serological identity of bean angular mosaic and cowpea mild mottle viruses. Fitopatologia Brasileira 10: 195-199.
Hull R (2002) Mathew´s plant virology. Academic Press, San Diego,
1001p.
Iwaki M, Thongmeearkom P, Prommin M, Honda Y and Hibi T (1982)
Whitely transmission and some properties of cowpea mild mottle
virus on soybean in Thailand. Plant Disease 66: 365-368.
Koenig R (1981) Indirect ELISA methods for the broad speciicity
detection of plant viruses. Journal of General Virology 55: 33-62.
Laguna IG, Arneodo JD, Rodriguez-Pardina P and Fiorona M (2006) Cowpea mild mottle virus infecting soybean crops in North-Western Argentina. Fitopatologia Brasileira 31: 317.
Mather K and Jinks JL (1982) Biometrical genetics: the study of continuous variation. 2nd edn, Cornell University Press, Ithaca, 403p.
Muniyappa V and Reddy DVR (1983) Transmission of cowpea mild mottle virus by Bemisia tabaci. Plant Disease 67: 391-393.
Perring TM, Gruenhagen NM and Farrar CA (1999) Management of plant viral diseases through chemical control of insect vectors. Annual Review of Entomology 44: 457-481.