D. Vatvani , N. C. Zweers , M. van Ormondt , A. J. Smale , H. de Vries , and V. K. Makin
1Deltares, Delft, The Netherlands
2KNMI, Weather Research, De Bilt, The Netherlands
Correspondence to:D. Vatvani ([email protected])
Received: 10 October 2011 – Revised: 30 May 2012 – Accepted: 1 June 2012 – Published: 27 July 2012
Abstract. To simulate winds and water levels, numerical weather prediction (NWP) and storm surge models gener-ally use the traditional bulk relation for wind stress, which is characterized by a wind drag coefficient. A still commonly used drag coefficient in those models, some of them were developed in the past, is based on a relation, according to which the magnitude of the coefficient is either constant or increases monotonically with increasing surface wind speed (Bender, 2007; Kim et al., 2008; Kohno and Higaki, 2006). The NWP and surge models are often tuned independently from each other in order to obtain good results. Observations have indicated that the magnitude of the drag coefficient lev-els off at a wind speed of about 30 m s−1, and then decreases
with further increase of the wind speed. Above a wind speed of approximately 30 m s−1, the stress above the air-sea
inter-face starts to saturate. To represent the reducing and levelling off of the drag coefficient, the original Charnock drag formu-lation has been extended with a correction term.
In line with the above, the Delft3D storm surge model is tested using both Charnock’s and improved Makin’s wind drag parameterization to evaluate the improvements on the storm surge model results, with and without inclusion of the wave effects. The effect of waves on storm surge is included by simultaneously simulating waves with the SWAN model on identical model grids in a coupled mode. However, the re-sults presented here will focus on the storm surge rere-sults that include the wave effects.
The runs were carried out in the Gulf of Mexico for Kat-rina and Ivan hurricane events. The storm surge model was initially forced with H∗wind data (Powell et al., 2010) to test
the effect of the Makin’s wind drag parameterization on the storm surge model separately. The computed wind, water lev-els and waves are subsequently compared with observation
data. Based on the good results obtained, we conclude that, for a good reproduction of the storm surges under hurricane conditions, Makin’s new drag parameterization is favourable above the traditional Charnock relation. Furthermore, we are encouraged by these results to continue the studies and es-tablish the effect of improved Makin’s wind drag parameter-ization in the wave model.
The results from this study will be used to evaluate the relevance of extending the present towards implementation of a similar wind drag parameterization in the SWAN wave model, in line with our aim to apply a consistent wind drag formulation throughout the entire storm surge modelling ap-proach.
1 Introduction
Storm surge is largely determined by a combination of in-verse barometric effects and air-sea interactions. Under hur-ricane conditions, the transfer of momentum from the atmo-sphere into the ocean represents the dominant process. This transfer of momentum results in the generation of the surge and waves which then interact. The generated wave field introduces radiation stress gradients which affect the water level (and currents).
For the computation of the surface momentum flux, tra-ditionally NWP and storm surge models use a common bulk relation, which involves a formulation for the drag coefficient CD. The magnitude of this coefficient increases to a good
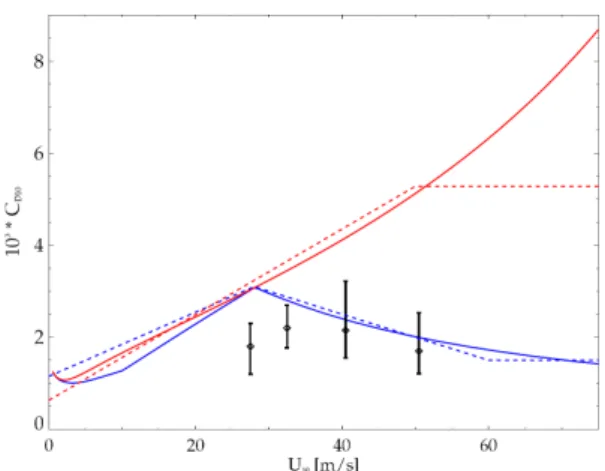
Fig. 1.Drag coefficient CD10 at 10 m height as a function of the
10-m wind speed U10 according to Charnock’s relation using the
Charnock’s constant value equal to 0.025 (solid, red) and the new parameterization following Makin (2005) (solid, blue) from Zweers et al. (2010). Dashed lines represent the approximations used in Delft3D. Observational data by Powell et al. (2003) are indicated by diamonds.
proven to work well for simulations of storm surge under extra-tropical weather conditions (de Vries et al., 1995; Ger-ritsen et al., 1995), albeit after applying some fine tuning.
The validity of Charnock’s relation, or other similar wind drag relation, has limitation when applied to hurricane con-ditions. Observations and laboratory experiments (Powell et al., 2003; Donelan, 2004; Jarosz et al., 2007) indicate that for hurricane wind speeds, the momentum flux starts to sat-urate. At a wind speed of∼30 m s−1, the magnitude of the drag coefficient reaches its peak value and it decreases when the wind speed further increases. Makin (2005), Bye and Jenkins (2006) and Kudryavtsev (2006), among others, have come up with an explanation for this drag reduction. By de-scribing the impact of spray droplets on the atmospheric flow in the wave boundary layer, Makin (2005) was able to ex-plain the observed reduction in the surface drag and proposed a drag parameterization that reflects this reduction. To test the implementation of the improved drag parameterization in the NWP HIRLAM model and the Delft3D storm surge model in a consistent manner, a number of numerical ex-periments are carried out. Due to frequent occurrences of hurricanes and availability of wind and observational data, these experiments were performed in the Gulf of Mexico. The HIRLAM winds for hurricanes Ivan (2004) and Kat-rina (2005) were simulated on a grid with a horizontal res-olution of 0.05 degrees in order to resolve the strong gradi-ents in the sea level pressure and large (local) gradigradi-ents in the hurricane wind field. The HIRLAM model and the im-pact of the wind drag parameterization on the simulated hur-ricane intensity and wind field have been described in detail by Zweers et al. (2010) and it will not be repeated here. They showed that hurricanes cannot attain their intensity in
fore-coupled storm surge-wave models using both Charnock’s and Makin’s drag formulation. The H∗wind data used will be
de-scribed and discussed in detail later in this article. By com-bining the different wind forcing and drag parameterisations we have simulated four scenarios:
– H∗wind data using Charnock’s wind drag
parameteriza-tion in the storm surge model;
– H∗wind data using Makin’s wind drag parameterization
in the storm surge model;
– HIRLAM wind data (simulated using Charnock’s pa-rameterization, will be denoted as HIRLAM1) and Charnock’s wind drag parameterization in the storm surge model; and
– HIRLAM wind data (simulated using Makin’s parame-terization, will be denoted as HIRLAM2) and Makin’s wind drag parameterization in the storm surge model.
2 The storm surge and wave models
2.1 The model grids and boundary condition
The coupled storm surge and wave simulations are performed on two different model grids and schematisations, defined on a spheroid, in an off-line nested configuration (see Fig. 3):
– the Gulf of Mexico (GoM) model with a resolution of approximately 0.1 degrees and
– the Panhandle model with a resolution of approximately 0.02 degrees.
Fig. 2.HIRLAM computed maximum 10-m wind speeds, during Ivan (left) and Katrina (right); with Charnock’s relation (red), with the new drag parameterization (blue) from Zweers et al. (2010). Observations are taken from the National Hurricane Centre (NHC) reports (black). Timet=0 hour represents 00:00 UTC 11 September 2004 for Ivan and 00:00 UTC 25 August 2005 for Katrina.
Fig. 3.The Gulf of Mexico and Panhandle model grids (top) and bathymetry of the Panhandle model (bottom); open boundaries of the models are shown as white lines.
forces inside this model are switched on. The tidal repre-sentations of these models have been validated with satisfac-tory results. As no wave forcing has been applied to the open boundary of the GoM model, all waves are generated inside the coarse grid model by the hurricane winds. The wave in-formation is then prescribed along the open boundaries of the Panhandle model. The SWAN wave model1 (Booij, 1999) uses identical grids as the storm surge model.
1http://www.swan.tudelft.nl/
2.2 Model schematisation and bathymetry
The topography and the bathymetry of the Panhandle model (see Fig. 3) were constructed in 2008 using data down-loaded from the National Geophysical Data Centre (NGDC) and United States Geological Survey (USGS) web sites. The quality and the resolution of the topography and bathymetry data have, since then, been improved. However, given the rel-ative coarseness of the Panhandle model and given the aim of the present study is to gain insight in the overall behaviour of the wind drag parameterizations on the induced surges, it was deemed not essential to update the models with new data as of yet.
2.3 Important model input parameters
The Delft3D storm surge models are run with an integration time of respectively 10 min for the GoM and 2 min for the higher resolution Panhandle model. The bottom friction is computed using the Manning’s formulation with the value of the coefficient equal to 0.024 on sea and 0.035 on land. Drying and flooding is included in the intermediate Panhan-dle model and the drying/flooding criterion has been set to 10 cm. The wave model is run without any effort to calibrate it, as we are primarily interested in the contribution of the waves towards the surge. Default parameters were used and the model is run in the non- stationary mode with a time step of 5 min. The wave frequencies for simulations of the Ivan event have been set to a range lying between 0.03 to 1 Hz divided into 37 bins and for Katrina from 0.03 to 0.5 Hz divided into 35 bins. The wave directions are divided into 36 bins separated by a 10◦value for each bin. The SWAN
Fig. 4.Overview of monitoring stations where time series of the computed water levels and wave parameters are compared to ob-served data.
of Hasselmann (1974) or Van der Westhuysen et al. (2007). Depth-induced breaking is computed through a model by Battjes and Janssen (1978) with the breaking indexγ= 0.73. The bottom friction is based on the JONSWAP formulation (Hasselmann et al., 1973) with the friction coefficient set equal to 0.067 m2s−3.
The effect of wave induced forces in the storm surge model is taken into the account by coupling SWAN wave to the Delft3D storm surge model. The wave forces will, among others, enhance the energy dissipation near the bottom in the storm surge model and generate a net mass flux affecting the current, especially in the cross-shore direction. These effects are accounted for by passing on radiation stress gradient de-termined from the computed wave parameters every 10 min to the storm surge model during the next 10 min. The water levels and currents computed by the storm surge model are then passed on to the wave model after this interval, which is then used by the wave model to compute the wave parame-ters. The choice of this interval of 10 min has been made after experimenting with different coupling times and was found to be optimal in view of the required computation time. 2.4 Monitoring stations
For comparison with observations, water level time series are stored and compared at a number of stations. In this pa-per, the results at four representative coastal stations are pre-sented. Similarly, the time series for the wave parameters have been compared at a number of on-shore and offshore stations. Here, the results are presented for four representa-tive coastal and offshore stations. An overview of the station locations is given in Fig. 4.
2.5 Wind data
As mentioned earlier, the implementation of Makin’s im-proved wind drag parameterization in Delft3D is initially tested by applying the 3 hourly gridded H∗wind data to the
coupled storm surge and wave models after transforming
Fig. 5.Extended H∗wind data at buoy location W42003 compared
to the original H∗wind data and 10 min averaged observed data at
10 m above surface level. Left: results for hurricane Ivan and Right: results for hurricane Katrina. For the location of W42003, see Fig. 4. Discontinued gray line implies the gauge stopped recording the data. Discontinued crosses implies that the station lies outside the coverage of the original H∗wind gridded data.
the data into a moving circular grid (Vatvani et al., 2002). H∗wind data, which is constructed through analysis of
ob-servation data from multitude sources and defined as winds prevailing at 10 m above surface level (U10), has often been
applied to simulate storm surges (Dietrich et al., 2011). The originally 1 min averaged H∗wind data has been adjusted to
10 min averaged wind speed, a time scale more appropriate for determining the ocean response and commonly applied for storm surge models, using the recommended conversion factor mentioned in the WMO report (Harper, 2010). How-ever, the data is provided on a moving grid, centred on the hurricane eye, covering a rectangle area with a size of ap-proximately 1000 by 1000 km. If the coverage of the data is not extended, the wind speed in almost all stations would have been equal to zero when the station concerned is outside the domain of the original H∗wind data. This effectively
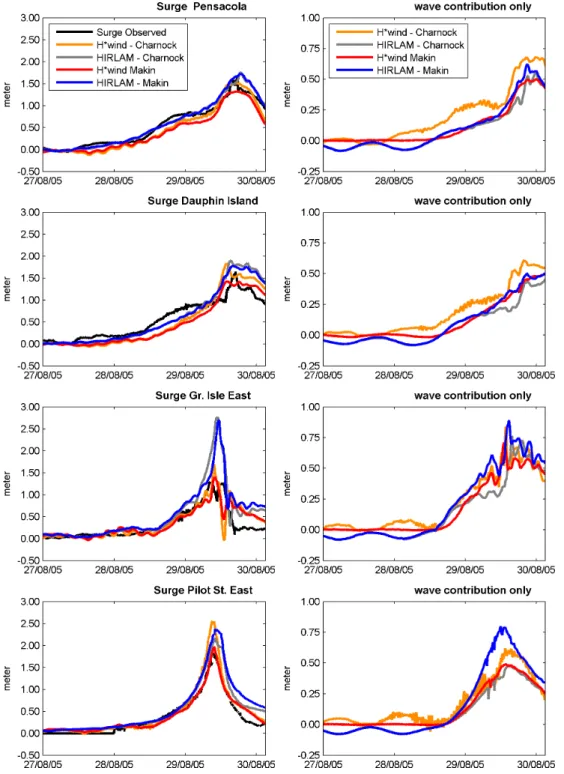
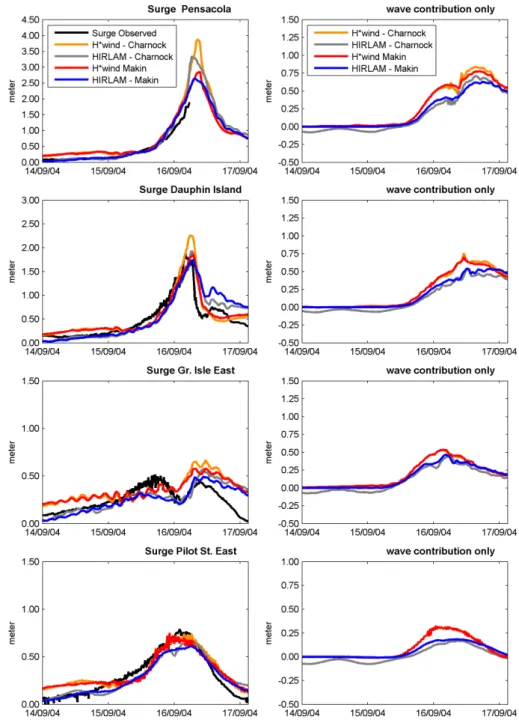
Fig. 6a.Computed and observed surge level at a number of stations for hurricane Ivan (left) and Katrina (right). In each pane the contribution of the wave on the surge is depicted separately. For the location of stations see Fig. 4. Discontinued black line implies the gauge stopped recording the data.
To prevent the generation of these unrealistic waves, the data gap outside the area covered by the original H∗wind
data has been merged with synthetically computed hurricane winds covering a larger area using Holland’s method (1980). As we are not interested in generating the entire hurricane
wind field and want only to supplement the data gap far away from the hurricane centre, the synthetic hurricane winds have been generated using the following simple but commonly ap-plied values for the Hollands’ parameter A and B:
Fig. 6b.Continued.
A=RmaxB . (2)
Where Vmax equals the reported maximum wind speed, ρ
equals the air density, Pdropequals the reported pressure drop
andRmaxequals the radius of maximum wind speed. In our
computation,Rmaxhas been set to 25 km. The generated
syn-thetic winds have been adjusted to account for the interaction with the steering flow (Chan and Gray, 1982) inducing the asymmetry in the wind field.
The wind speed time series of the extended and the orig-inal wind field at station W42003 are shown, as an exam-ple, in Fig. 5. In the same figure, observed wind speed is
also presented. The 10 min averaged observed wind speed (anemometer height equals 5 m) has been converted to 10 m above surface level by applying a height correction factor us-ing the Power Law Method.2The figure shows good agree-ment between the extended data and observed wind speed for both hurricane events at this station. Similar improvement is found for other stations (W42001, W42002, W42007 and W42040). When these extended wind fields are applied, the spurious wave fields are not generated anymore.
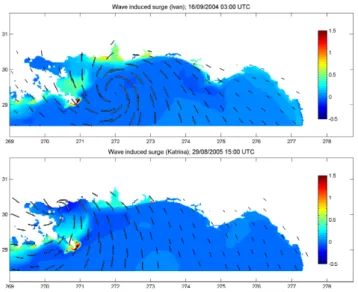
Fig. 7.Computed wave induced surge for Ivan and Katrina at two distinct times.
The HIRLAM winds, which are already defined as 10 min averaged wind and as winds prevailing at 10 m above sur-face level (U10), are then subsequently applied to the models
without changing other model input parameters. The results for the storm surge and wave computations for H∗wind and
HIRLAM wind are discussed below.
3 Results
In the following sections, the computed and observed surge and wave parameters will be presented and discussed for both hurricane events.
3.1 Storm surge
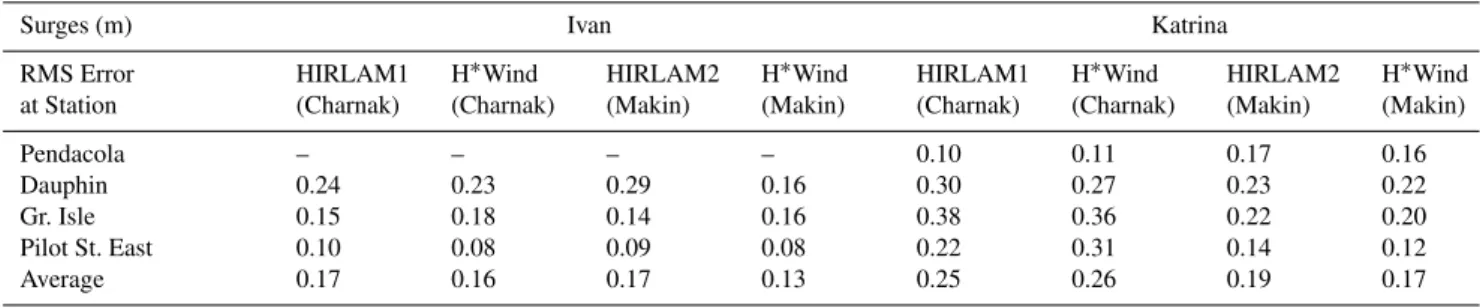
The computed surge levels at different stations for both hurri-canes and for all the scenarios are compared to the observed surge levels in Fig. 6. Also presented is a table containing quantitative analysis of the computed surge in the form of RMS error (Table 1). Besides the time series of the com-puted surge levels, the time series of the contribution of the wave induced surge is also depicted. The wave induced surge is computed by running the same model suite with identi-cal wind scenarios but without taking into account the effect of wave and wave-surge interaction and subtracting these re-sults from the coupled surge-wave model rere-sults.
With respect to the drag parameterization, we observe that Charnock’s parameterization tends to overestimate the surge levels considerably, especially when the computed surge level is large (>1 m), which can be directly associated with periods of strong wind conditions (wind speed>30 m s−1).
This can be expected as the values of the wind drag coeffi-cient based on Charnock’s parameterization is significantly larger in this high wind speed regime (see Fig. 1). The
over-line, on very shallow areas, this contribution may occasion-ally even be higher, reaching a setup value as high as 1.50 m, as shown in Fig. 7. This finding is consistent with results from Resio and Westerink (2008), Wolf (2008) and Dietrich et al. (2011). This shows that wave contribution on surge can be significant and should not be neglected.
Comparing the different wind sources used, we see that HIRLAM2 winds for Katrina event is shown to be capa-ble of reproducing the storm surge during for both events with almost similar quality (RMS error=0.19 cm) as the H∗wind data (RMS error
=0.17 cm). The surge computed at station Grand Isle East is an exceptional case where accord-ing to Zweers et al. (2010) the track computed by HIRLAM is slightly off the actual track. In the Ivan case, HIRLAM2 winds did not perform as well which can already be expected when we compare the computed and observed maximum winds depicted in Fig. 2.
3.2 Wave results
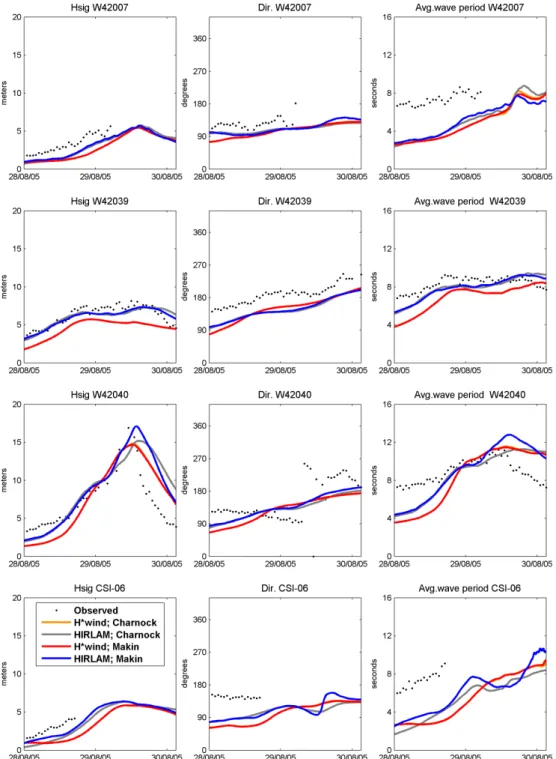
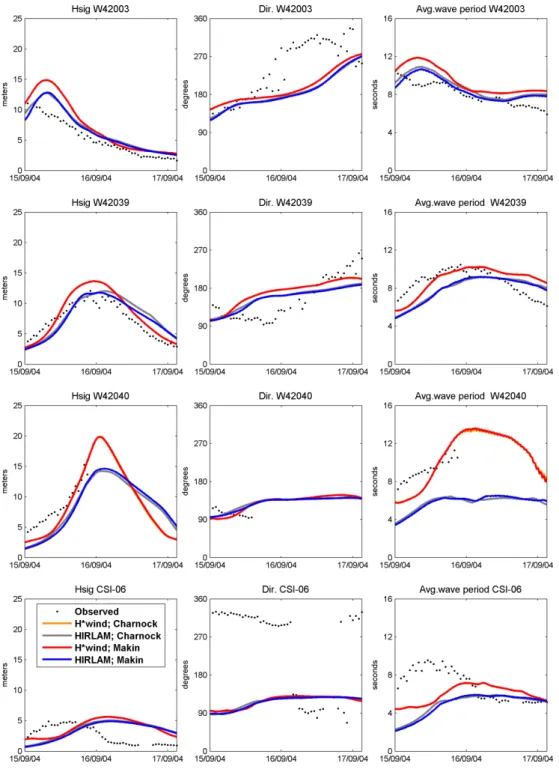
Fig. 8a.Computed wave parameters (significant wave height, wave direction and mean wave period) compared to the observed data at a number of stations for hurricane Ivan (left) and Katrina (right). For the location of stations, see Fig. 4. Discontinued dots imply the gauge stopped recording the data.
This is also confirmed by the computed average RMS errors are almost equal for all the scenarios computed.
For Ivan, the computed significant wave heights at all sta-tions resembles the observed data reasonably well. However, at station CSI06 there is a time lag of approximately 12 h before the significant wave height increases to its peak value. At stations W420003, W420039 and W420040 the computed
Fig. 8b.Continued.
see some discrepancies. At stations W42007 and CSI-06 the computed mean wave period is underestimated by approxi-mately 4 s.
Comparison of the computed spatial pattern of the sig-nificant wave height and wave mean period using H∗wind
data and Makin’s drag formulation (Fig. 9) with modelled results from Dietrich et al. (2011) for Katrina at 29th August 2005 10:00 UTC (depicted in Fig. 8 in the referred article)
Fig. 9.Hurricane Katrina H∗wind data and computed wave parameters along the Panhandle coastal area at 29th of August 2005 10:00 UTC.
CSI 06 2.46 2.49 2.46 2.48 – – –
Average 2.13 2.20 2.09 2.20 1.51 1.33 1.62 1.33
Avg. Wave period (s) Ivan Katrina
RMS Error Average period at Station
HIRLAM1 (Charnock) H*wind (Charnock) HIRLAM2 (Makin) H*wind (Makin) HIRLAM (Charnock) H*wind (Charnock) HIRLAM (Makin) H*wind (Makin)
W42001 2.07 2.60 1.64 2.60 1.65 1.35 1.92 1.34
W42002 5.16 2.71 5.40 2.71 2.69 2.89 2.69 2.89
W42003 1.04 1.57 0.91 1.57 – – – –
W42007 3.33 2.51 3.41 2.50 3.63 3.89 3.45 3.89
W42039 1.60 1.34 1.58 1.33 0.95 1.71 0.90 1.72
W42040 – – – – 1.99 2.44 2.14 2.43
CSI 05 3.33 3.14 3.40 3.14 3.04 3.26 2.86 3.27
CSI 06 3.15 2.41 3.30 2.42 – – – –
Average 2.81 2.33 2.81 2.32 1.99 2.18 1.97 2.19
Therefore, we believe that despite the local discrepancies encountered above, the modelled wave results are sufficient to represent the overall effect of wave on storm surge with reasonable accuracy.
4 Conclusions
This paper has presented the coupled storm surge and wave model results for a combination of four different wind and drag parameterization scenarios. When Charnock’s wind drag parameterization is applied in the storm surge model, it consistently overestimates the storm surges for high wind speed values. This result is expected for the H∗wind data,
but the overestimation of the surge also occurs when the HIRLAM1 winds is applied, despite lower wind speed com-puted.
Based on quantitative and qualitative analysis of the re-sults, we can conclude that by applying Makin’s improved drag formulation to the storm surge model, the computed surge levels compare the observed surge levels very well, especially those simulated with H∗wind data. However, it
should be stressed that the coverage of H∗wind data should
be extended in case they are applied over a larger model area to avoid discontinuity in the wind field, which is physically unrealistic and would cause the SWAN model to generate unrealistic wave fields.
The influence of wave on storm surge levels results are sig-nificant and should not be neglected in storm surge forecast or hindcast. Results indicate that the choice of wind source (and wind drag coefficient used in the storm surge model) is less important, as the set-up generated by wave is somewhat less sensitive to the wind sources applied.
Finally, these results provide some confidence in our ef-fort to apply a consistent drag parameterization throughout the entire modelling suite for storm surge simulations. In our view, adjusting the wind drag parameterization in the SWAN model and direct coupling the NWP models with storm surge and wave models would be a logical follow-up of this study.
Acknowledgements. The authors would like to thank Mr. Baozhu Liu from the Lousiana State University and WAVCIS for providing the WAVCIS buoy data.
Edited by: I. Didenkulova
Bye, J. A. T. and Jenkins, A. D.: Drag coefficient reduction at very high wind speeds, J. Geophys. Research, 111, C03024, 9 pp., doi:10.1029/2005JC003114, 2006.
Charnock, H.: Wind stress on a water surface, Quart. J. Roy. Mete-orol. Soc., 81, 639–640, 1955.
Chan, J. and Gray, W.: Tropical cyclone movement and surrounding flow relationships, Mon. Wea. Rev., 110, 1354–1374, 1982. de Vries, H., Breton, M., de Mulder, T., Krestenitis, Y., Ozer, J.,
Proctor, R., Ruddick, K., Salomon, J. C., and Voorrips, A.: A comparison of 2D storm surge models applied to three shallow European seas, Environ. Softw., 10, 1, 23–42, 1995.
Dietrich, J. C., Zijlema, M., Westerink, J. J., Holthuijsen, L. H., Dawson, C., Luettich, Jr. R. A., Jensen, R. E., Smith, J. M., Stelling, G. S., and Stone, G. W.: Modeling hurricane waves and storm surge using integrally-couple scalable computations, Coast. Eng., 58, 45–65, 2011.
Egbert, G. D. and Erofeeva, S. Y.: Efficient inverse modeling of barotropic ocean tides, J. Atmos. Ocean. Technol., 19, 183–204, 2002.
Gerritsen, H., de Vries, H., and Phillipart, N.: The Dutch Conti-nental Shelf Model’, Quantitative Skill Assessment for Coastal Ocean Models, Coast. Estuar. Studies, 47, 425–467, 1995. Hasselmann, K., Barnett, T. P., Bouws, E., Carlson, H., Cartwright,
D. E., and Enke, K.: Measurements of wind–wave growth and swell decay during the Joint North Sea Wave Project (JONSWAP), Deutschen Hydrographischen Zeitschrift Reihe 12, (A8), 1973.
Hasselmann, K.: On the spectral dissipation of ocean waves due to whitecapping, Bound.-Layer Meteorol., 6, 107–127, 1974. Harper, B. A., Kepert, J. D., and Ginger, J. D.: Guidelines for
con-verting between various wind averaging periods in Tropical Cy-clone conditions, WMO publication, TD-No. 1555, 2010. Holland, G. J.: An Analytical Model of the Wind and Pressure
Pro-files in Hurricanes, Mon. Wea. Rev., 108, 1212–1218, 1980. Jarosz, E., Mitchell, D. A., Wang, D. W., and Teague, W. J.:
Bottom-Up Determination of air-sea Momentum Exchange Under a Ma-jor Tropical Cyclone, Science, 315, 1707–1709, 2007.
336, 1981.
Makin, V. K.: A note on the drag of the sea surface at hurricane winds, Bound.-Layer Meteorol., 115, 169–176, 2005.
Powell, M. D., Houston, S., Amat, L., and Morrisseau-Leroy, N.: The HRD real-time hurricane wind analysis system, J. Wind Eng. Indust. Aerodynam., 77–78, 53–64, 1998.
Powell, M. D., Vickery, P. J., and Reinhold, T. A.: Reduced drag co-efficient for high wind speeds in tropical cyclones, Nature, 422, 279—283, 2003.
Powell, M. D., Murillo, S., Dodge, P., Uhlhorn, E., Gamache, J., Cardone, V., Cox, A., Otero, S., Carrasco, N., Annane, B., and St. Fleur, R.: Reconstruction of Hurricane Katrina’s wind fields for storm surge and wave hindcasting, Ocean Eng., 37, 26–36, 2010.
Resio, D. T. and Westerink, J. J.: Modeling the Physics of Storm Surge, Physics Today, September 2008, 33–38, 2008.
Rogers, W. E., Hwang, P. A., and Wang, D. W.: Investigation of wave growth and decay in the SWAN model: three regional-scale applications, J. Phys. Oceanogr., 33, 366–389, 2003.
Smith, S. D. and Banke, E. G.: Variation of the sea surface drag coefficient with wind speed, Quart. J. Roy. Meteorol. Soc., 101, 665–673, 1975.
van der Westhuysen, A. J., Zijlema, M., and Battjes, J. A.: Nonlinear saturation-based whitecapping dissipation in SWAN for deep and shallow water, Coast. Eng., 54, 151–170, 2007.
Vatvani, D. K., Gerritsen, H., Stelling, G. S., and Krishna Rao, A. V. R.: Cyclone Induced Storm Surge and Flood Forecasting System for India, Solutions to Coastal Disasters ’02, Proceedings of the 2002 Coastal Disasters Conference, 473–487, 2002.
Wolf, J.: Coupled wave and surge modelling and implications for coastal flooding, Adv. Geosci., 17, 19–22, 2008,
http://www.adv-geosci.net/17/19/2008/.