SUSTAINABLE DEVELOPMENT AND INNOVATION IN EASTERN AND CENTRAL
EUROPEAN COUNTRIES
NEAGU OLIMPIA
ASSOCIATE PROFESSOR,
„VASILE GOLDI ” WEST
ERN UNVERSITY OF ARAD
e-mail:[email protected]
ARDELEAN DORU IOAN
ASSOCIATE PROFESSOR,
„VASILE GOLDI ” WEST
ERN UNVERSITY OF ARAD
e-mail:[email protected]
LAZĂR VASILE LUCIAN
ASSOCIATE PROFESSOR,
„VASILE GOLDI ” WEST
ERN UNVERSITY OF ARAD
e-mail:[email protected]
Abstract
The paper has the aim to highlight the impact of innovation on sustainable development in Eastern and Central European countries. In this wiew, a sinthetic measure of sustainability in these countries is calculated, taking into account ten statistical indicators (related to socio-economic development, sustainable consumption and production, social inclusion, demographic changes, public health, primary energy consumption, share of renewable energy in final consumption energy, sustainable transport, official development assistance granted to these countries) from EUROSTAT database. A comparative analysis of the level of sustainability during 2005-2014 in Eastern and Central Europe is followed by an analysis of the impact of innovation (measured by eco-innovation index) on sustainable development, using panel data techniques. The findings show that eco-innovation had a positive impact on sustainability in these countries in the examined period.This result could be used as a rationale for policy makers from these countries in designing measures for eco-innovation stimulation, aiming in this way to move forward for achieving the planned national targets within the European Union Sustainable Development Strategy (EU-SDS).
Key words: sustainable development, innovation, panel data analysis
JEL Classification : Q01, O03, C33
1. Introduction
The concept of sustainable development and eco-innovation became in the last 20 years a central topic of European and world debate tackling eco-challenges for human society and its future.
Although difficult to define, the concept of sustainable development has been generally accepted as a development that meets the needs of the present generations without compromising the ability of future generations to meet their own needs [18, p.24] and encompasses three pillars: economic, environmental and social [14, p.8].
Around the objectives of sustainable development, considered strategical by the European Union, an European Sustainable Development Strategy was conceived and sustainability objectives were included in the framework of the Europe 2020 Strategy. The economic, environmental and social dimensions are all parts of the EU Sustainable Development Strategy (EU SDS) adopted in 2001 and renewed in 2006.
Eco-innovation is an European initiative, part of Entrepreneurship and Innovation Programme, designed to implement the EU's aim to reduce the environmental impact and to improve the use of resources. This means developing products, techniques, services and processes that reduce CO2 emissions, use resources efficiently and promote recycling. There are five main strands to this initiative: materials recycling and recycling processes; sustainable building products; food and drink sector; water efficiency, treatment and distribution; greening business.
Supposing a connection between sustainability and innovation, the paper intends to prove the validity of the link between these two socio-economic and environmental phenomena in the Eastern and Central European countries. In a first step, a sinthetic measure is constructed in order to rate the sustainable development in ten Eastern and Central Europe countries. In the second step, the link between the level of sustainable development level and eco- innovation level in these countries is analysed by using panel data regression.
2.
Sustainable development and eco-innovation: conceptual basis, European developments
and empirical studies
In 1987, the Bruntland Report, ”Our common future” published by World Commission on Environment and
Development (WCED) introduced the definition of sustainable development, recognising the interlocking nature of ecological, social and economic challenges and putting forward eight objectives for sustainable development. The United Nations Conference on Environment and Development from Rio de Janeiro in 1992[15] strengthened this multi-dimensional concept of sustainable development and the outcomes of this conference, Rio Declaration and Agenda 21[16] laid out 27 principles of sustainable development and actions for integrating and attaining social, economic and environmental objectives. Furthermore, the conference proposed the development of new metric systems to reflect the concept of sustainable development.
Faithful to its international commitment to contribute to the progress toward a sustainable development, in 2001, the European Union conceived its Strategy for Sustainable Development [5] based on four separate pillars-economic, social, environmental and global governance and revised it in 2006 [6].
In 2012 at Rio+20 conference [17], twenty years after the first Rio Conference world leaders decided to launch a process for the development of a set of Sustainable Development Goals which will constitute the goals of 2030 agenda for sustainable development. This document defines sustainable development goals and targets and refers to the development of a global indicator framework.
The European Council from June 2013 reiterated the commitment of the EU and its Member States to the post-2015 agenda and also for to the implementation of the Europe 2020 strategy, which builds on the integrative approach initiatied by the EU Strategy for Sustainable Development [4].
In the context of adoption in September 2015 of the 2030 Agenda for sustainable development by the UN Summit, it is noteworthy to mention the European countries' commitment to the goals of sustainable development. Beyond the fact that the EU Member States joined the 2030 Agenda for sustainable development, at EU level, two main strategies are relevant to be put into debate: the EU Strategy for Sustainable Development and the Europe 2020 Strategy.
There is a complementarity between the EU Strategy for Sustainable Development and Lisbon Strategy-the precedesor of Europe 2020. The EU SDS sets the overall framework, by providing a long-term perspective and clear guidance to all policy areas. The Europe 2020 strategy is a practical implementation of the EU's policy agenda for sustainable development and it is contributing to greater coherence, mainstreaming and integration of the three dimensions of sustainable development in EU policies at large [4].
In order to measure the progress towards sustainable development of Member States, EUROSTAT (2001) introduced set of sustainable development indicators (SDIs) and produces a monitoring report every two years.
The EU SDI set is organised in a theme-oriented framework, providing a clear structure relevant for political decision-making, based on current priority policy issues.
The SDI framework covers ten thematic areas: -socioeconomic development,
-sustainable consumption and production, -social inclusion,
-demographic changes, -public health,
-climate change and energy, -sustainable transport, -natural resources, -global partnership, -good governance.
The term of eco-innovation refers to a change in economic activities that improves both the economic performance and the environmental performance of society[11]. Within the European initiative, eco-innovation is any innovation that reduces the use of natural resources (including materials, energy, water, biomass and land) and decreases the release of harmful substances across the whole life-cycle.
In this paper we follow the European Eco-Innovation initiative, which defines eco-innovation as any innovation that reduces the use of natural resources (including materials, energy, water, biomass and land) and decreases the release of harmful substances across the whole life-cycle. It was conceived the Eco-Innovation Scoreboard (Eco-IS), a tool to assess and illustrate eco-innovation performance across the EU Member States. The scoreboard aims at capturing the different aspects of innovation by applying 16 indicators grouped into five thematic areas: eco-innovation inputs, eco-eco-innovation activities, eco-eco-innovation outputs, resource efficiency and socio-economic outcomes. According to it, EUROSTAT introduced the Eco-innovation index, a composit measure of these 16 indicators in order to monitor and compare the performances of Member States.
A study conducted in 3 Eastern European countries (Bulgaria, Romania and Czech Republic) by Lewandowska (2016) founds that financial support for innovation activities has a limited effect on promotion eco-innovation and government actions have to foster a model of a green growth in these countries.
We try to find how impacts the eco-innovation performance of Member States from Eastern and Central Europe on sustainability level, as it is resulted from the statistical indicators established to monitor the progres in achieving the planned targets of European Union Sustainable Development Strategy.
3. Methodology and data
3.1 Levels of sustainable development
In order to rate the levels of sustainable development we use the method of a sinthetic measure of sustainability developed by Grzebyc and Stec (2015).
We consider a set of data of n objects (
x
1,...,x
n), organised as a vector:
n
x
x
x
...
2 1(1).
In our case,
x
1 ,...,x
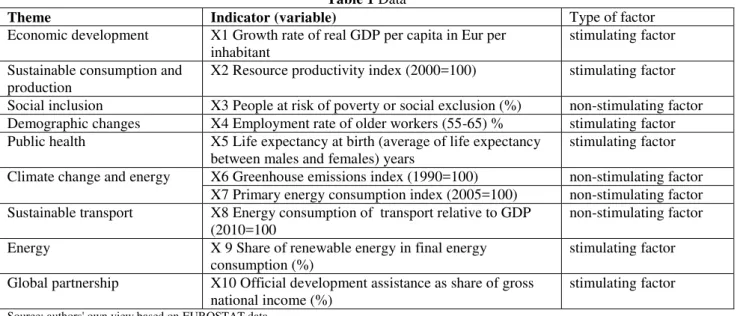
n, represent values of statistical indicators corresponding to the themes of the European sustainable strategy extracted from EUROSTAT database for the period of 2005-2014 (Table1).Table 1 Data
Theme Indicator (variable) Type of factor
Economic development X1 Growth rate of real GDP per capita in Eur per inhabitant
stimulating factor
Sustainable consumption and production
X2 Resource productivity index (2000=100) stimulating factor
Social inclusion X3 People at risk of poverty or social exclusion (%) non-stimulating factor Demographic changes X4 Employment rate of older workers (55-65) % stimulating factor Public health X5 Life expectancy at birth (average of life expectancy
between males and females) years
stimulating factor
Climate change and energy X6 Greenhouse emissions index (1990=100) non-stimulating factor X7 Primary energy consumption index (2005=100) non-stimulating factor Sustainable transport X8 Energy consumption of transport relative to GDP
(2010=100
non-stimulating factor
Energy X 9 Share of renewable energy in final energy consumption (%)
stimulating factor
Global partnership X10 Official development assistance as share of gross national income (%)
stimulating factor
Source: authors' own view based on EUROSTAT data
Due to the fact that the variables are differently scaled and some are stimulating and others are hindering (non-stimulating) the sustainable development, we will normalize the values using the following formulas:
i i i
x x z
max
(2) for stimulating factors
i i i
x x
z min (3) for non-stimulating factors.
In this way, the vector (1) becomes:
n
z
z
z
...
2 1(4).
According to Grzebyc and Stec (2015), the sustainable index (SI) is calculated with the formulae: )
1 ( Sd Me
SI (5)
The closer to unit value SI of a given country is, the higher is the level of sustainable development of that country.
The median value of
z
1,...,z
nis calculated with: i m i m z z Me 1 2 2 2
1 (6)
for even number of variables or with:
i m z Me 2 2
1 (7)
for odd number of variables.
The following formula is applied for standard deviation of
z
1,...,z
n:
n i i z z n Sd 1 2
1 (8)
3.2. Panel data estimation
In order to test if innovation has a significant impact on sustainability level in the 10 surveyed countries we will use panel techniques. Our study is based on estimation of a panel data using the STATA 13.1 software.
A panel data regression is depicted by the following equation [1]:
it it
it
c
X
u
Y
(9)where i denotes countries , t denoting time. The i subscript denotes the cross-section dimension whereas t denotes the time-series dimension, c is a scalar, is Kx1, Xitis the i-th observation on K explanatory variables and
it
u
is the error.There are two main approaches in the analysis of panel data: the fixed effects model and the random effects model.
In a fixed effects model, the regression equation can be written as follows:
it it i
i
it c D X
Y ( 0
)
(10)
where:
Y
it is the dependent variable,c
0is a constant,
iis a country-specific value,D
iis dummy variable for each country,
is the parameter of independent variable,X
itis the independent variable and
itis the error. In a fixed effect model, the variation accross countries or entities can be correlated with the independent variables and the effects of time-invariant characteristics are not taken into consideration.In a random effects model the variation across countries is assumed to be random and uncorrelated with the predictor or independent variables [2]-[8]. In such model, the regression equation is the following:
it it it c X
Y 0
(11)where
it
it
itthen Yitc0
Xit
it
it and Yitc0it Xititwhere
Y
it is the dependent variable,c
0is a constant,
is the parameter of independent variable,X
itis the independent variable and
itis the error term,
itis the common white noise error,
itis the specific error term.In order to select between fixed and random effects models, we use the Hausman test. It is designed to detect violation of the random effects assumption that the explanatory variables are ortogonal to the unit effects. In the case of no correlation between the independent variables and the unit effects, the estimates of
in fixed effects model(
ˆ
FE) should be similar to the estimation of
in random effects model (
ˆ
RE ). The formula of Hausman statistic (H) is the following:
RE FE
Var FE Var
RE
RE FE
H ˆ ˆ ˆ ˆ 1ˆ ˆ (12)
In our particular case, we estimate the following regression equation:
it it it
c
INI
u
SI
(13)where:
SI
itis the sustainability index in the country i in the year t, INIitis the eco-innovation index in the country i in the year i andu
itis the error.The values of INI for the period of 2008-2014 were extracted from EUROSTAT data base, from eco-innovation index tables. The index is based on 16 indicators from eight contributors in five areas: innovation inputs, eco-innovation activities, eco-eco-innovation outputs, environmental outcomes and socio-economic outcomes.
4. Main findings
4.1. Comparative analysis of sustainability in Eastern and Central European countries
In the Annex 1 the yearly sustainability index (SI) is calculated according to the above exposed methodology for 10 countries from Eastern and Central Europe (Bulgaria, Czech Republic, Latvia, Lithuania, Hungary, Poland Romania, Slovenia and Slovakia), for 2005-2014.
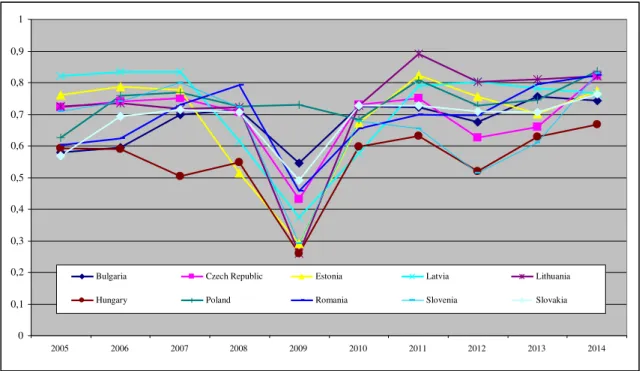
Figure 1 Sustainability index in Eastern and Central Europe, 2005-2014
Source: authors' own computation
It is noticeable (Figure1) for the period of 2005-2015 that the sustainability index in the ten countries showed a rising trend excepting Latvia. In 2005 the highest values were registered in Latvia, Estonia and Czech Republic and the lowest in Slovakia and Bulgaria.
The impact of global economic crisis is visible in 2009 when sustainability registered a sharp fall due to the declin of economic growth rate in all examined countries.
After 2009 the trend is positive in all countries with a slight fall in 2012. In 2014, sustainability was the the highest in Poland, followed by Slovenia, Romania and Czech Republic and the lowest in Bulgaria.
We classified the ten examined countries into groups of similar levels of sustainability using mean values and standard deviation of SI, as follows:
High level:
SI
j
SI
sdSI
jMedium-high level:
SI
sdSI
j
SI
j
SI
Medium-low level:
SI
sdSI
j
SI
j
SI
00,1 0,2 0,3 0,4 0,5 0,6 0,7 0,8 0,9 1
Low level:
SI
j
SI
sdSI
jwhere:
SI
jis the sustainability index in the country j ( j=1,10) and sdSI is standard deviation of thedata set
SI
1,...
SI
j,..
SI
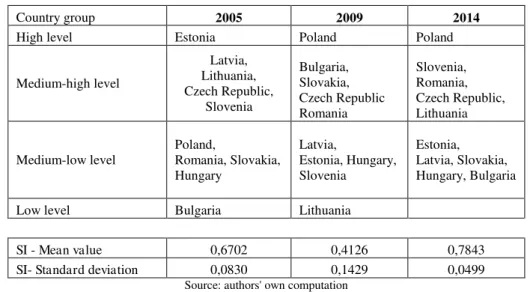
10.In 2005, the group of medium to high level of sustainability included Latvia, Estonia, Lithuania, Czech Republic and Slovenia. In 2009 the level of sustainability declined in Latvia and Estonia, these countries being included in the group of medium to low level of sustainability. Romania and Slovakia registered a positive evolution from medium-low level in 2005 to medium high level in 2009. Hungary remains in the same group (medium-low level) in the whole period of time. Slovakia starts in 2005 in the medium-low level group and ends in the same group, with a shift into the medium-high level group in 2009. Bulgaria registers the lowest levels in the whole examined period of time. Estonia declined from the high level group in 2005 to the medium to low level in 2009 followed by a revival in 2014 in the medium-high level group. Lithuania and Slovenia have had an identic trajectory: in the medium-high group in 2005, in the medium-low level in 2009 and in 2014 return in the initial group. Czech Republic remains in the same group (medium to high level) and Poland starts in the group of medium-low level group and ends in 2009 and 2014 in the high level group (Table 2).
Table 2 Groups of Eastern and Central European countries with similar levels of sustainability in 2005, 2009 and 2014
Country group 2005 2009 2014
High level Estonia Poland Poland
Medium-high level
Latvia, Lithuania, Czech Republic,
Slovenia
Bulgaria, Slovakia, Czech Republic Romania
Slovenia, Romania, Czech Republic, Lithuania
Medium-low level
Poland,
Romania, Slovakia, Hungary
Latvia,
Estonia, Hungary, Slovenia
Estonia, Latvia, Slovakia, Hungary, Bulgaria
Low level Bulgaria Lithuania
SI - Mean value 0,6702 0,4126 0,7843 SI- Standard deviation 0,0830 0,1429 0,0499
Source: authors' own computation
4.2. Impact of innovation on sustainability in Eastern and Central Europe
The results of the estimation of equation 13, in the two models (fixed-effects and random-effects) are exposed in Table 3.
Table 3 Fixed-effects and Random-effects model
Fixed-effects (within) regression Number of obs = 70 Group variable: Country Number of groups = 10 R-sq: within = 0.1550 Obs per group: min = 7 between = 0.2732 avg = 7.0 overall = 0.0187 max = 7 F(1,59) = 10.83 corr(u_i, Xb) = -0.9776 Prob > F = 0.0017 ---
SI | Coef. Std. Err. t P>|t| [95% Conf. Interval]
---
INI | 3.4104 1.036502 3.29 0.002 1.336364 5.484436 _cons | -.4556607 .3429938 -1.33 0.189 -1.14199 .2306682
--- sigma_u | .3612545
sigma_e | .13125361
Random-effects GLS regression Number of obs = 70 Group variable: Country Number of groups = 10 R-sq: within = 0.1550 Obs per group: min = 7 between = 0.2732 avg = 7.0
overall = 0.0187 max = 7 Wald chi2(1) = 1.14 corr(u_i, X) = 0 (assumed) Prob > chi2 = 0.2865 --- SI | Coef. Std. Err. z P>|z| [95% Conf. Interval]
---
INI | -.202135 .1896368 -1.07 0.286 -.5738163 .1695464 _cons | .7385291 .0651039 11.34 0.000 .6109278 .8661304
--- sigma_u | .01339932
sigma_e | .13125361
rho | .883387 (fraction of variance due to u_i)
--- F test that all u_i=0: F(9, 59) = 2.35 Prob > F = 0.0246
---
Source: authors' computation using STATA 13.1 software
We use the Hausman test in order to select the apropriate model (Table 4).
Table 4 The Hausman test
---- Coefficients ----
| (b) (B) (b-B) sqrt (diag(V_b-V_B)) | fe re Difference S.E. --- INI | 3.4104 -.202135 3.612535 1.019007
--- b = consistent under Ho and Ha; obtained from xtreg B = inconsistent under Ha, efficient under Ho; obtained from xtreg
Test: Ho: difference in coefficients not systematic
chi2(1) = (b-B)'[(V_b-V_B)^(-1)](b-B)= 12.57 Prob>chi2 = 0.0004
--- Source: authors' own computation using STATA 13.1 software
Due to the fact that the value of Probchi2 is 0.0004 lower than 0.05 (the significance level) the Ho hypothesis is rejected and the fixed-effects (FE) model is selected (Table 2).
According to the data displayed in Table 2, the estimated equation 13 is the following:
SI
it
0
.
4566607
3
.
4104
INI
itP 0.189 0.002 Standard Error 0.3429938 1.036502
In this equation the value of P for the constant term (-0.4566607) is 0.189 > 0.05. For the coefficient of the variable INI, the value of P is 0.002 < 0.05. The model can be statistically validated, as a whole, a for a significance threshold of 5%, due to the fact that Prob is 0.0246 < 0.05 (Table2).
In order to prove the robustness of the results we will check the stationarity of data, heteroskedasticity and autocorrelation of errors.
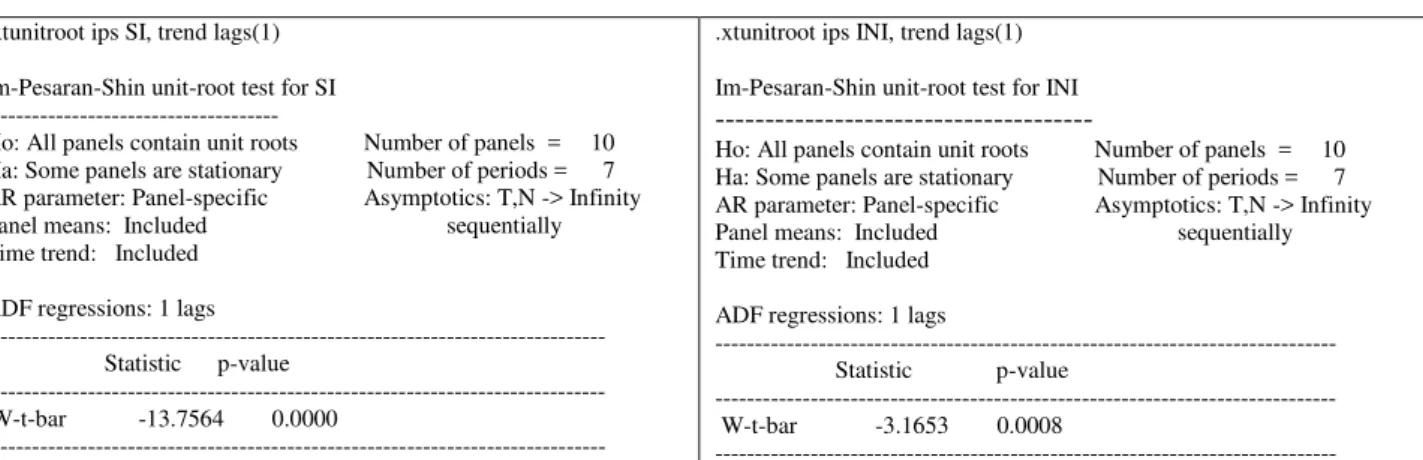
Regarding the stationarity of variables, according to the results displayed in the Table 5, the dependent variable SI is stationary or convergent, due to the fact that p-value (0.0000) < 0.05 as well as the independent variable INI, due to the fact that p-value(0.0008) is lower than 0.05.
Table 5 Stationarity tests
.xtunitroot ips SI, trend lags(1)
Im-Pesaran-Shin unit-root test for SI ---
Ho: All panels contain unit roots Number of panels = 10 Ha: Some panels are stationary Number of periods = 7 AR parameter: Panel-specific Asymptotics: T,N -> Infinity Panel means: Included sequentially Time trend: Included
ADF regressions: 1 lags
--- Statistic p-value
--- W-t-bar -13.7564 0.0000
---.xtunitroot ips INI, trend lags(1)
Im-Pesaran-Shin unit-root test for INI ---
Ho: All panels contain unit roots Number of panels = 10 Ha: Some panels are stationary Number of periods = 7 AR parameter: Panel-specific Asymptotics: T,N -> Infinity Panel means: Included sequentially Time trend: Included
ADF regressions: 1 lags
--- Statistic p-value
--- W-t-bar -3.1653 0.0008
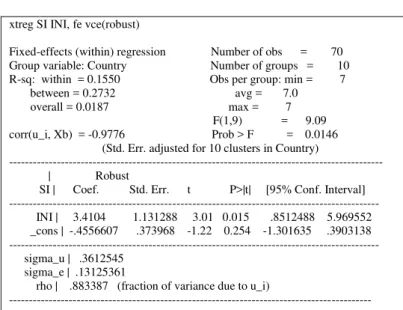
We suspect that there is heteroskedasticity or within-panel serial correlation in the idiosyncratic error term; therefore we used the "vce (robust)" option in STATA (Table 6). Althought the robust estimator produced larger standard errors and the p-value for independent variable and the constant are larger as well (p-value for INI 0.015<0.05, p-value for constant 0.254>0.05, as initial) (Table 2), we notice that the estimated coefficients are the same as initial, the coefficient of INI is significant for a significance threshold of 5% and the F test (0.0146) shows a value under 0.05. Thus, the hypothesis of heteroskedasticity is rejected.
Table 6 Test of heteroskedasticity and autocorrelation of errors
xtreg SI INI, fe vce(robust)
Fixed-effects (within) regression Number of obs = 70 Group variable: Country Number of groups = 10 R-sq: within = 0.1550 Obs per group: min = 7 between = 0.2732 avg = 7.0 overall = 0.0187 max = 7 F(1,9) = 9.09 corr(u_i, Xb) = -0.9776 Prob > F = 0.0146 (Std. Err. adjusted for 10 clusters in Country)
--- | Robust
SI | Coef. Std. Err. t P>|t| [95% Conf. Interval] --- INI | 3.4104 1.131288 3.01 0.015 .8512488 5.969552 _cons | -.4556607 .373968 -1.22 0.254 -1.301635 .3903138 --- sigma_u | .3612545
sigma_e | .13125361
rho | .883387 (fraction of variance due to u_i)
--- Source: authors' own computation using STATA 13.1 software
According to the above analysis, the eco-innovation index has a positive statistically validated influence on sustainability. When the eco-innovation index increases with one unit the increase in sustainability index is of 3.4104 units.
This positive association between eco-innovation and sustainability level in Eastern and Central Europe is consistent with the results of other studies conducted in developing countries [11]. This result is relevant for policy makers in these countries when they design governamental policy measures aiming the improvement of sustainability performance through stimulation of innovation activities. Furthermore, it is a rationale basis for taking realistic measure regarding the progress of achieving the country's target within the European Union Sustainable Development Strategy.
5. Conclusions
The aim of the paper is twofold: first, to rate the levels of sustainability with a sinthetic constructed measure and second, to analyze the influence of innovation on sustainability in Eastern and Central Europe.
According to the calculated sustainability index, the level of sustainable development increased in all countries in the examined period of time, excepting Latvia. The financial crisis has a great impact on sustainable development due to the fall of economic growth in 2009. After the crisis, it is visible a convergence of Eastern and Central European countries regarding their levels of sustainable development. These findings are similar to those obtained by Grzebyc and Stec (2015).
The panel data analysis pointed out a positive influence of eco-innovation (measured by eco-innovation index) on the level of sustainable development. Eco-innovation in Eastern and Central European economies means new technology transfer and difussion, promotion of pollution prevention technologies, modified processes, systems and products with a beneficial impact on environment. Our findings suggest that public policies aiming the to stimulate eco-innovation measures in the Eastern and Central European countries would be beneficial for their progress in achieving the EU SDS goals and catching-up the more developed Western countries.
A possible direction of research in the future can be an extension of the analysis to the whole European Union, with a benchmarking between more developed and developing countries, the identification of the gap between them and suggesting realistic solutions to reduce it.
Acknowledgment
6. References
[1] Baltagi, B.H.- Econometric Analysis of Panel Data, John Wiley&Sons Ltd, 2008;
[2] Baum, C.F.- Residual diagnostic for cross-section time series regression models, The Stata Journal. Vol.1, No.1, pp.101-104, 2001;
[3]Clark, T.S. and Linzer, D.A. -Should I use fixed or random effects?, 2012;
http://polmeth.wustl.edu/files/polmeth/clarklinzerrefemar2012.pdf> Accessed 27 February 2016
[4] Council of European Union -Review of the Sustainable Development Strategy (EU SDS)-Renewed Strategy, 10917/06, 2006;
[5]European Commission, - Communication: A Sustainable Europe for a Better World: A European Union Strategy
for Sustainable Development (Commission proposal to the Gothenburg European Council), COM(2001) final, 2001; [6]European Commission - A decent life for all: Ending poverty and giving the world a sustainable future,
COM(2013) 92 final, 2013;
[7]Eurostat - Measuring progress towards a more sustainable Europe: Proposed indicators for sustainable development, Luxembourg, Office for Official Publications of the European Union, 2001;
[8] Greene, W.H.- Econometric analysis, New York University, Pearson, Prentice Hall, 2008;
[9] Grzebyc, M. and Stec, M. - Sustainable Development in EU countries: Concept and Rating of Levels of Development, Sustainable Development, 23, pp.110-123, 2015;
[10]Hopwood, B., Mellor, M. and O'Brien, G.- Sustainable Development: mapping different approaches, Sustainable Development, 13. pp. 38-52, 2005;
http://nrl.northumbria.ac.uk/9387/1/Mapping_Sustainable_Development.pdf Accessed 4 October 2016
[11]Huppes G., Kleijn R., Huele R., Ekins P., Shaw B., Esders M., Schaltegger S. -Measuring eco-innovation: framework and typology of indicators based on causal chains, Final Report of the ECODRIVE Project, CML, University of Leiden, 2008; http://www.eco-innovation.eu/wiki/images/Ecodrive_final_report.pdf accessed 17 July 2016
[12]Lewandowska, M.S.-Do Government Policies Foster Environmental Performance of Enterprises from CEE Region?, Comparative Economic Research, Vol.19. Number 3, pp.45-67, 2016;
[13]Oosterhuis F. (Ed) (2006) - Innovation dynamics induced by environmental policy, Final report to the European Commission DG Environment, IVM Report E-07/05, November, 2006;
http://ec.europa.eu/ environment/enveco/others/index.htm#innodyn accessed 26 September 2016
[14]United Nations - Report of the World Summit on Sustainable Development, Johanesburg, South Africa, 26 August-4 September 2002, United Nations, New York, 2002;
[15]United Nations Conference on Environment and Development - Rio Declaration on Environment and
Development, 1992;
[16]United Nations Conference on Environment and Development - Agenda 21, 1992;
[17]United Nation General Assembly -The future we want, A/RES/66/288, 2012;
[18]WCED - Our Common Future, World Commission on Environment and Development, Oxford: Oxford University Press, 1987; http://conspect.nl/pdf/ Our_Common_Future-Brundtland_Report_1987.pdf
[19] *** http://ec.europa.eu/eurostat/web/sdi/indicators
Annex 1
Sustainability index in Eastern and Central European Countries, 2005-2014
Country/Year 2005 2006 2007 2008 2009 2010 2011 2012 2013 2014
Bulgaria 0,578344 0,595738 0,699595 0,714987 0,544442 0,723619 0,722801 0,675645 0,756417 0,743899 Czech Republic 0,722160 0,739703 0,751698 0,705631 0,430024 0,729701 0,749730 0,625531 0,660134 0,821102 Estonia 0,759797 0,787605 0,775387 0,514130 0,290878 0,672281 0,822873 0,757062 0,700014 0,773576 Latvia 0,820127 0,832722 0,833966 0,614598 0,373528 0,576584 0,788790 0,803486 0,783027 0,765133 Lithuania 0,723942 0,734889 0,715982 0,721809 0,259762 0,728051 0,890167 0,803538 0,810684 0,822026 Hungary 0,592278 0,589362 0,503503 0,547510 0,260033 0,597685 0,631445 0,519888 0,627814 0,668164 Poland 0,625907 0,759422 0,768139 0,724670 0,730029 0,682195 0,808006 0,727241 0,744601 0,835625 Romania 0,602130 0,622694 0,730829 0,792544 0,455968 0,655614 0,697775 0,695293 0,794140 0,823184 Slovenia 0,708611 0,741460 0,800747 0,722595 0,290891 0,677679 0,653568 0,514126 0,609262 0,827729 Slovakia 0,569183 0,694015 0,713460 0,706867 0,490046 0,728316 0,727689 0,707960 0,705422 0,762447 Source: authors' own computation